

Deconvolution of cellular subsets in human tissue based on targeted DNA methylation analysis at individual CpG sites
- PMID: 33234153
- PMCID: PMC7687708
- DOI: 10.1186/s12915-020-00910-4
Deconvolution of cellular subsets in human tissue based on targeted DNA methylation analysis at individual CpG sites
Abstract
Background: The complex composition of different cell types within a tissue can be estimated by deconvolution of bulk gene expression profiles or with various single-cell sequencing approaches. Alternatively, DNA methylation (DNAm) profiles have been used to establish an atlas for multiple human tissues and cell types. DNAm is particularly suitable for deconvolution of cell types because each CG dinucleotide (CpG site) has only two states per DNA strand-methylated or non-methylated-and these epigenetic modifications are very consistent during cellular differentiation. So far, deconvolution of DNAm profiles implies complex signatures of many CpGs that are often measured by genome-wide analysis with Illumina BeadChip microarrays. In this study, we investigated if the characterization of cell types in tissue is also feasible with individual cell type-specific CpG sites, which can be addressed by targeted analysis, such as pyrosequencing.
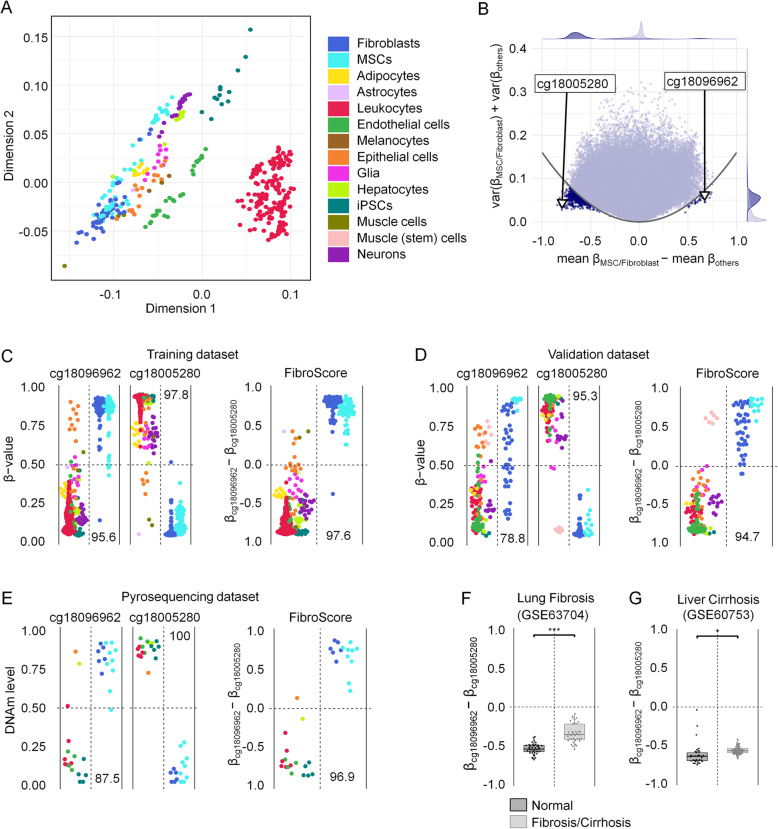
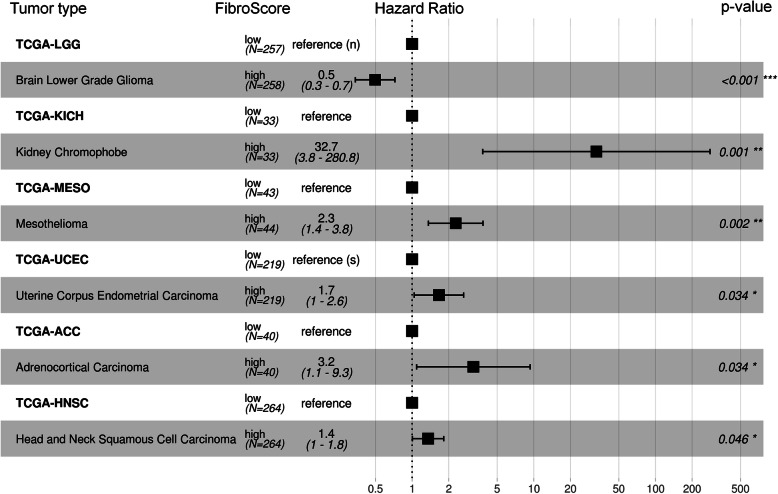
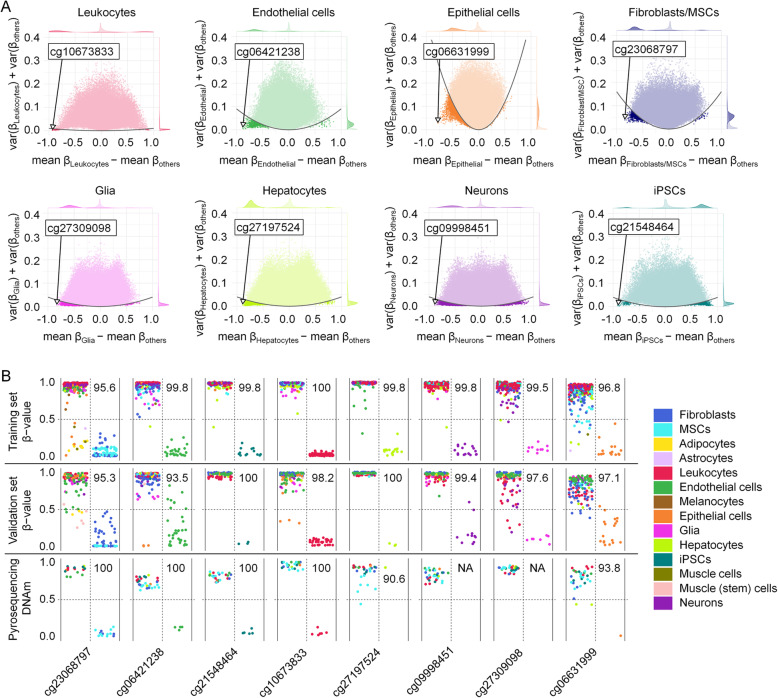
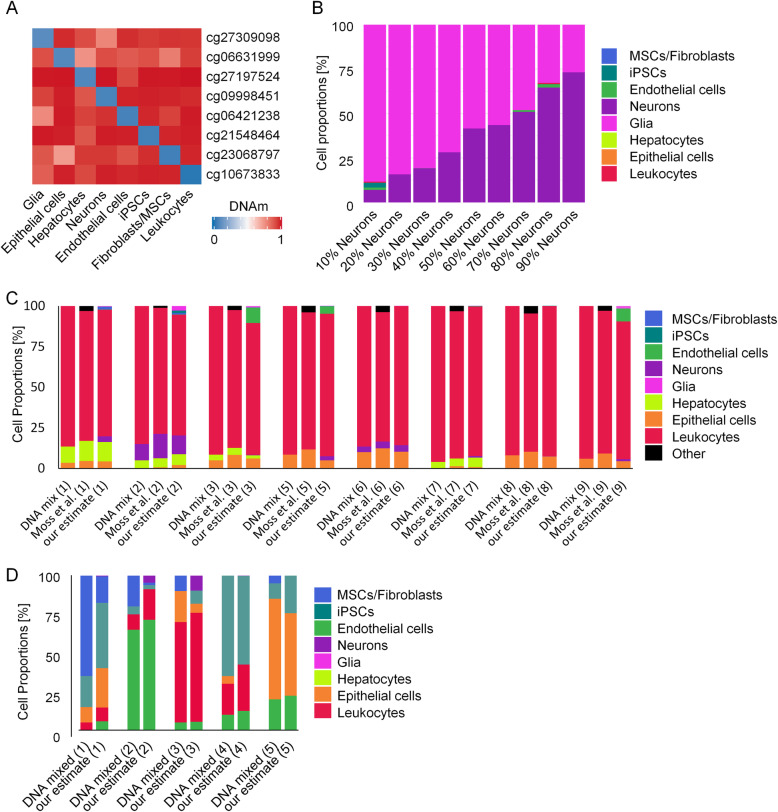
Results: We compiled and curated 579 Illumina 450k BeadChip DNAm profiles of 14 different non-malignant human cell types. A training and validation strategy was applied to identify and test for cell type-specific CpGs. We initially focused on estimating the relative amount of fibroblasts using two CpGs that were either hypermethylated or hypomethylated in fibroblasts. The combination of these two DNAm levels into a "FibroScore" correlated with the state of fibrosis and was associated with overall survival in various types of cancer. Furthermore, we identified hypomethylated CpGs for leukocytes, endothelial cells, epithelial cells, hepatocytes, glia, neurons, fibroblasts, and induced pluripotent stem cells. The accuracy of this eight CpG signature was tested in additional BeadChip datasets of defined cell mixtures and the results were comparable to previously published signatures based on several thousand CpGs. Finally, we established and validated pyrosequencing assays for the relevant CpGs that can be utilized for classification and deconvolution of cell types.
Conclusion: This proof of concept study demonstrates that DNAm analysis at individual CpGs reflects the cellular composition of cellular mixtures and different tissues. Targeted analysis of these genomic regions facilitates robust methods for application in basic research and clinical settings.
Keywords: Cancer; Cell types; CpG; DNA methylation; Deconvolution; Epigenetic; Fibrosis; Human; NNLS; Pyrosequencing.
Conflict of interest statement
W.W. is cofounder of Cygenia GmbH that can provide service for analysis of epigenetic signatures (
Figures
Similar articles
-
DNA methylation correlates of chronological age in diverse human tissue types.Epigenetics Chromatin. 2024 Aug 8;17(1):25. doi: 10.1186/s13072-024-00546-6. Epigenetics Chromatin. 2024. PMID: 39118140 Free PMC article.
-
Systematic evaluation of DNA methylation age estimation with common preprocessing methods and the Infinium MethylationEPIC BeadChip array.Clin Epigenetics. 2018 Oct 16;10(1):123. doi: 10.1186/s13148-018-0556-2. Clin Epigenetics. 2018. PMID: 30326963 Free PMC article.
-
Using Illumina Infinium HumanMethylation 450K BeadChip to explore genome‑wide DNA methylation profiles in a human hepatocellular carcinoma cell line.Mol Med Rep. 2018 Nov;18(5):4446-4456. doi: 10.3892/mmr.2018.9441. Epub 2018 Sep 3. Mol Med Rep. 2018. PMID: 30221710 Free PMC article.
-
Establishing an analytic pipeline for genome-wide DNA methylation.Clin Epigenetics. 2016 Apr 27;8:45. doi: 10.1186/s13148-016-0212-7. eCollection 2016. Clin Epigenetics. 2016. PMID: 27127542 Free PMC article. Review.
-
Anatomy of DNA methylation signatures: Emerging insights and applications.Am J Hum Genet. 2021 Aug 5;108(8):1359-1366. doi: 10.1016/j.ajhg.2021.06.015. Epub 2021 Jul 22. Am J Hum Genet. 2021. PMID: 34297908 Free PMC article. Review.
Cited by
-
Transformative Materials to Create 3D Functional Human Tissue Models In Vitro in a Reproducible Manner.Adv Healthc Mater. 2023 Aug;12(20):e2301030. doi: 10.1002/adhm.202301030. Epub 2023 Jun 13. Adv Healthc Mater. 2023. PMID: 37311209 Free PMC article.
-
Benchmark of cellular deconvolution methods using a multi-assay reference dataset from postmortem human prefrontal cortex.bioRxiv [Preprint]. 2024 Apr 7:2024.02.09.579665. doi: 10.1101/2024.02.09.579665. bioRxiv. 2024. Update in: Genome Biol. 2025 Apr 07;26(1):88. doi: 10.1186/s13059-025-03552-3. PMID: 38405805 Free PMC article. Updated. Preprint.
-
Study Protocol for the Health Outcomes in Pregnancy and Early Childhood (HOPE) Study: A Mother-Infant Study in American Samoa.medRxiv [Preprint]. 2025 Jun 6:2025.06.04.25329013. doi: 10.1101/2025.06.04.25329013. medRxiv. 2025. PMID: 40502564 Free PMC article. Preprint.
-
Physical activity specifically evokes release of cell-free DNA from granulocytes thereby affecting liquid biopsy.Clin Epigenetics. 2022 Feb 22;14(1):29. doi: 10.1186/s13148-022-01245-3. Clin Epigenetics. 2022. PMID: 35193681 Free PMC article.
-
Hematopoietic differentiation persists in human iPSCs defective in de novo DNA methylation.BMC Biol. 2022 Jun 15;20(1):141. doi: 10.1186/s12915-022-01343-x. BMC Biol. 2022. PMID: 35705990 Free PMC article.
References
Publication types
MeSH terms
Grants and funding
- WA1706/8-1/Deutsche Forschungsgemeinschaft/International
- WA1706/12-1 as part of the Clinical Research Unit CRU344/Deutsche Forschungsgemeinschaft/International
- KFO 344/1/Deutsche Forschungsgemeinschaft/International
- O3-3/Center for Clinical Research RWTH Aachen University/International
- 03VP06120/Bundesministerium für Bildung und Forschung/International
LinkOut - more resources
Full Text Sources
Other Literature Sources
