

Prediction of hypotension events with physiologic vital sign signatures in the intensive care unit
- PMID: 33234161
- PMCID: PMC7687996
- DOI: 10.1186/s13054-020-03379-3
Prediction of hypotension events with physiologic vital sign signatures in the intensive care unit
Abstract
Background: Even brief hypotension is associated with increased morbidity and mortality. We developed a machine learning model to predict the initial hypotension event among intensive care unit (ICU) patients and designed an alert system for bedside implementation.
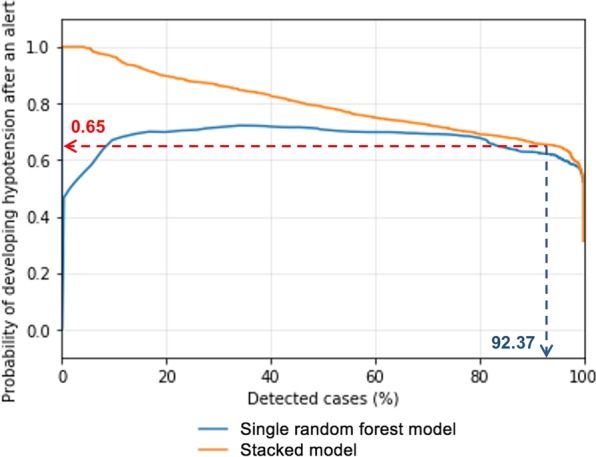
Materials and methods: From the Medical Information Mart for Intensive Care III (MIMIC-3) dataset, minute-by-minute vital signs were extracted. A hypotension event was defined as at least five measurements within a 10-min period of systolic blood pressure ≤ 90 mmHg and mean arterial pressure ≤ 60 mmHg. Using time series data from 30-min overlapping time windows, a random forest (RF) classifier was used to predict risk of hypotension every minute. Chronologically, the first half of extracted data was used to train the model, and the second half was used to validate the trained model. The model's performance was measured with area under the receiver operating characteristic curve (AUROC) and area under the precision recall curve (AUPRC). Hypotension alerts were generated using risk score time series, a stacked RF model. A lockout time were applied for real-life implementation.
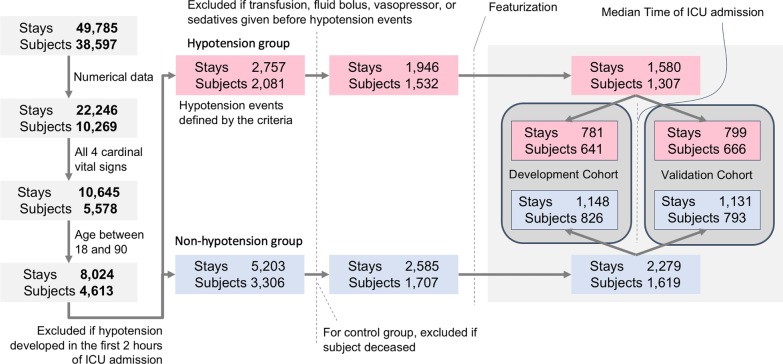
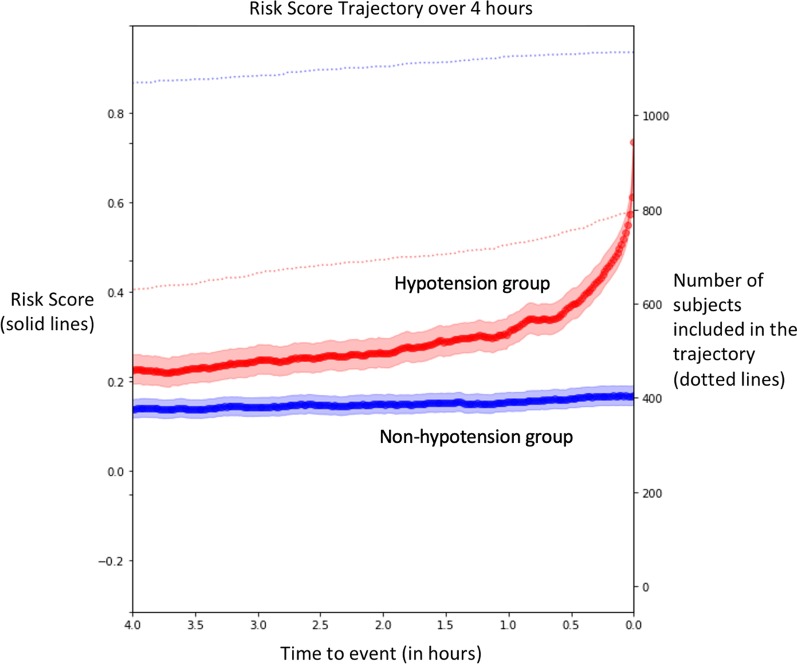
Results: We identified 1307 subjects (1580 ICU stays) as the hypotension group and 1619 subjects (2279 ICU stays) as the non-hypotension group. The RF model showed AUROC of 0.93 and 0.88 at 15 and 60 min, respectively, before hypotension, and AUPRC of 0.77 at 60 min before. Risk score trajectories revealed 80% and > 60% of hypotension predicted at 15 and 60 min before the hypotension, respectively. The stacked model with 15-min lockout produced on average 0.79 alerts/subject/hour (sensitivity 92.4%).
Conclusion: Clinically significant hypotension events in the ICU can be predicted at least 1 h before the initial hypotension episode. With a highly sensitive and reliable practical alert system, a vast majority of future hypotension could be captured, suggesting potential real-life utility.
Keywords: Artificial intelligence; Hypotension; Machine learning; Prediction.
Conflict of interest statement
Dr. Pinsky is the inventor of a University of Pittsburgh-owned US Patent No. 10,631,792 “System and method of determining susceptibility to cardiorespiratory insufficiency” that directly applies these approaches to hypotension prediction. The other authors have no competing financial or non-financial interests for current work.
Figures


References
-
- Fitch W, Mackenzie ET, Harper AM. Effects of decreasing arterial blood pressure on cerebral blood flow in the baboon. Influence of the sympathetic nervous system. Circ Res. 1975;37:550–557. - PubMed
-
- Walsh M, Devereaux PJ, Garg AX, et al. Relationship between intraoperative mean arterial pressure and clinical outcomes after noncardiac surgery: toward an empirical definition of hypotension. Anesthesiology. 2013;119:507–515. - PubMed
-
- Ahuja S, Mascha EJ, Yang D, et al. Association of intraoperative radial arterial systolic, diastolic, mean, and pulse pressures with myocardial and acute kidney injury after noncardiac surgery: a retrospective cohort analysis. Anesthesiology. 2020;132(2):291–306. - PubMed
-
- Arlati S, Brenna S, Prencipe L, et al. Myocardial necrosis in ICU patients with acute non-cardiac disease: a prospective study. Intensive Care Med. 2000;26:31–37. - PubMed
Publication types
MeSH terms
Grants and funding
LinkOut - more resources
Full Text Sources
Medical
