

Rice SST Variation Shapes the Rhizosphere Bacterial Community, Conferring Tolerance to Salt Stress through Regulating Soil Metabolites
- PMID: 33234605
- PMCID: PMC7687028
- DOI: 10.1128/mSystems.00721-20
Rice SST Variation Shapes the Rhizosphere Bacterial Community, Conferring Tolerance to Salt Stress through Regulating Soil Metabolites
Abstract
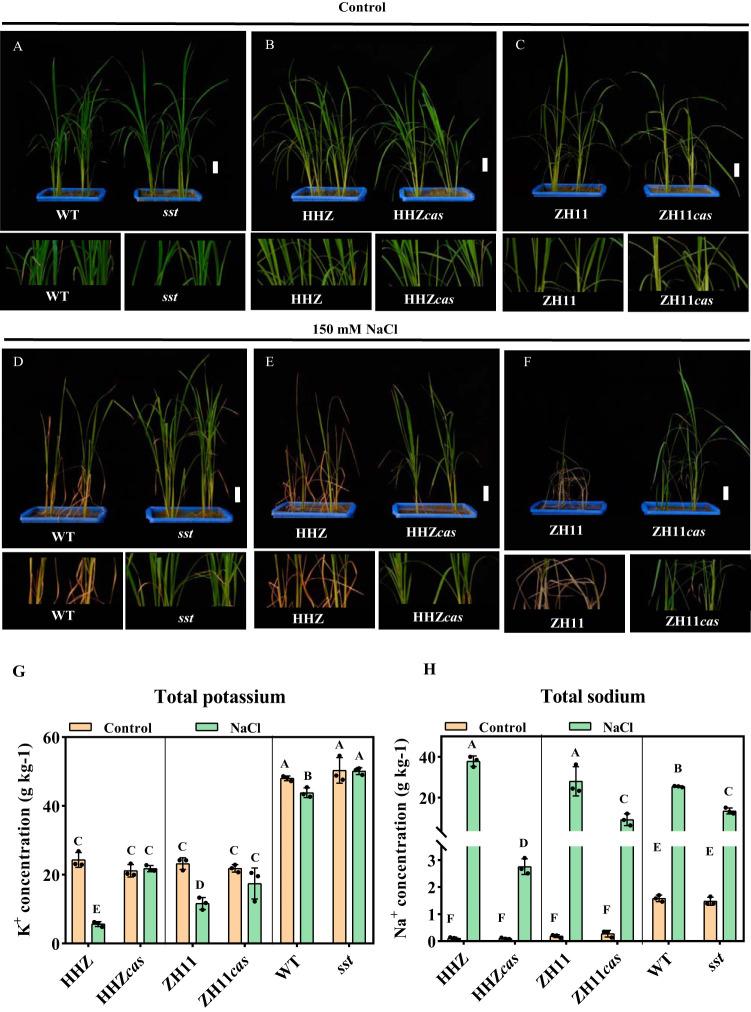
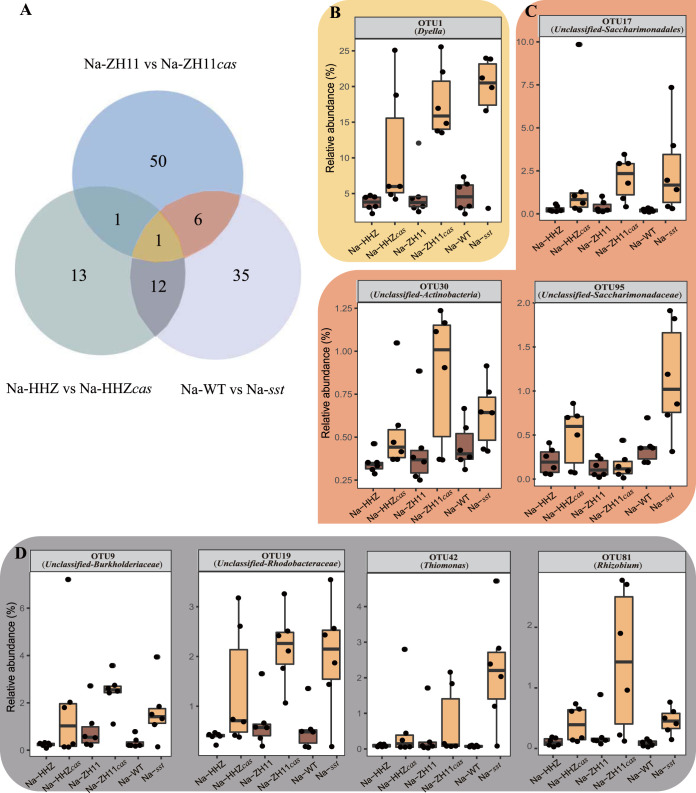
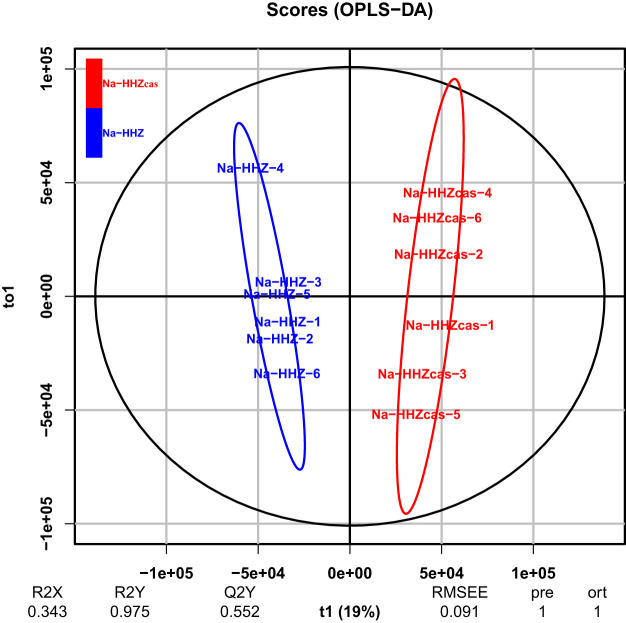
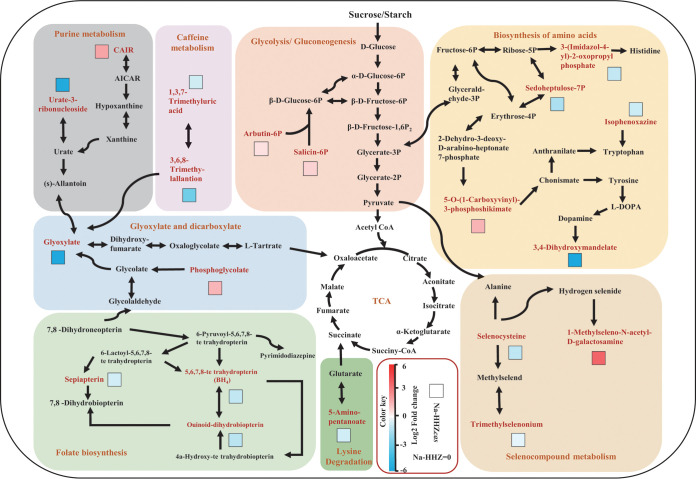
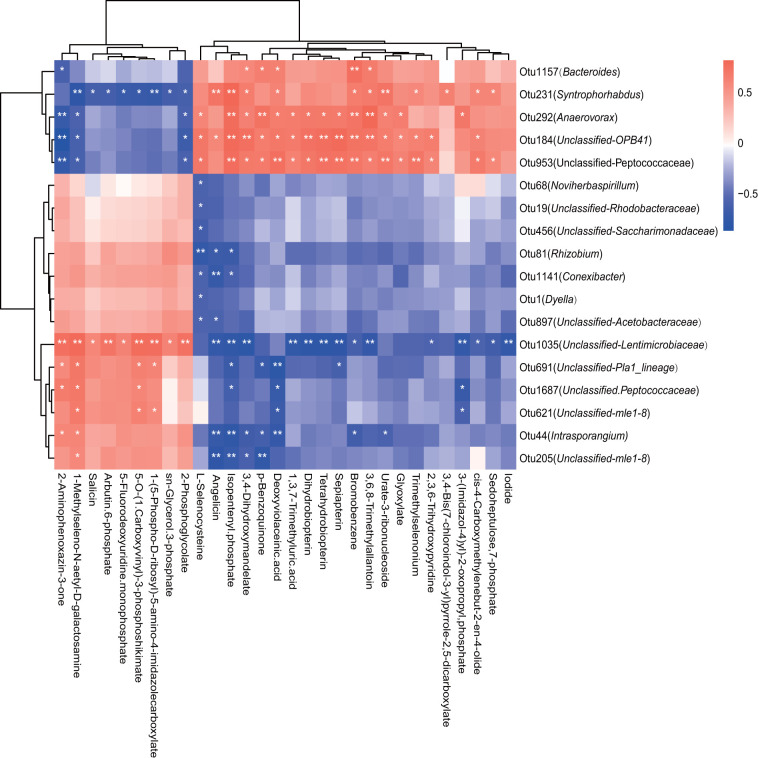
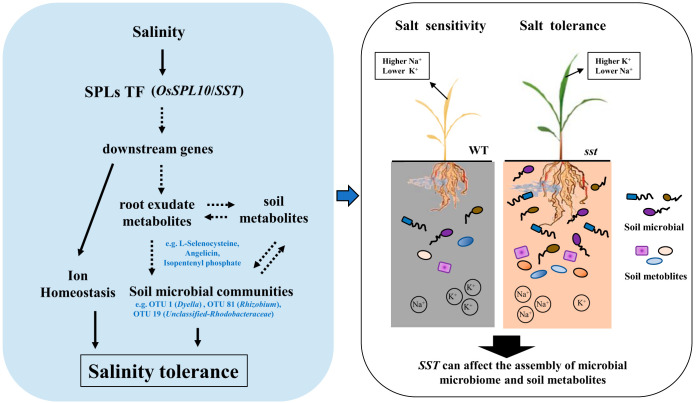
Some plant-specific resistance genes could affect rhizosphere microorganisms by regulating the release of root exudates. In a previous study, the SST (seedling salt tolerant) gene in rice (Oryza sativa) was identified, and loss of SST function resulted in better plant adaptation to salt stress. However, whether the rice SST variation could alleviate salt stress via regulating soil metabolites and microbiota in the rhizosphere is still unknown. Here, we used transgenic plants with SST edited in the Huanghuazhan (HHZ) and Zhonghua 11 (ZH11) cultivars by the CRISPR/Cas9 system and found that loss of SST function increased the accumulation of potassium and reduced the accumulation of sodium ions in rice plants. Using 16S rRNA gene amplicon high-throughput sequencing, we found that the mutant material shifted the rhizobacterial assembly under salt-free stress. Importantly, under salt stress, the sst, HHZcas, and ZH11cas plants significantly changed the assembly of the rhizobacteria. Furthermore, the rice SST gene also affected the soil metabolites, which were closely related to the dynamics of rhizosphere microbial communities, and we further determined the relationship between the rhizosphere microbiota and soil metabolites. Overall, our results show the effects of the rice SST gene on the response to salt stress associated with the soil microbiota and metabolites in the rhizosphere. This study reveals a helpful linkage among the rice SST gene, soil metabolites, and rhizobacterial community assembly and also provides a theoretical basis for improving crop adaptation through soil microbial management practices.IMPORTANCE Soil salinization is one of the major environmental stresses limiting crop productivity. Crops in agricultural ecosystems have developed various strategies to adapt to salt stress. We used rice mutant and CRISPR-edited lines to investigate the relationships among the
Keywords: Oryza sativa; SST variation; rhizosphere bacterial community; salt tolerant; soil metabolites.
Copyright © 2020 Lian et al.
Figures

Similar articles
-
Salt stress affects the bacterial communities in rhizosphere soil of rice.Front Microbiol. 2024 Dec 6;15:1505368. doi: 10.3389/fmicb.2024.1505368. eCollection 2024. Front Microbiol. 2024. PMID: 39712891 Free PMC article.
-
Microbiome-metabolome analysis directed isolation of rhizobacteria capable of enhancing salt tolerance of Sea Rice 86.Sci Total Environ. 2022 Oct 15;843:156817. doi: 10.1016/j.scitotenv.2022.156817. Epub 2022 Jun 21. Sci Total Environ. 2022. PMID: 35750176
-
Plant growth-promoting bacteria Bacillus amyloliquefaciens NBRISN13 modulates gene expression profile of leaf and rhizosphere community in rice during salt stress.Plant Physiol Biochem. 2013 May;66:1-9. doi: 10.1016/j.plaphy.2013.01.020. Epub 2013 Feb 14. Plant Physiol Biochem. 2013. PMID: 23454292
-
Microbially Mediated Plant Salt Tolerance and Microbiome-based Solutions for Saline Agriculture.Biotechnol Adv. 2016 Nov 15;34(7):1245-1259. doi: 10.1016/j.biotechadv.2016.08.005. Epub 2016 Aug 30. Biotechnol Adv. 2016. PMID: 27587331 Review.
-
Metabolomics-mediated elucidation of rice responses to salt stress.Planta. 2023 Nov 3;258(6):111. doi: 10.1007/s00425-023-04258-1. Planta. 2023. PMID: 37919614 Review.
Cited by
-
Arbuscular mycorrhizal fungi enhance phosphate uptake and alter bacterial communities in maize rhizosphere soil.Front Plant Sci. 2023 Jun 22;14:1206870. doi: 10.3389/fpls.2023.1206870. eCollection 2023. Front Plant Sci. 2023. PMID: 37426987 Free PMC article.
-
Enhancing Akkermansia growth via phytohormones: a strategy to modulate the gut-bone axis in postmenopausal osteoporosis therapy.J Transl Med. 2025 Apr 9;23(1):410. doi: 10.1186/s12967-025-06426-1. J Transl Med. 2025. PMID: 40205438 Free PMC article.
-
The influence of endophytes on rice fitness under environmental stresses.Plant Mol Biol. 2022 Jul;109(4-5):447-467. doi: 10.1007/s11103-021-01219-8. Epub 2021 Dec 2. Plant Mol Biol. 2022. PMID: 34859329 Free PMC article. Review.
-
Diversity and composition of soil microbial communities in the rhizospheres of late blight-resistant tomatoes after Phytophthora infestans inoculation.Front Plant Sci. 2025 Mar 7;16:1556928. doi: 10.3389/fpls.2025.1556928. eCollection 2025. Front Plant Sci. 2025. PMID: 40123946 Free PMC article.
-
The Rice-Microbe Nexus: Unlocking Productivity Through Soil Science.Rice (N Y). 2025 Jun 20;18(1):56. doi: 10.1186/s12284-025-00809-0. Rice (N Y). 2025. PMID: 40540085 Free PMC article. Review.
References
-
- Ishitani M, Rao I, Wenzl P, Beebe S, Tohme J. 2004. Integration of genomics approach with traditional breeding towards improving abiotic stress adaptation: drought and aluminum toxicity as case studies. Field Crop Res 90:35–45. doi:10.1016/j.fcr.2004.07.004. - DOI
LinkOut - more resources
Full Text Sources
