. 2021 Jan 20;41(3):489-501.
doi: 10.1523/JNEUROSCI.0388-20.2020. Epub 2020 Nov 24.

Enhancing GABAergic Tone in the Rostral Nucleus of the Solitary Tract Reconfigures Sensorimotor Neural Activity

Affiliations

Enhancing GABAergic Tone in the Rostral Nucleus of the Solitary Tract Reconfigures Sensorimotor Neural Activity

Joshua D Sammons et al. J Neurosci. .

Abstract

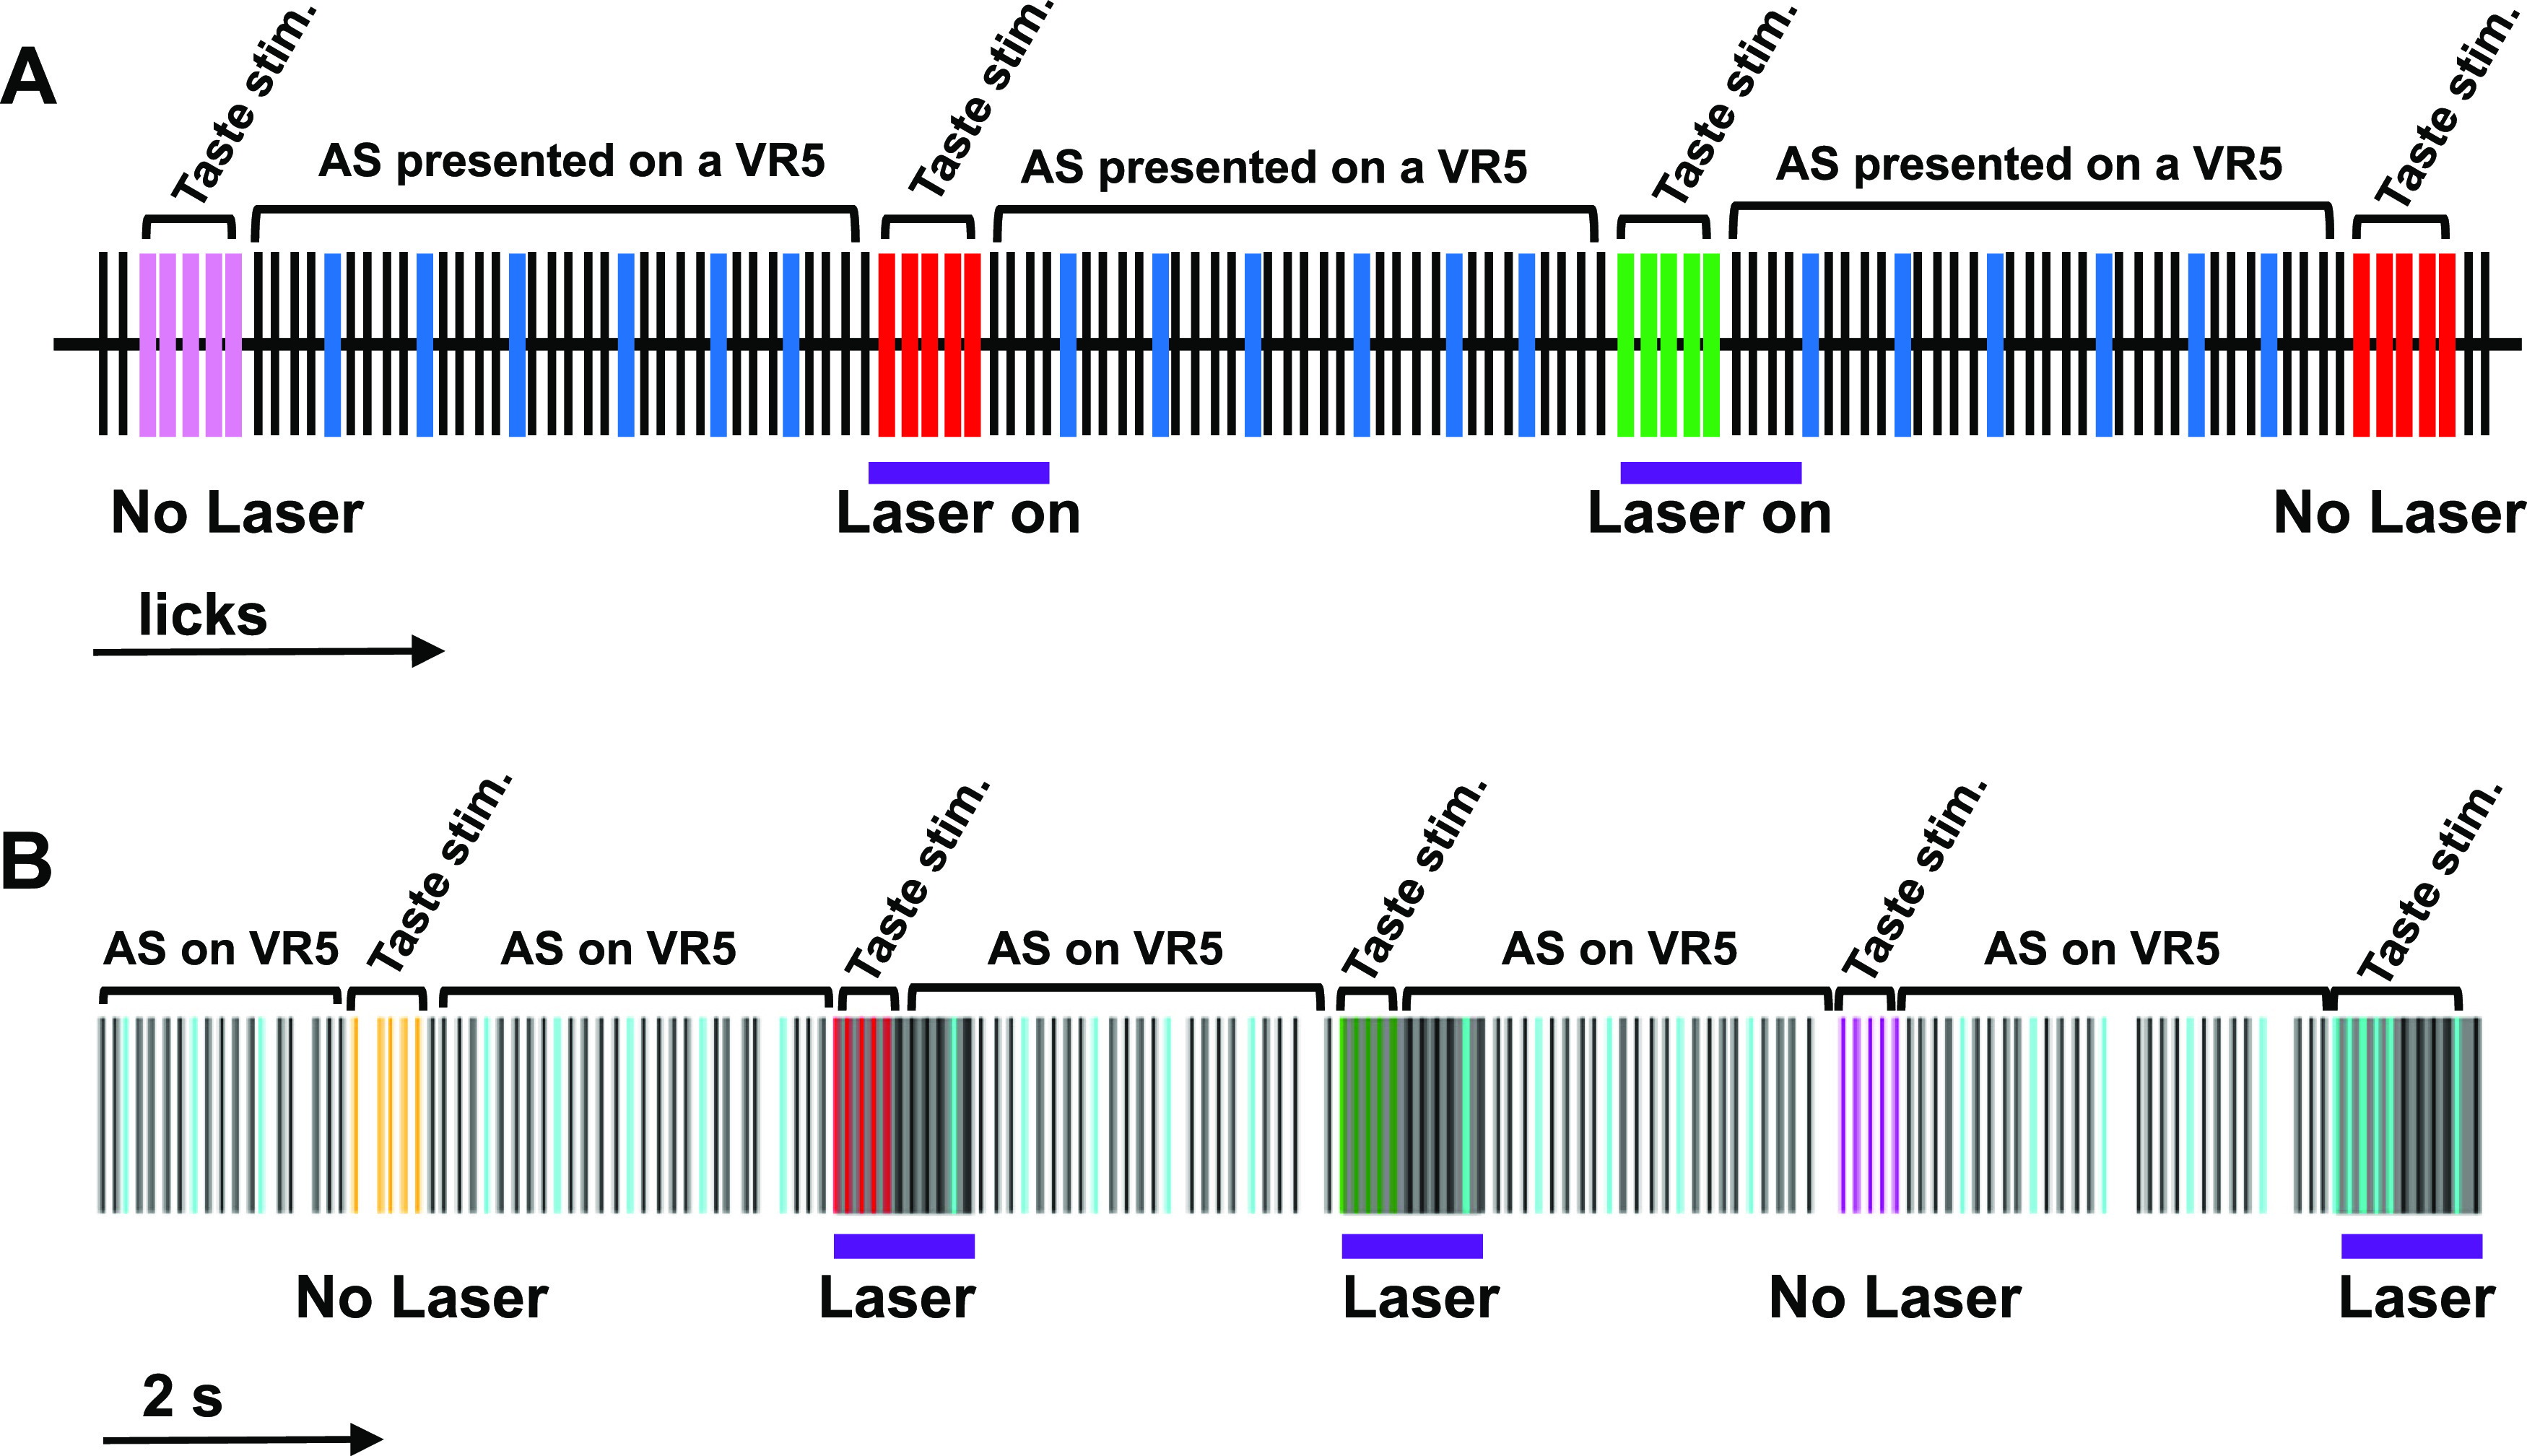
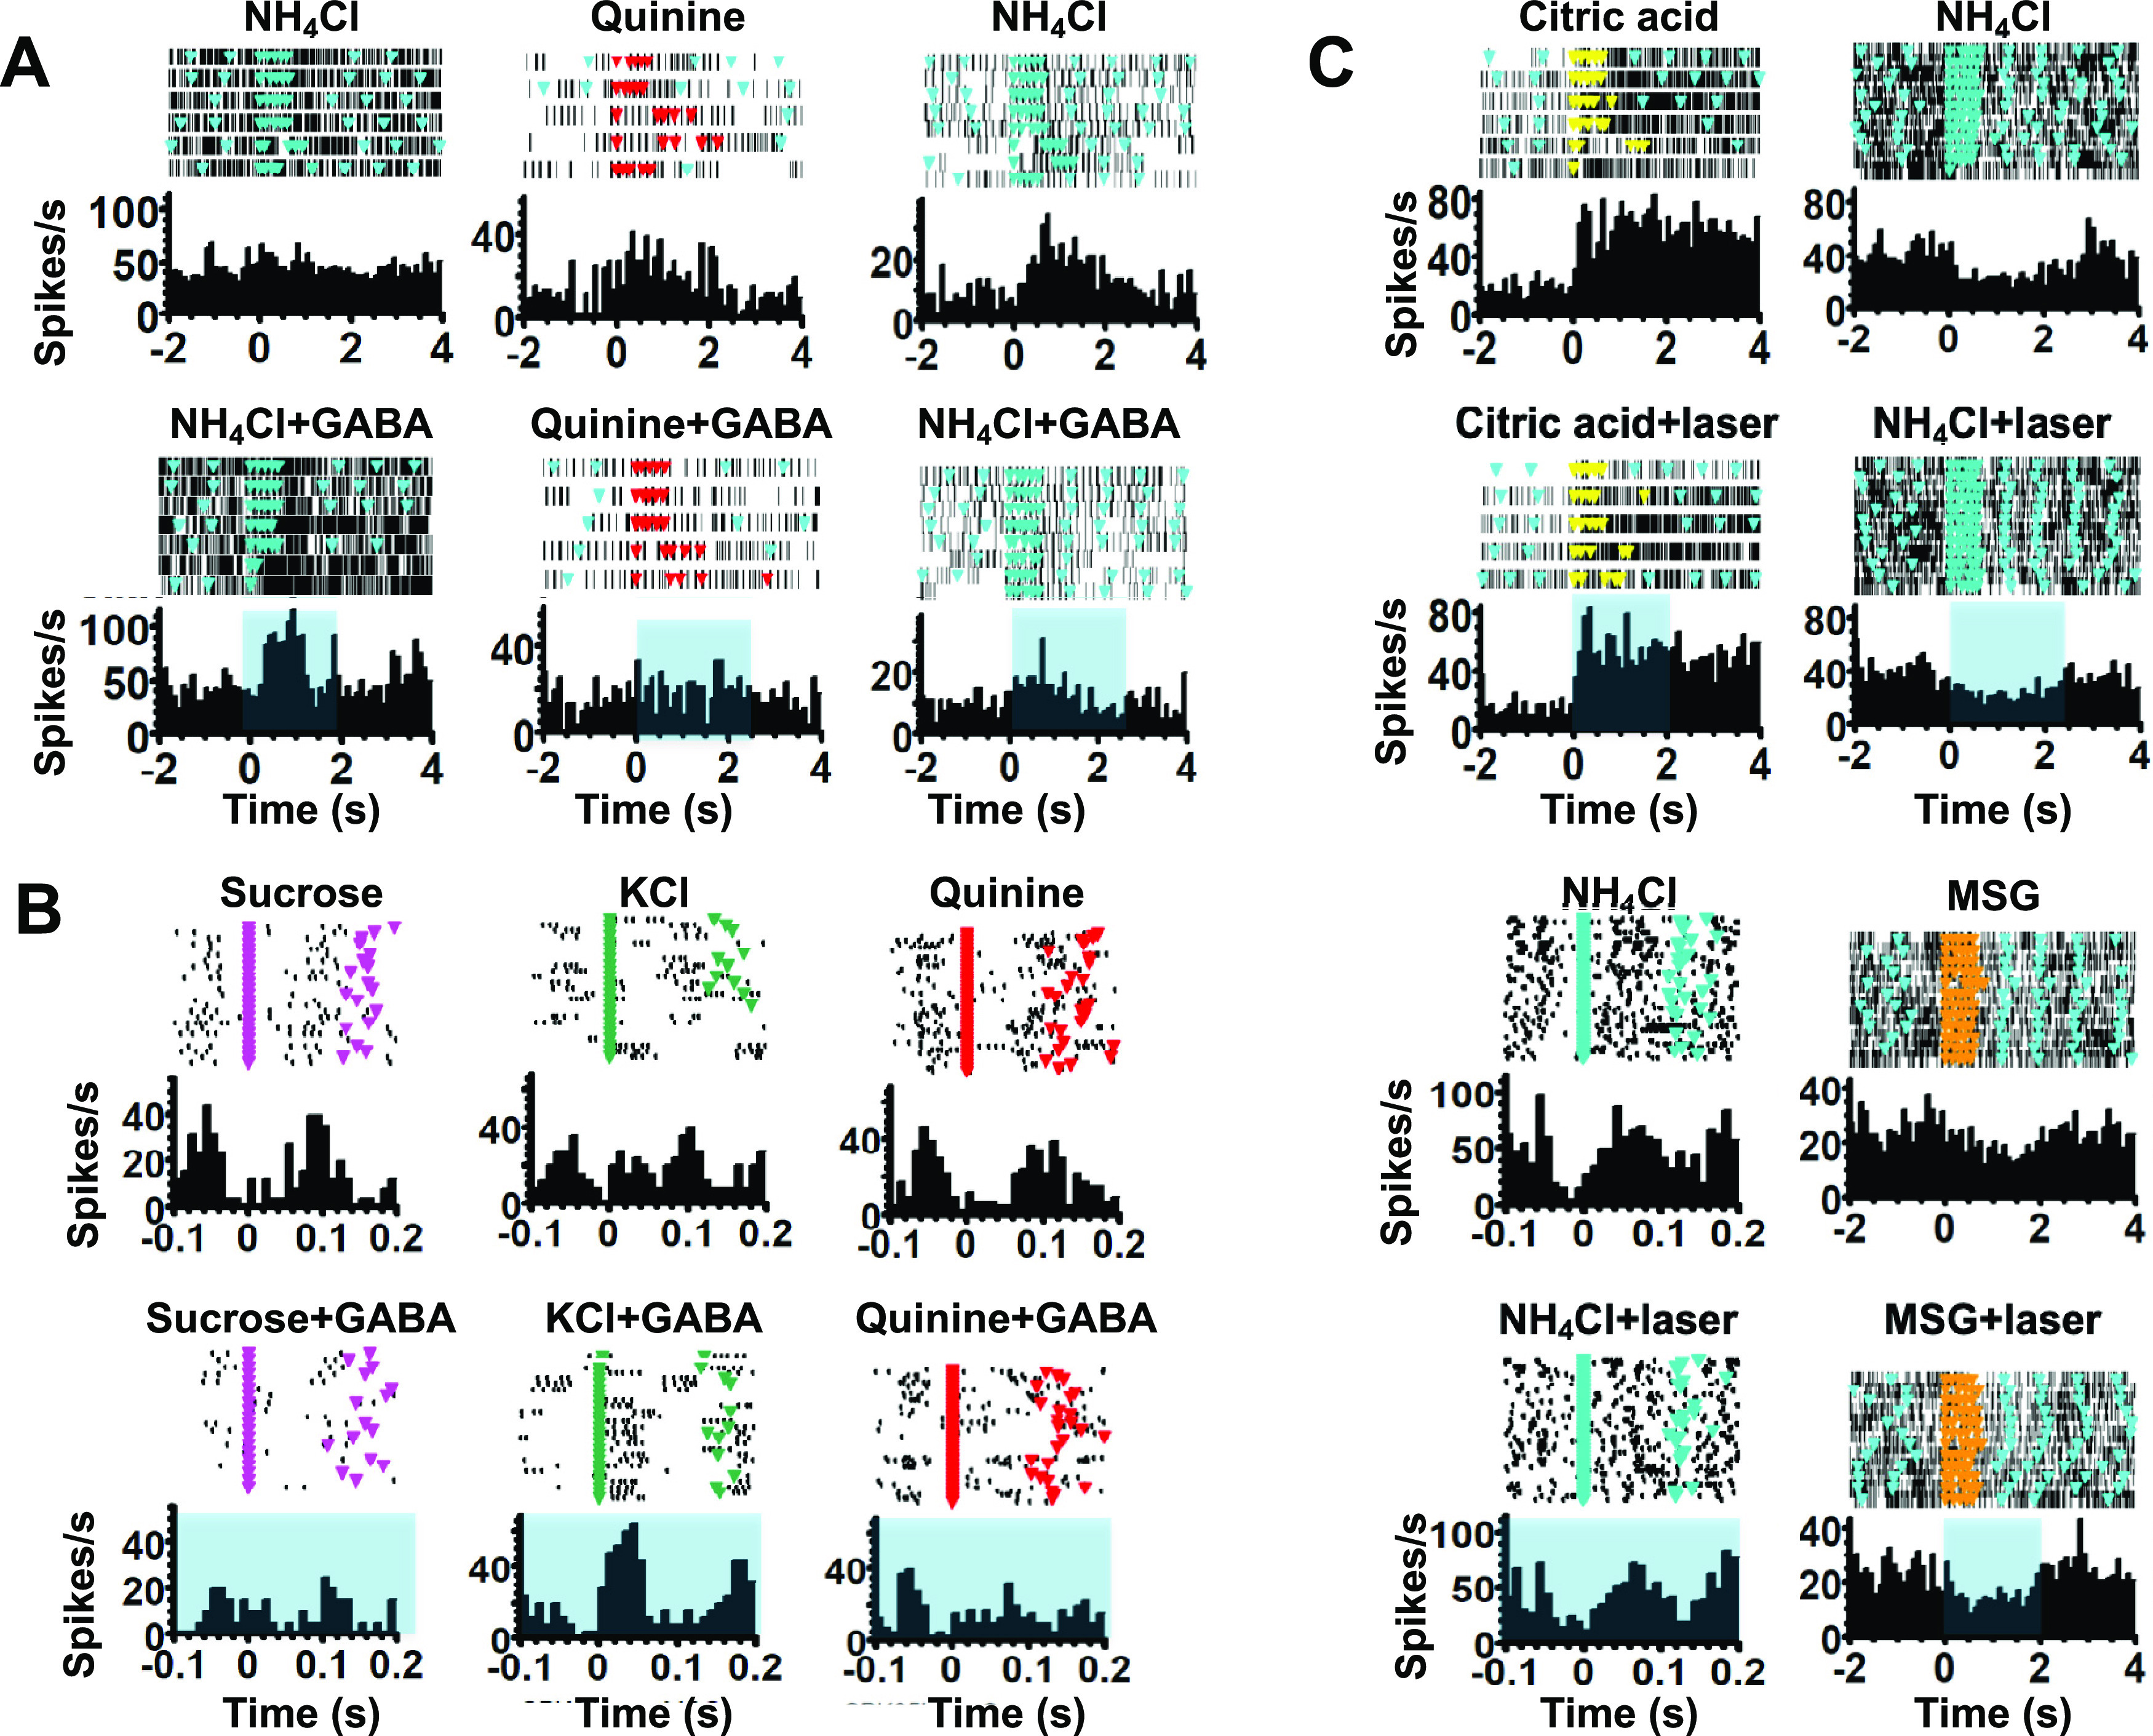
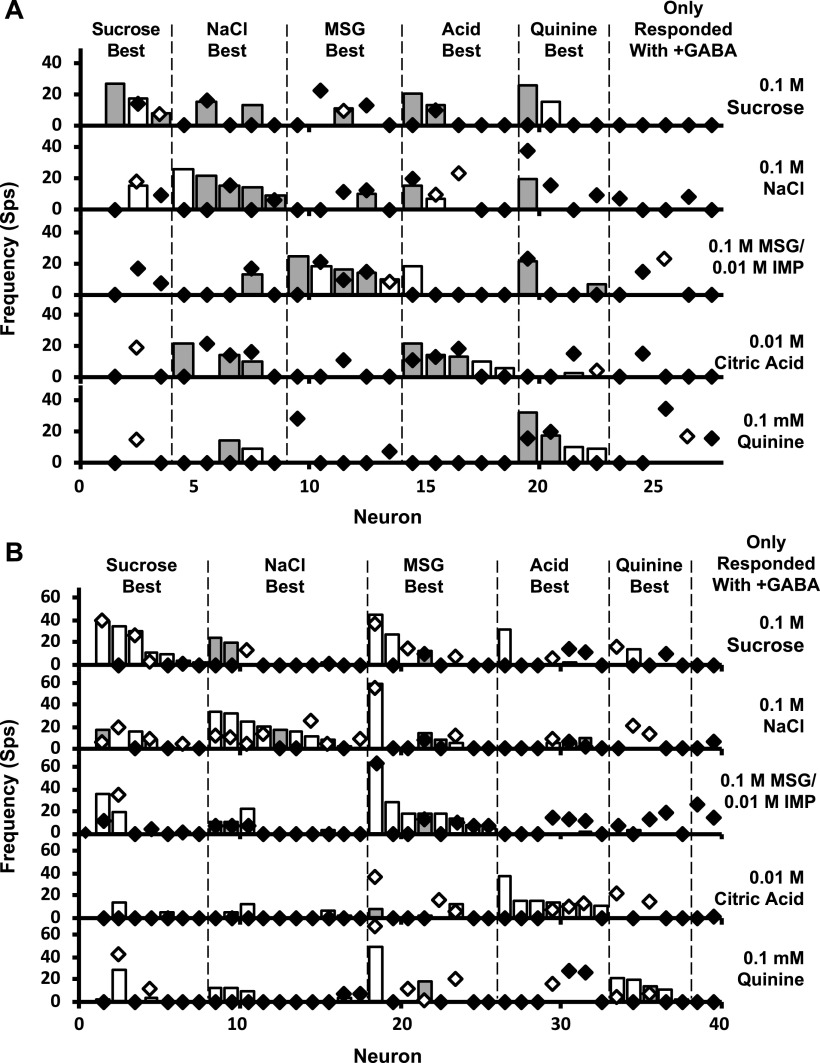
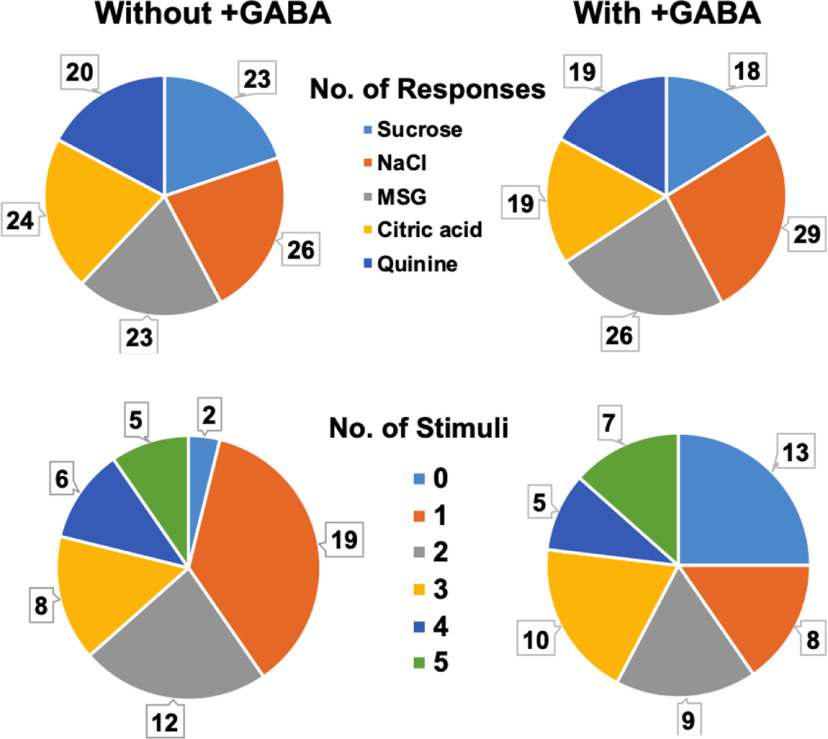
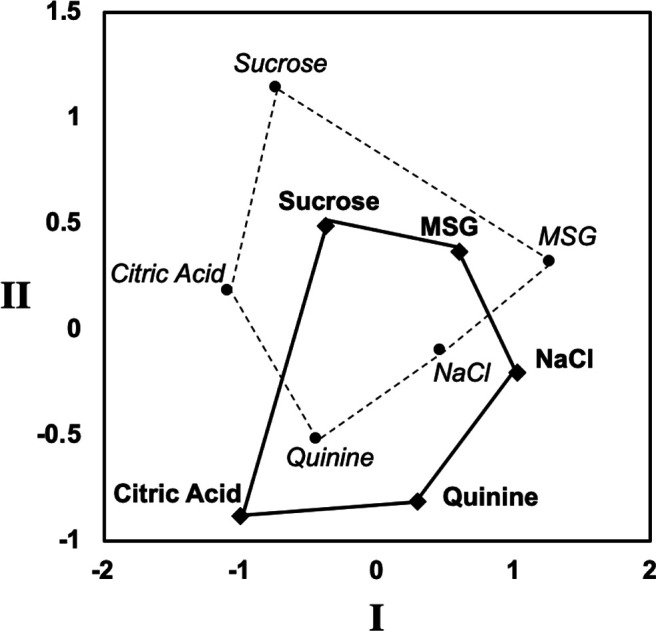
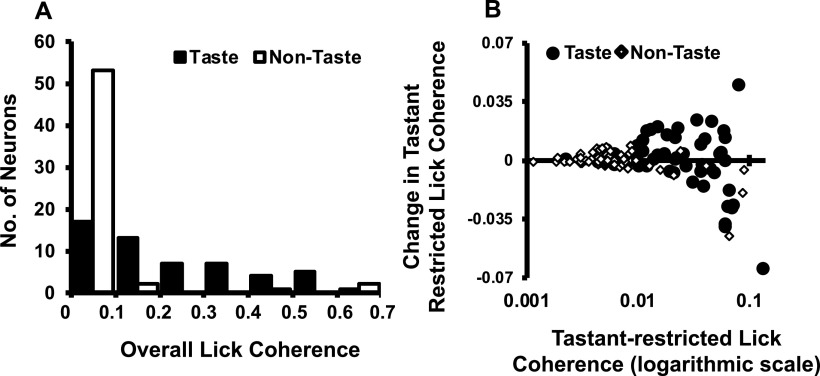
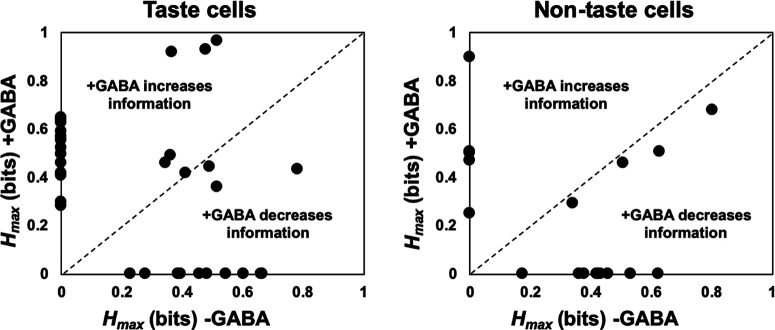
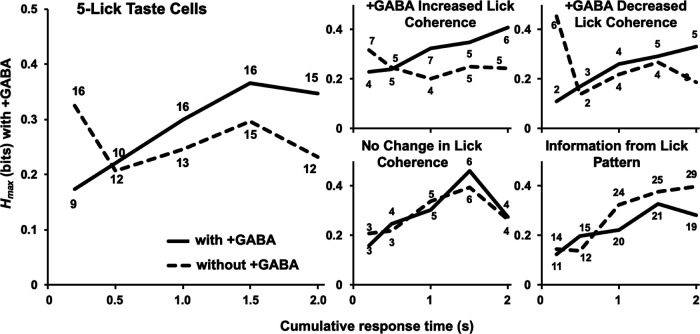
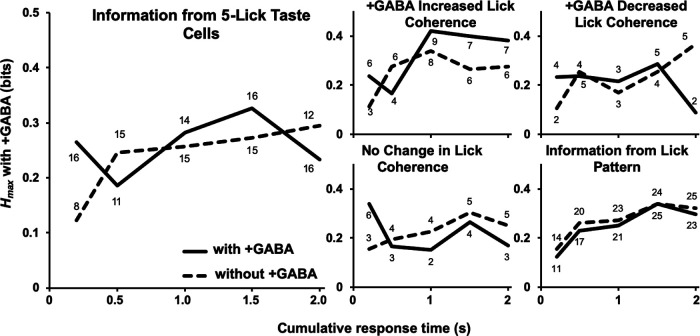
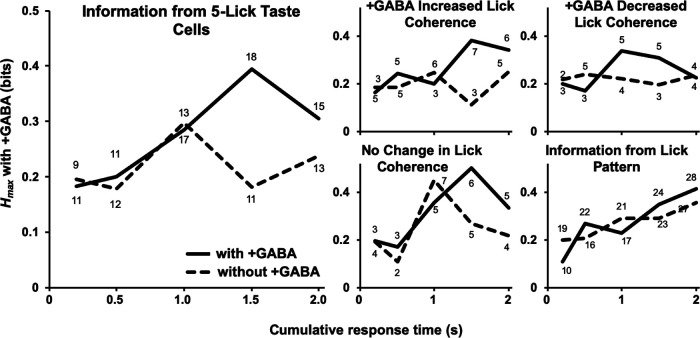
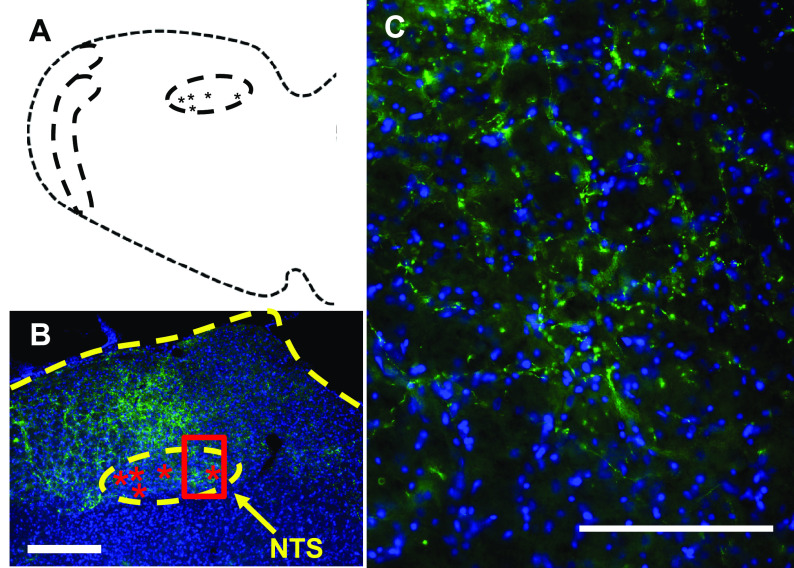
Recent work has shown that most cells in the rostral, gustatory portion of the nucleus tractus solitarius (rNTS) in awake, freely licking rats show lick-related firing. However, the relationship between taste-related and lick-related activity in rNTS remains unclear. Here, we tested whether GABA-derived inhibitory activity regulates the balance of lick- and taste-driven neuronal activity. Combinatorial viral tools were used to restrict the expression of channelrhodopsin 2-enhanced yellow fluorescent protein to GAD1+ GABAergic neurons. Viral infusions were bilateral in rNTS. A fiber-optic fiber attached to a bundle of drivable microwires was later implanted into the rNTS. After recovery, water-deprived rats were presented with taste stimuli in an experimental chamber. Trials were five consecutive taste licks [NaCl, KCl, NH4Cl, sucrose, monosodium glutamate/inosine-5'-monophosphate, citric acid, quinine, or artificial saliva (AS)] separated by five AS rinse licks on a variable ratio 5 schedule. Each taste lick triggered a 1 s train of laser light (25 Hz; 473 nm; 8-10 mW) in a random half of the trials. In all, 113 cells were recorded in the rNTS, 50 cells responded to one or more taste stimuli without GABA enhancement. Selective changes in response magnitude (spike count) within cells shifted across-unit patterns but preserved interstimulus relationships. Cells where enhanced GABAergic tone increased lick coherence conveyed more information distinguishing basic taste qualities and different salts than other cells. In addition, GABA activation significantly amplified the amount of information that discriminated palatable versus unpalatable tastants. By dynamically regulating lick coherence and remodeling the across-unit response patterns to taste, enhancing GABAergic tone in rNTS reconfigures the neural activity reflecting sensation and movement.

Keywords: GABA; brainstem; gustatory; neural coding; nucleus of the solitary tract; taste.


Conflict of interest statement

The authors declare no competing financial interests.

Figures

Figure 1.
Figure 1.
A, Schematic diagram of the experimental protocol. Each vertical line represents a lick. Colored lines represent reinforced licks; black lines represent dry licks. Taste stimuli were presented as five consecutive reinforced licks. A random half of the taste stimuli were accompanied by laser activation that lasted 1 s following each tastant lick. Between taste stimulus trials, six AS licks were presented on a VR5 schedule. Note that AS was used both as one of the taste stimuli and as the rinse for all of the tastants. B, A 30 s sequence of licks from an actual test session showing taste stimulus presentations with and without laser. Note that in A, the horizontal axis is schematic and shows the licks equally spaced; in B, the horizontal axis is time, and the tickmarks indicate actual lick timing.
Figure 2.
Figure 2.
Examples of the effects of GABA activation on taste stimuli in six different cells. A, B, Top row, Responses without GABA stimulation. Bottom row, Responses with GABA enhancement. The top of each panel shows raster plots of each trial, with black lines/dots signifying the occurrence of a spike. Colored triangles indicate reinforced licks. Light blue triangles show AS licks. The bottom of each panel shows a PSTH of the response, in spikes per second. Shaded area indicates the presence of the laser. For lick-by-lick responses, the laser is presented for the entire lick-by-lick response. A, Examples of five-lick responses with and without GABA stimulation in three different cells. B, Examples of lick-by-lick responses from three different cells with and without GABA stimulation. C, Examples of the effects of laser application in the rNTS in animals that were not infused with virus.
Figure 3.
Figure 3.
Taste response magnitudes of rNTS neurons with and without GABA stimulation. The absolute value of each response was calculated for the A, 27 five-lick and B, 41 lick-by-lick taste neurons. Filled bars/diamonds indicate excitatory responses; empty bars/diamonds indicate inhibitory responses. Thirteen neurons responded on both time scales. Neurons were separated by their best-stimulus response without GABA stimulation (gray bars). Responses during GABA stimulation (diamonds) are overlaid on the nonstimulated responses. Neurons that showed taste responses only during GABA stimulation are shown at the far right.
Figure 4.
Figure 4.
Pie graphs showing the distribution of the number of responses to each of the five basic tastants (top) and the number of tastants to which a neuron responds (bottom). Graphs on the left are distributions without GAB activation; graphs on the right show the distributions with GABA activation. Although each tastant evoked about the same number of responses across the sample, neurons were significantly more narrowly tuned with GABA stimulation. See text for details.
Figure 5.
Figure 5.
Multidimensional scaling of taste response magnitudes. Pearson's correlations were used as a measure of similarity for across-unit patterns evoked by tastants. A dashed line connects the patterns evoked by taste stimuli without GABA stimulation; a solid line connects the patterns evoked by taste stimuli with GABA stimulation. Gutman stress values were as follows: one dimension, 0.281; two dimensions, 0.108; three dimensions, 0.062; four dimensions, 0.026; five dimensions, 0.017. GABA activation shifted the location of all taste-evoked across-unit patterns, but the overall organization was unchanged.
Figure 6.
Figure 6.
Lick coherence in taste-responsive and non-taste-responsive neurons. A, Distribution of overall lick coherence values for both taste (filled bars) and nontaste (hollow bars) neurons. Overall lick coherence values were calculated using all licks whether the lick was reinforced or not. B, Change in tastant-restricted lick coherence values with GABA stimulation (ordinate) with taste-restricted lick coherence without GABA activation shown on the abscissa.
Figure 7.
Figure 7.
Information (in bits) conveyed about taste quality in taste and nontaste neurons in rNTS. For each cell, Hmax was plotted without versus with laser-stimulated GABA release. Taste cells (left) or non-taste cells (right). Only neurons with at least six trials for each tastant were used. Information was conveyed by the temporal aspects of taste responses in 33 of 54 (61%) taste cells and 18 of 59 (31%) non-taste cells. GABA stimulation either enhanced or attenuated information conveyed about taste quality in 73% taste cells (24 of 33) and 78% of nontaste cells (4 of 18).
Figure 8.
Figure 8.
Information (in bits) conveyed about the five prototypical tastants from the population of rNTS neurons over the first 2 s of response. Separate analyses were conducted at each response interval. Temporal coding information obtained with (solid line) and without (dashed line) GABA stimulation is shown. Left, Information for all taste cells with five-lick responses. Right, Neurons were separated into groups depending on how GABA stimulation affected stimulus-restricted lick coherence. Also shown is the effect of GABA stimulation on the taste-related information conveyed by the lick pattern. Numbers adjacent to each data point denote the number of neurons in which significant taste quality information was obtained. GABA stimulation enhanced the information conveyed about salty tastes only in those cells where GABA also enhanced lick coherence. GABA stimulation did not affect the information conveyed by the lick pattern.
Figure 9.
Figure 9.
Information (in bits) conveyed about salty tastants (NaCl, KCl, and NH4Cl) from the population of rNTS neurons over the first 2 s of response. Separate analyses were conducted at each response interval. Temporal coding information obtained with (solid line) and without (dashed line) GABA stimulation is shown. Left, Information for all taste ells with five-lick responses. Right, Neurons were separated into groups depending on how GABA stimulation affected stimulus-restricted lick coherence. Also shown is the effect of GABA stimulation on the taste-related information conveyed by the lick pattern. Numbers adjacent to each data point denote number of neurons in which significant taste quality information was obtained. GABA stimulation enhanced the information conveyed about salty tastes only in those cells where GABA also enhanced lick coherence. GABA stimulation did not affect the information conveyed by the lick pattern.
Figure 10.
Figure 10.
Information (in bits) conveyed about palatable (sucrose, NaCl) versus unpalatable (citric acid, quinine) from the population of rNTS neurons over the first 2 s of response. Separate analyses were conducted at each response interval. Temporal coding information obtained with (solid line) and without (dashed line) GABA stimulation is shown. Left, Information for all taste cells with five-lick responses. Right, Neurons were separated into groups depending on how GABA stimulation affected stimulus-restricted lick coherence. Also shown is the effect of GABA stimulation on the taste-related information conveyed by the lick pattern. Numbers adjacent to each data point denote number of neurons in which significant taste quality information was obtained. Regardless of the effect of GABA stimulation on lick coherence, GABA stimulation enhanced the information conveyed about taste palatability in taste responses >1 s. GABA stimulation did not affect the information conveyed by the lick pattern.
Figure 11.
Figure 11.
Histologic reconstruction of neuronal recordings and channelrhodopsin expression in the rNTS. A, Schematic diagram of the brainstem with a dashed oval outlining the rNTS and the center of the lesion associated with each of the five rats from which data were collected are represented by an asterisk (*). Lesions ranged from 11.76 to 12.48 mm posterior to bregma. B, Image of the rNTS (dashed yellow oval); red box represents the magnified inset. Scale bar, 500 µm. C, Magnified image of rNTS. Channelrhodopsin, green; DAPI, blue. Scale bar, 100 µm.

Similar articles

Cited by

References

    1. Batten TF, Gamboa-Esteves FO, Saha S (2002) Evidence for peptide co-transmission in retrograde- and anterograde-labelled central nucleus of amygdala neurones projecting to NTS. Auton Neurosci 98:28–32. 10.1016/s1566-0702(02)00026-7 - DOI - PubMed
    1. Benjamini Y, Hochberg Y (1995) Controlling the false discovery rate: a practical and powerful approach to multiple testing. J R Stat Soc Series B Stat Methodol 57:289–300. 10.1111/j.2517-6161.1995.tb02031.x - DOI
    1. Boxwell AJ, Yanagawa Y, Travers SP, Travers JB (2013) The μ-opioid receptor agonist DAMGO presynaptically suppresses solitary tract-evoked input to neurons in the rostral solitary nucleus. J Neurophysiol 109:2815–2826. 10.1152/jn.00711.2012 - DOI - PMC - PubMed
    1. Breza JM, Nikonov AA, Contreras RJ (2010) Response latency to lingual taste stimulation distinguishes neuron types within the geniculate ganglion. J Neurophysiol 103:1771–1784. 10.1152/jn.00785.2009 - DOI - PMC - PubMed
    1. Cho YK, Li CS, Smith DV (2002) Taste responses of neurons of the hamster solitary nucleus are enhanced by lateral hypothalamic stimulation. J Neurophysiol 87:1981–1992. 10.1152/jn.00765.2001 - DOI - PubMed

Publication types