. 2020 Dec 9;40(50):9701-9714.
doi: 10.1523/JNEUROSCI.0989-20.2020. Epub 2020 Nov 24.

Activation of Granule Cell Interneurons by Two Divergent Local Circuit Pathways in the Rat Olfactory Bulb

Affiliations

Activation of Granule Cell Interneurons by Two Divergent Local Circuit Pathways in the Rat Olfactory Bulb

R Todd Pressler et al. J Neurosci. .

Abstract

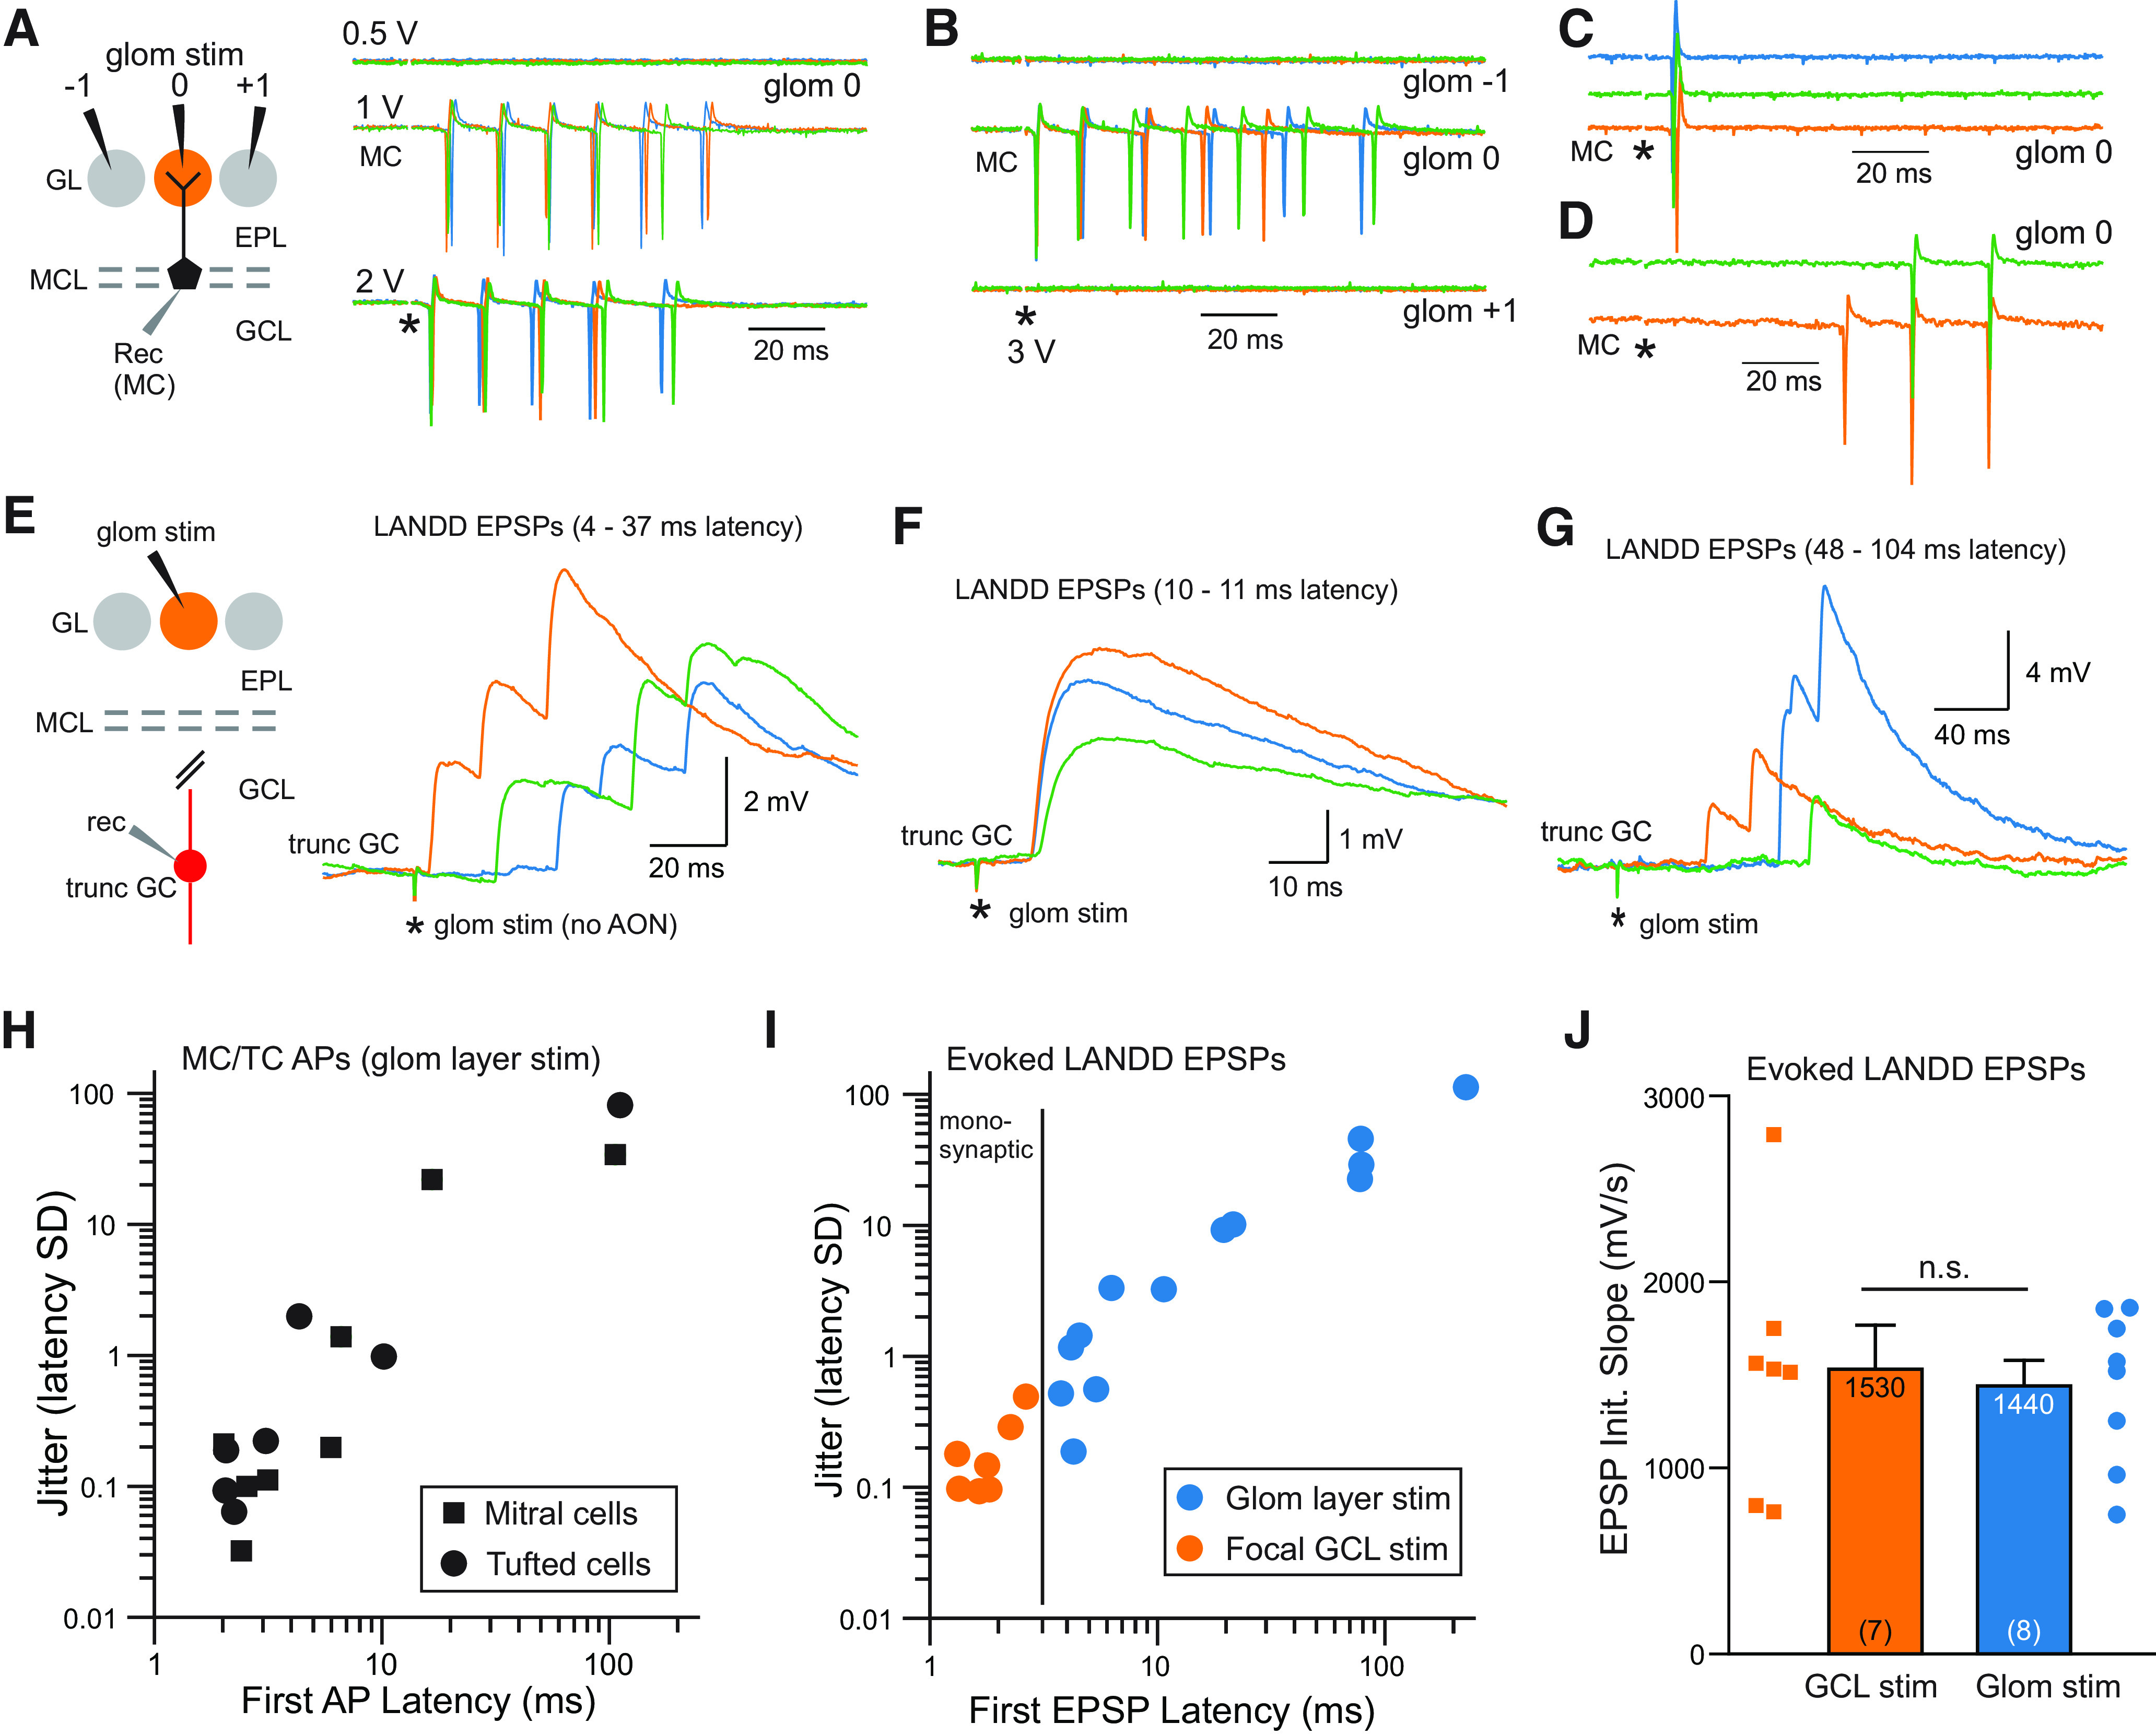
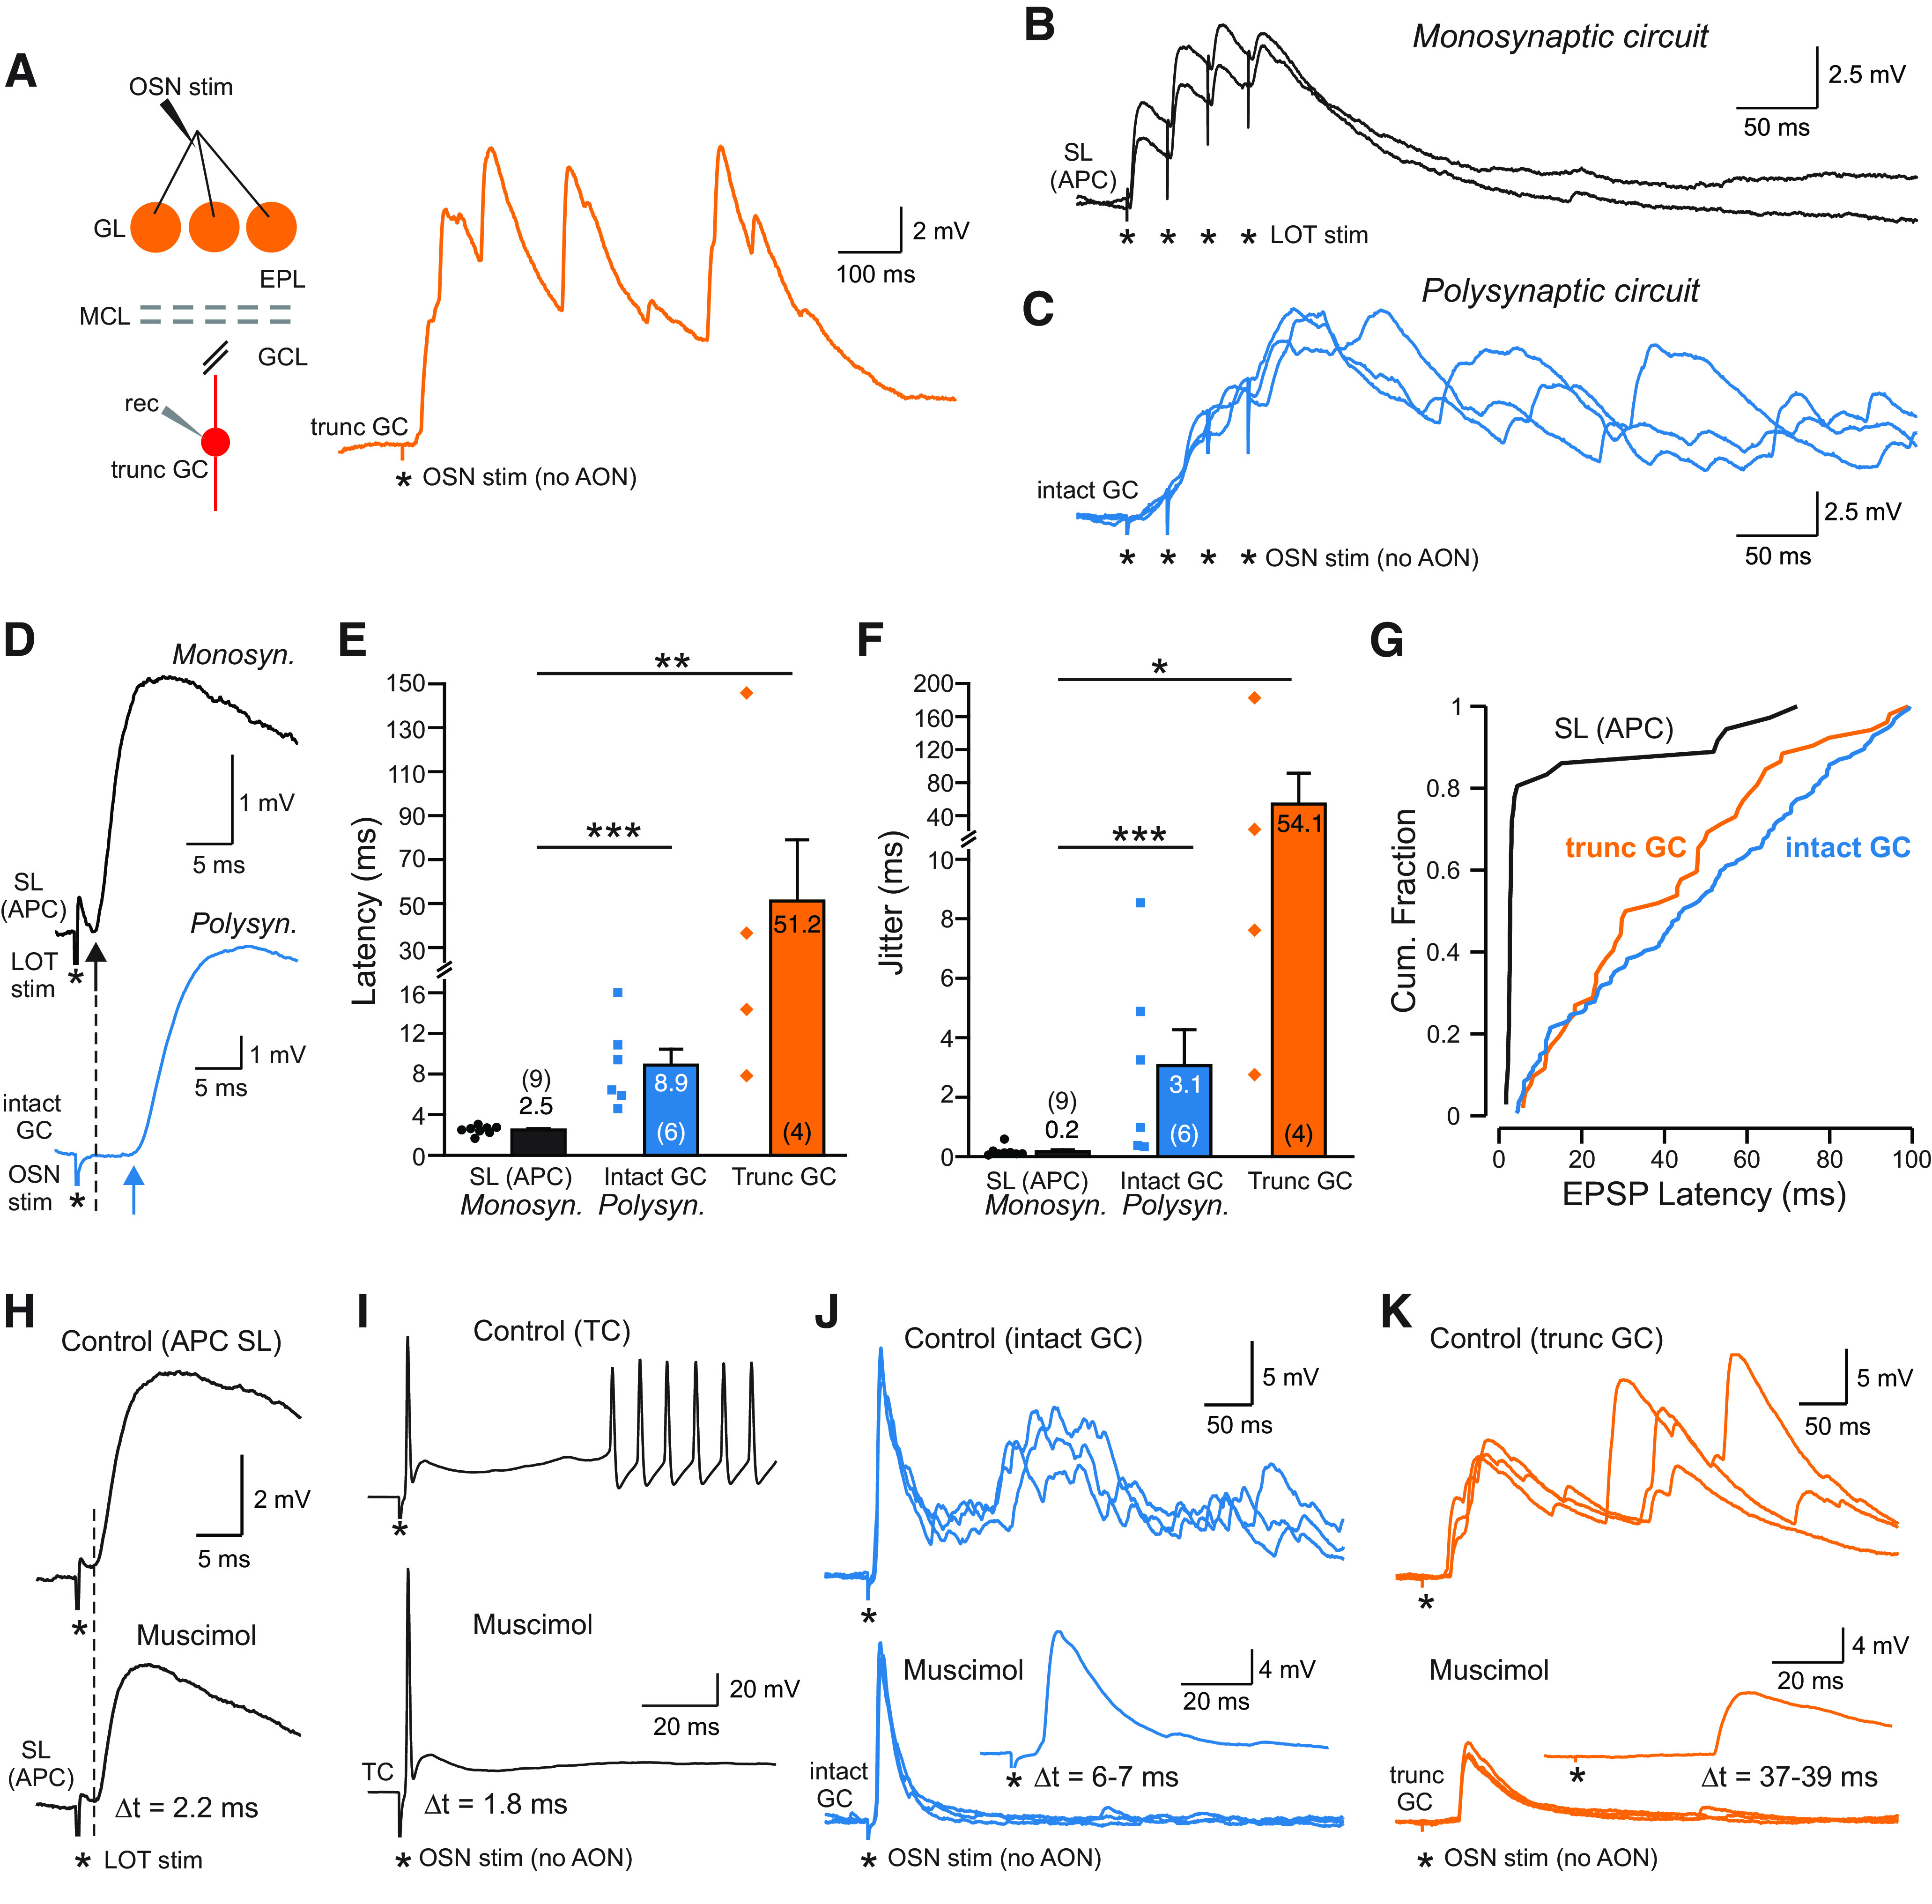
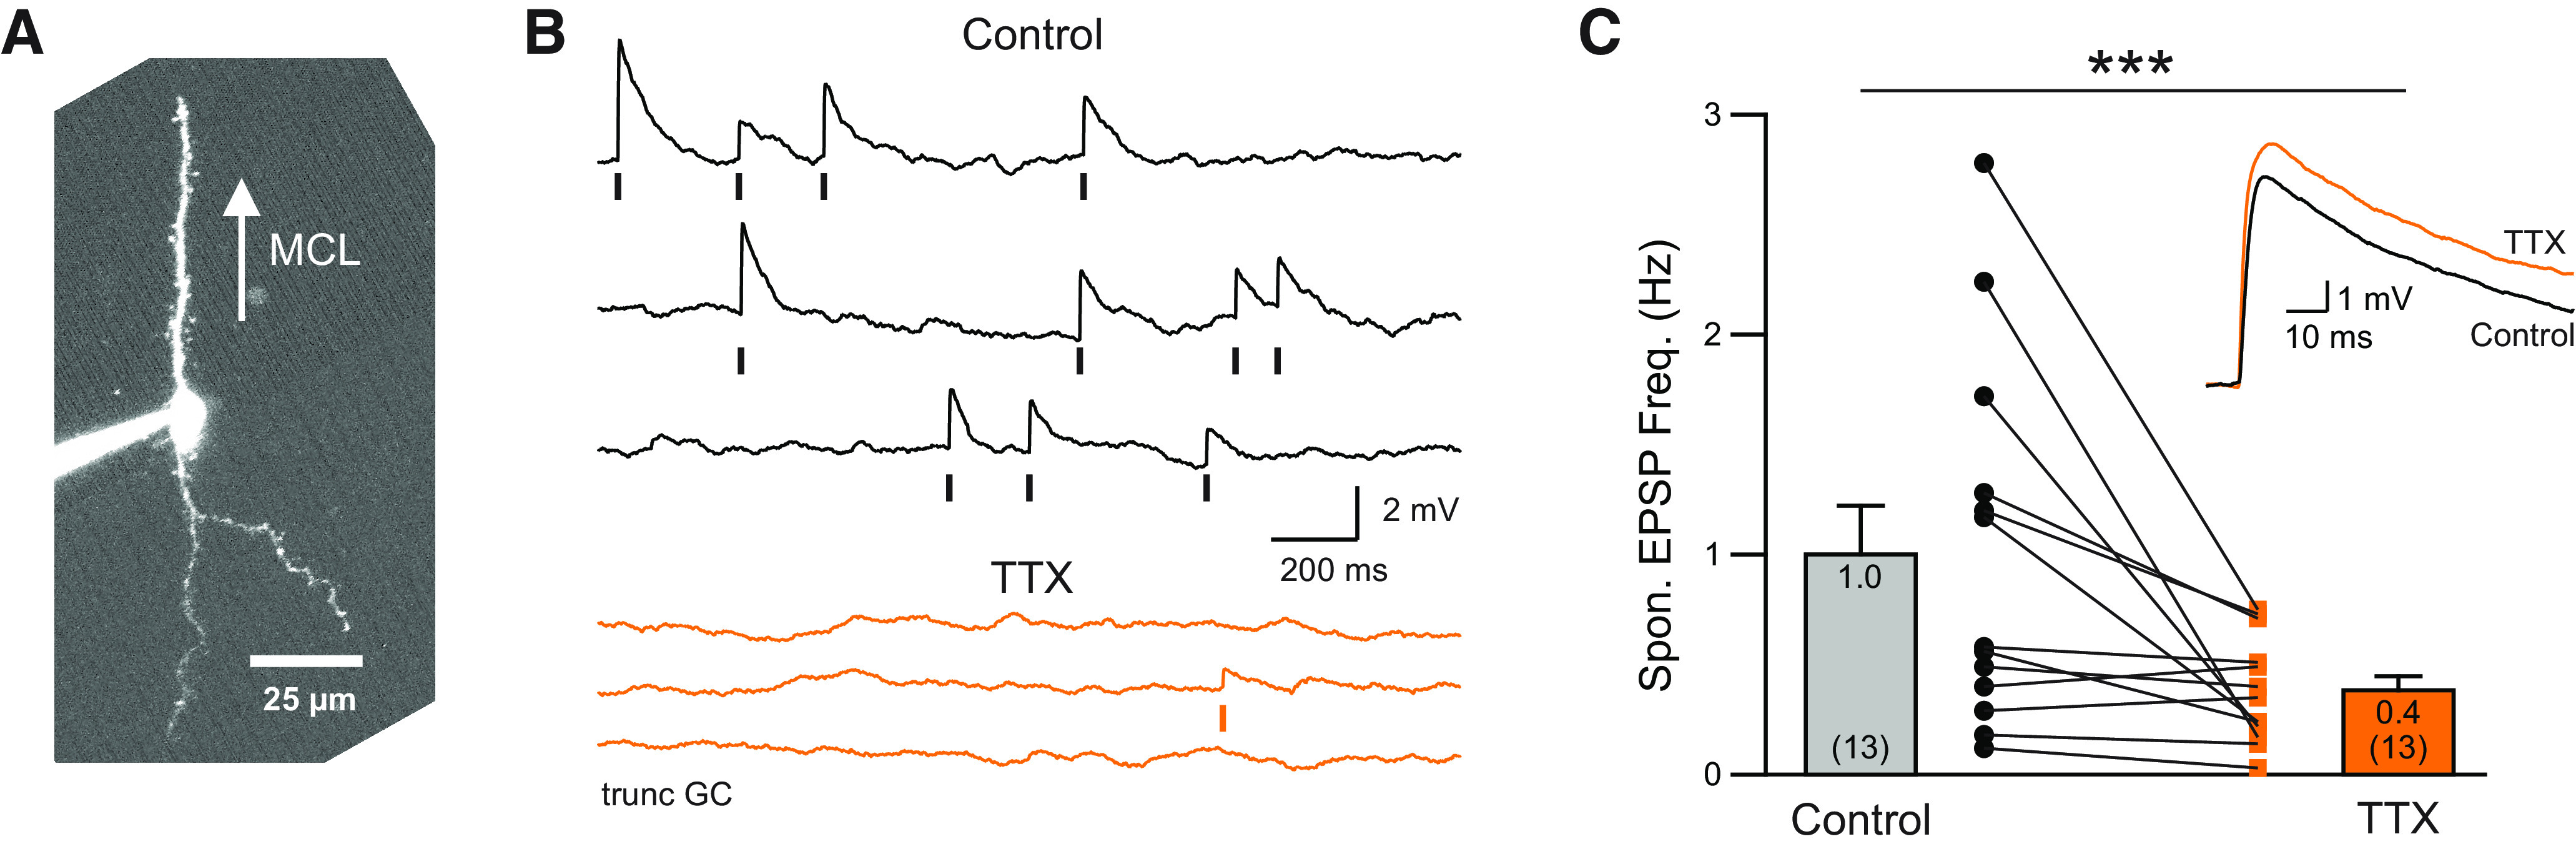
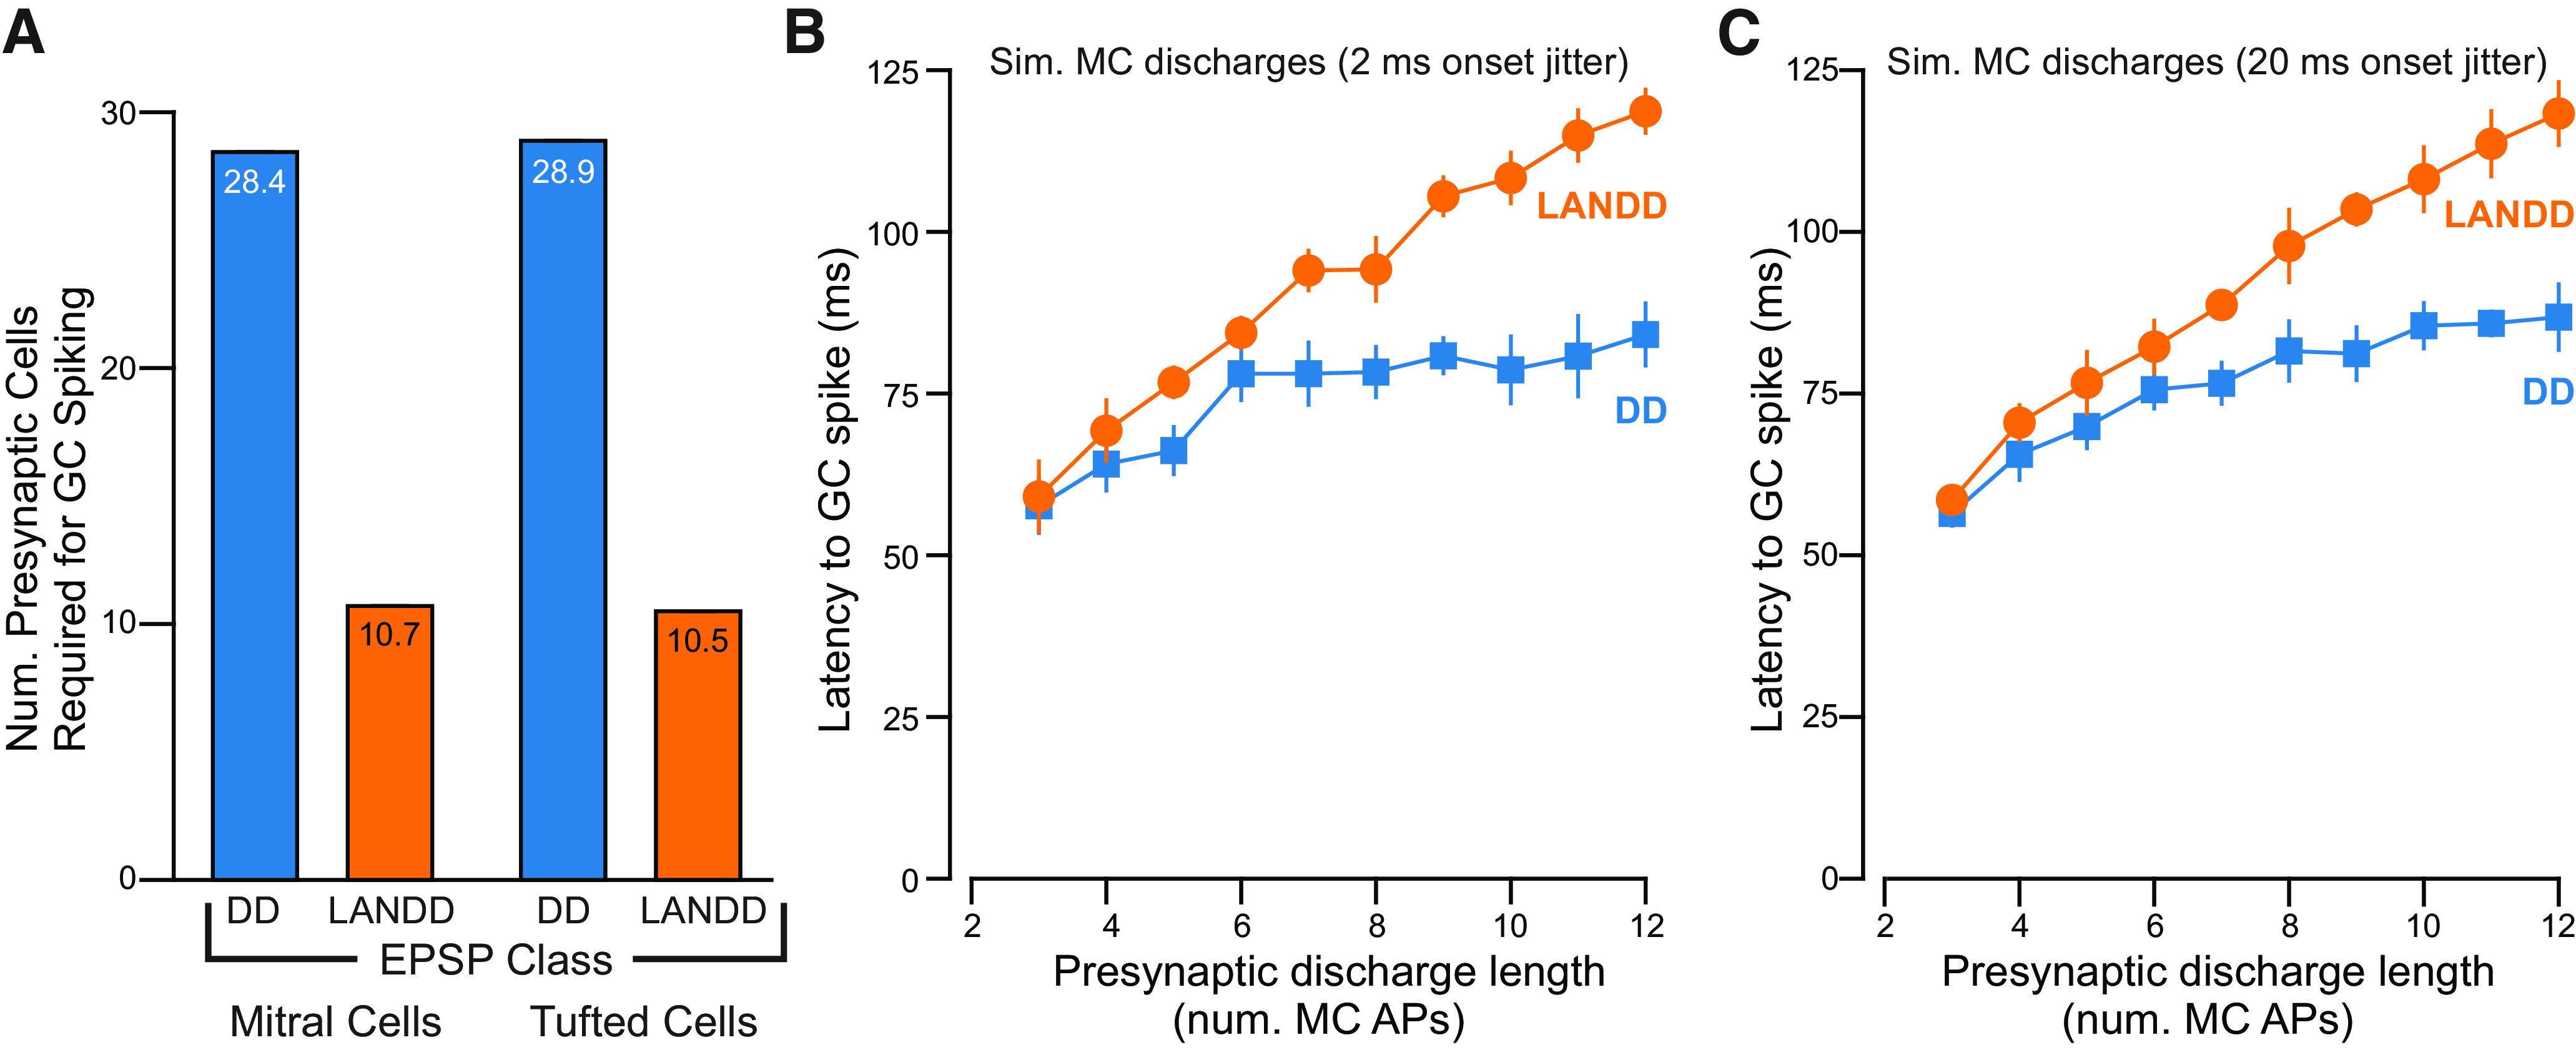
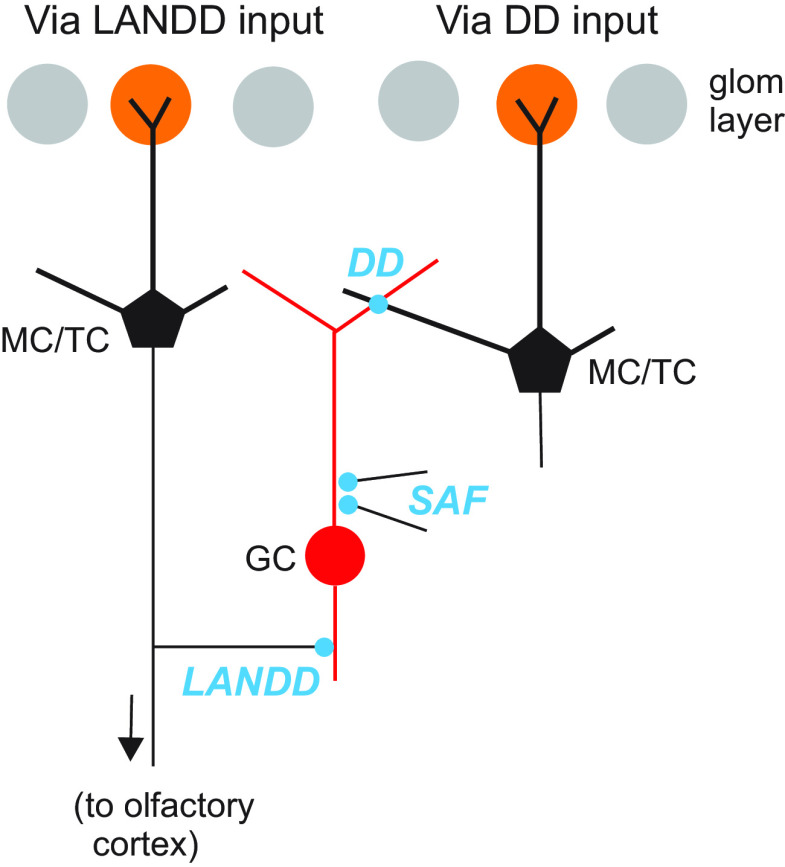
The olfactory bulb (OB) serves as a relay region for sensory information transduced by receptor neurons in the nose and ultimately routed to a variety of cortical areas. Despite the highly structured organization of the sensory inputs to the OB, even simple monomolecular odors activate large regions of the OB comprising many glomerular modules defined by afferents from different receptor neuron subtypes. OB principal cells receive their primary excitatory input from only one glomerular channel defined by inputs from one class of olfactory receptor neurons. By contrast, interneurons, such as GABAergic granule cells (GCs), integrate across multiple channels through dendodendritic inputs on their distal apical dendrites. Through their inhibitory synaptic actions, GCs appear to modulate principal cell firing to enhance olfactory discrimination, although how GCs contribute to olfactory function is not well understood. In this study, we identify a second synaptic pathway by which principal cells in the rat (both sexes) OB excite GCs by evoking potent nondepressing EPSPs (termed large-amplitude, nondendrodendritic [LANDD] EPSPs). LANDD EPSPs show little depression in response to tetanic stimulation and, therefore, can be distinguished other EPSPs that target GCs. LANDD EPSPs can be evoked by both focal stimulation near GC proximal dendrites and by activating sensory inputs in the glomerular layer in truncated GCs lacking dendrodendritic inputs. Using computational simulations, we show that LANDD EPSPs more reliably encode the duration of principal cell discharges than DD EPSPs, enabling GCs to compare contrasting versions of odor-driven activity patterns.SIGNIFICANCE STATEMENT The olfactory bulb plays a critical role in transforming broad sensory input patterns into odor-selective population responses. How this occurs is not well understood, but the local bulbar interneurons appear to be centrally involved in the process. Granule cells, the most common interneuron in the olfactory bulb, are known to broadly integrate sensory input through specialized synapses on their distal dendrites. Here we describe a second class of local excitatory inputs to granule cells that are more powerful than distal inputs and fail to depress with repeated stimulation. This second, proximal pathway allows bulbar interneurons to assay divergent versions of the same sensory input pattern.

Keywords: brain slice; interneurons; olfactory bulb; patch clamp; short-term plasticity.


Figures

Figure 1.
Figure 1.
Olfactory GCs receive large-amplitude spontaneous EPSPs. A, Diagram of experimental configuration for DD paired recording experiment with one intracellular recording in an MC and another in a postsynaptic GC. Thin red traces indicate repeated GC responses to evoked MC APs (bottom black trace). One trial failed to trigger a DD EPSP (labeled failure). Top thick red trace indicates average GC response. B, Example spontaneous EPSPs from the same postsynaptic GC shown in A with more rapid kinetics (all have >1000 mV/s rising phase slopes, 5%-50%) and larger amplitude than the average unitary-evoked DD EPSP shown at bottom. Other example spontaneous EPSPs recorded in the same GC (middle set of traces) resembled the evoked DD EPSP (bottom red trace). C, Plot of the cumulative distribution of spontaneous (black curve) and MC spike-evoked (red curve) EPSP rising phase slopes (5%-50%) in the 6 GCs with monosynaptic DD connections with MCs. Arrows indicate the largest evoked DD EPSP and the largest spontaneous EPSP recorded in the same set of neurons. D, Cumulative plots of EPSP amplitudes from the same two datasets shown in C.
Figure 2.
Figure 2.
Large-amplitude EPSPs evoked by focal microstimulation of proximal GC dendrites. A, Left, 2-photon maximal intensity z stacks demonstrating extensive dendritic arborization of a recorded intact GC within the EPL, the lamina where DD synapses are located. Image was obscured by debris on the surface of the slice located on the MCL/EPL boundary. Right, z stacks of a truncated GC with apical dendrite severed in the GCL. B, Responses to depolarizing and hyperpolarizing current steps in the truncated GC shown in A (right). C, Spontaneous non-DD EPSPs recorded in the truncated GC shown in A. These example spontaneous EPSPs all have >1000 mV/s initial slopes (5%-50%). D, Top, Focal microstimulation near the basal dendrite of the truncated GC shown in A-C evoked large-amplitude non-DD EPSPs with fast kinetics. Dashed line indicates the average initial rising phase slope of EPSPs (5%-50%; all > 1000 mV/s). Asterisks indicate stimulus timing (and in subsequent figures). Bottom, Histogram of EPSP initial slopes from 9 truncated GC recordings with focal dendritic stimulation. Typical recording configuration shown in inset. E, DD EPSPs evoked in monosynaptic MC/GC recordings (top). Dashed line indicates the average EPSP slope. Bottom, Histogram of MC AP-evoked DD EPSP initial slopes paired MC/GC recordings. Diagram of MC/GC paired recording configuration shown in inset.
Figure 3.
Figure 3.
Two types of excitatory responses onto proximal GC dendrites. A, 2-photon z-stack montage showing intact GC recorded in experiments in B–E. Same GC following placement of a dye-filled focal stimulating electrode near either the proximal apical dendrite (B) or a basal dendrite (C). D, Evoked monosynaptic EPSPs following trains of stimuli applied to the proximal apical dendritic stimulating electrode (trains of 3 shocks at 20 Hz). Individual responses superimposed at bottom; average response shown above (green trace). E, Responses in the GC to focal stimulation of a basal dendrite in the same GC. Individual responses superimposed at bottom; average response shown above (orange trace). Trains of two shocks at 20 Hz. These example spontaneous EPSPs all have > 1000 mV/s rising phase slopes (5%-50%). F, Summary plot of responses to GCL stimulation in visualized GCs. Filled green symbols represent SAF EPSPs. Filled orange symbols represent LANDD EPSPs. Diamond symbols represent 2-photon-guided microstimulation near visualized dendritic segments. Circles represent stimuli within the GCL but without visualization of the stimulation electrode in both groups. (Nonvisualized stimulation was only tested in truncated GCs to exclude activation of DD inputs.) Clusters were statistically different based on the Hopkins statistic > 0.75. Mean ± SEM for PPR estimates indicated inside the y axis and unitary amplitude inside the x axis. G, Plot of EPSP initial slope (5%-50% of rising phase) for three different classes of GC EPSPs. For LANDD versus SAF EPSPs, ***p < 1.2 × 10⁻⁴, T = 5.03. For LANDD versus DD EPSPs, ***p < 1.3 × 10⁻⁴, T = 4.75; both unpaired t tests. H, Plot of onset latency for the same three EPSP classes. **p < 0.01, T = 2.65 (unpaired t test). n.s.; p > 0.05.
Figure 4.
Figure 4.
Contrasting forms of short-term plasticity in SAF and LANDD EPSPs. A, Comparison of short-term plasticity in responses to trains of 40 Hz stimuli applied near the proximal apical (top green trace) or basal (bottom orange trace) of the same intact GC. B, Summary plot of short-term plasticity assayed using trains of 40 Hz stimuli that triggered SAF EPSPs (green symbols; N = 6 experiments), DD (blue; N = 6), or LANDD (orange; N = 8) symbols. C, Plot of EPSP summation following the final stimulus in the 4 × 40 Hz stimulation trains illustrated in A. ***p < 1.03 × 10⁻⁴, T = 5.67; **p < 3.3 × 10⁻⁴, T = 4.86, both unpaired t tests. D, Example recordings in which trains of LANDD EPSPs triggered APs with low jitter (0.32 ms; latency SD). E, Blockade of AMPARs with 10 μm DNQX abolishes LANDD EPSPs recorded at −70 mV evoked by focal stimuli applied near the basal dendrite.
Figure 5.
Figure 5.
Sensory input evokes LANDD EPSPs. A, Left, Diagram of recording configuration with cell-attached MC recording and focal microstimulation of three nearby glomeruli. Subsequent whole-cell recording and 2-photon imaging was used to determine the “on-beam” glomerulus for that MC. Right, Example MC responses to on-beam (“glom 0”) stimulation recorded at three intensities. B, Only the stimulation of the on-beam glomerulus triggered MC discharges. Same recording as in A; stimulus intensity 3 times threshold level determined in A in glom0 and two adjacent glomeruli (glom-1 and glom1). C, Example single short-latency (7.7-9.0 ms) AP response to glomerular stimulation in a different MC. D, Example long-latency (53-71 ms) discharge following glomerular layer stimulation in a different MC. E, Long-latency LANDD EPSPs evoked by glomerular stimulation in a truncated GC. Diagram of recording configuration shown on left. Experiment in an OB slice with the AON removed. F, Examples of short-latency single LANDD EPSPs evoked by glomerular stimulation in a different truncated GC. G, Long-latency clusters of LANDD EPSPs evoked by glomerular stimulation in a different truncated GC. H, Plot of onset latency versus onset latency jitter in cell-attached recordings from MCs (filled square symbols) and TCs (filled circles) following on-beam glomerular stimulation. I, Analogous plot of latency versus jitter in EPSP responses to glomerular layer (blue symbols) or GCL (orange symbols) stimulation in truncated GCs. All GCL stimuli experiments generated presumptive monosynaptic EPSPs with onset latencies <3 ms. J, Plot of initial slopes of LANDD EPSPs evoked by GCL (orange) or glomerular layer (blue) stimulation. Mean initial slope values are not statistically different (n.s.; p > 0.05).
Figure 6.
Figure 6.
Sensory input stimulation excites GCs through a polysynaptic circuit. A, A single OSN shock evokes an EPSP barrage recorded in a truncated GC from an OB slice without the AON. Latency to initial EPSP was 20.8 ms. Schematic of experimental configuration shown on left. B, Responses to 40 Hz tetanic stimulation of the LOT in APC SLs (EPSP latency = 2.4 ms). C, Analogous 40 Hz OSN stimulation evokes long-lasting EPSP barrages in OB GCs. D, LOT stimulation triggered monosynaptic EPSP onto an APC SL (top, 2.3 ms latency), while OSN stimulation triggered a polysynaptic EPSP onto an intact OB GC (bottom, 5.8 ms latency). Dashed line indicates onset of SL EPSP. Blue arrow indicates onset of GC EPSP. E, Summary plot of initial EPSP latency in SL, intact, and truncated GCs. **p < 0.02, T = 2.41; ***p < 0.001, T = 4.638 (y axis broken to illustrate range of data points). F, Summary plot of EPSP latency jitter in the same three cell types. *p < 0.05, T = 2.0; ***p < 0.01, T = 2.74 (also with y axis broken). G, Plot of the cumulative distribution of EPSP latencies found in the first 100 ms of time following stimulation, triggered by LOT stimulation in SLs (black curve) and OSN stimulation in intact GCs (blue curve) and OSN stimulation in truncated GCs (orange curve). The plots of intact GC and truncated GC EPSPs are significantly different from the plot of EPSPs onto SLs (N = 9) versus intact GC (N = 6): p < 1.9 × 10⁻¹⁷; SL (N = 9) versus truncated GC (N = 4): p < 3.7 × 10⁻¹³; both Kolmogorov–Smirnov tests. H, Activation of GABAA receptors with muscimol does not affect the latency to the initial EPSP in an SL cell. I, Muscimol abolishes late spikes in OSN-evoked TC response while preserving the initial, short-latency (1.8 ms) spike. J, Muscimol abolishes late EPSPs evoked by OSN stimulation in an intact GC while preserving the initial EPSP (enlarged in inset). K, Muscimol also abolishes late EPSPs evoked by OSN stimulation in a truncated GC. Inset, Initial muscimol-resistant EPSP.
Figure 7.
Figure 7.
Spontaneous LANDD EPSPs require Na+ spiking. A, Image of filled truncated GC. B, Spontaneous EPSPs before (top, black traces) and after (bottom, orange traces) bath application of 1 μm TTX. Recordings from the truncated GCs shown in A. C, Summary plot of the effect of TTX on spontaneous EPSP rates in 13 truncated GCs. ***p < 0.01, T = 2.86 (paired t test). Inset, Examples of spontaneous LANDD EPSPs before (black) and after (orange) TTX recorded in the same truncated GC.
Figure 8.
Figure 8.
Differential sensitivity to MC discharge duration in DD and LANDD pathways. A, Summary plot of the number of presynaptic MCs (or TCs assayed in separate simulations) required to bring a GC to firing threshold in 95% of model runs. Error bars indicate mean ± SD. B, Plot of the length of the presynaptic MC discharge versus latency to the initial GC spike in simulations using DD-like (blue symbols) or LANDD-like (orange) short-term plasticity. Simulations used the same (DD-like) EPSP properties (e.g., amplitude, probability, response template). Results using simulated MC discharges based on mean interspike interval in recorded glomerular-evoked MC discharges (21.3 ms) and the measured coefficient of variation of the interspike interval (1.83). The number of active (discharging) presynaptic MCs required to trigger at least one GC AP in the DD-like STP simulations varied from 30 (3 spike discharges) to 22 (12 spike discharges). With LANDD-like STP, the number of active presynaptic MCs required to bring the GC to the AP threshold varied from 25 (3 spike discharges) to 12 (12 spike discharges). C, Similar results were obtained when increasing the onset latency jitter from 2 to 20 ms.
Figure 9.
Figure 9.
Diagram of hypothesized routes of GC excitation leading to DD and LANDD EPSPs. Diagram of proposed local circuits responsible for MC/TC-to-GC excitation via the DD pathway (targeting the distal apical dendrite) and through the LANDD pathway (targeting the basal dendrite). GCs are also excited by SAF EPSPs, shown terminating on the proximal apical dendrite in the diagram. SAF EPSPs originate from both intrinsic bulbar circuits and long-range feedback projections from piriform cortex. Blue text represents synaptic pathways.

Similar articles

Cited by

References

    1. Abraham NM, Spors H, Carleton A, Margrie TW, Kuner T, Schaefer AT (2004) Maintaining accuracy at the expense of speed: stimulus similarity defines odor discrimination time in mice. Neuron 44:865–876. 10.1016/j.neuron.2004.11.017 - DOI - PubMed
    1. Abraham NM, Egger V, Shimshek DR, Renden R, Fukunaga I, Sprengel R, Seeburg PH, Klugmann M, Margrie TW, Schaefer AT, Kuner T (2010) Synaptic inhibition in the olfactory bulb accelerates odor discrimination in mice. Neuron 65:399–411. 10.1016/j.neuron.2010.01.009 - DOI - PMC - PubMed
    1. Apicella A, Yuan Q, Scanziani M, Isaacson JS (2010) Pyramidal cells in piriform cortex receive convergent input from distinct olfactory bulb glomeruli. J Neurosci 30:14255–14260. 10.1523/JNEUROSCI.2747-10.2010 - DOI - PMC - PubMed
    1. Balu R, Pressler RT, Strowbridge BW (2007) Multiple modes of synaptic excitation of olfactory bulb granule cells. J Neurosci 27:5621–5632. 10.1523/JNEUROSCI.4630-06.2007 - DOI - PMC - PubMed
    1. Banerjee A, Dave RN (2004) Validating clusters using the Hopkins statistic. In: IEEE International Conference on Fuzzy Systems, pp 149–153, Vol 1, Budapest, Hungary.

Publication types

LinkOut - more resources