. 2021 Jan 20;41(3):524-537.
doi: 10.1523/JNEUROSCI.2132-20.2020. Epub 2020 Nov 24.

Impaired θ-γ Coupling Indicates Inhibitory Dysfunction and Seizure Risk in a Dravet Syndrome Mouse Model

Affiliations

Impaired θ-γ Coupling Indicates Inhibitory Dysfunction and Seizure Risk in a Dravet Syndrome Mouse Model

Nico A Jansen et al. J Neurosci. .

Abstract

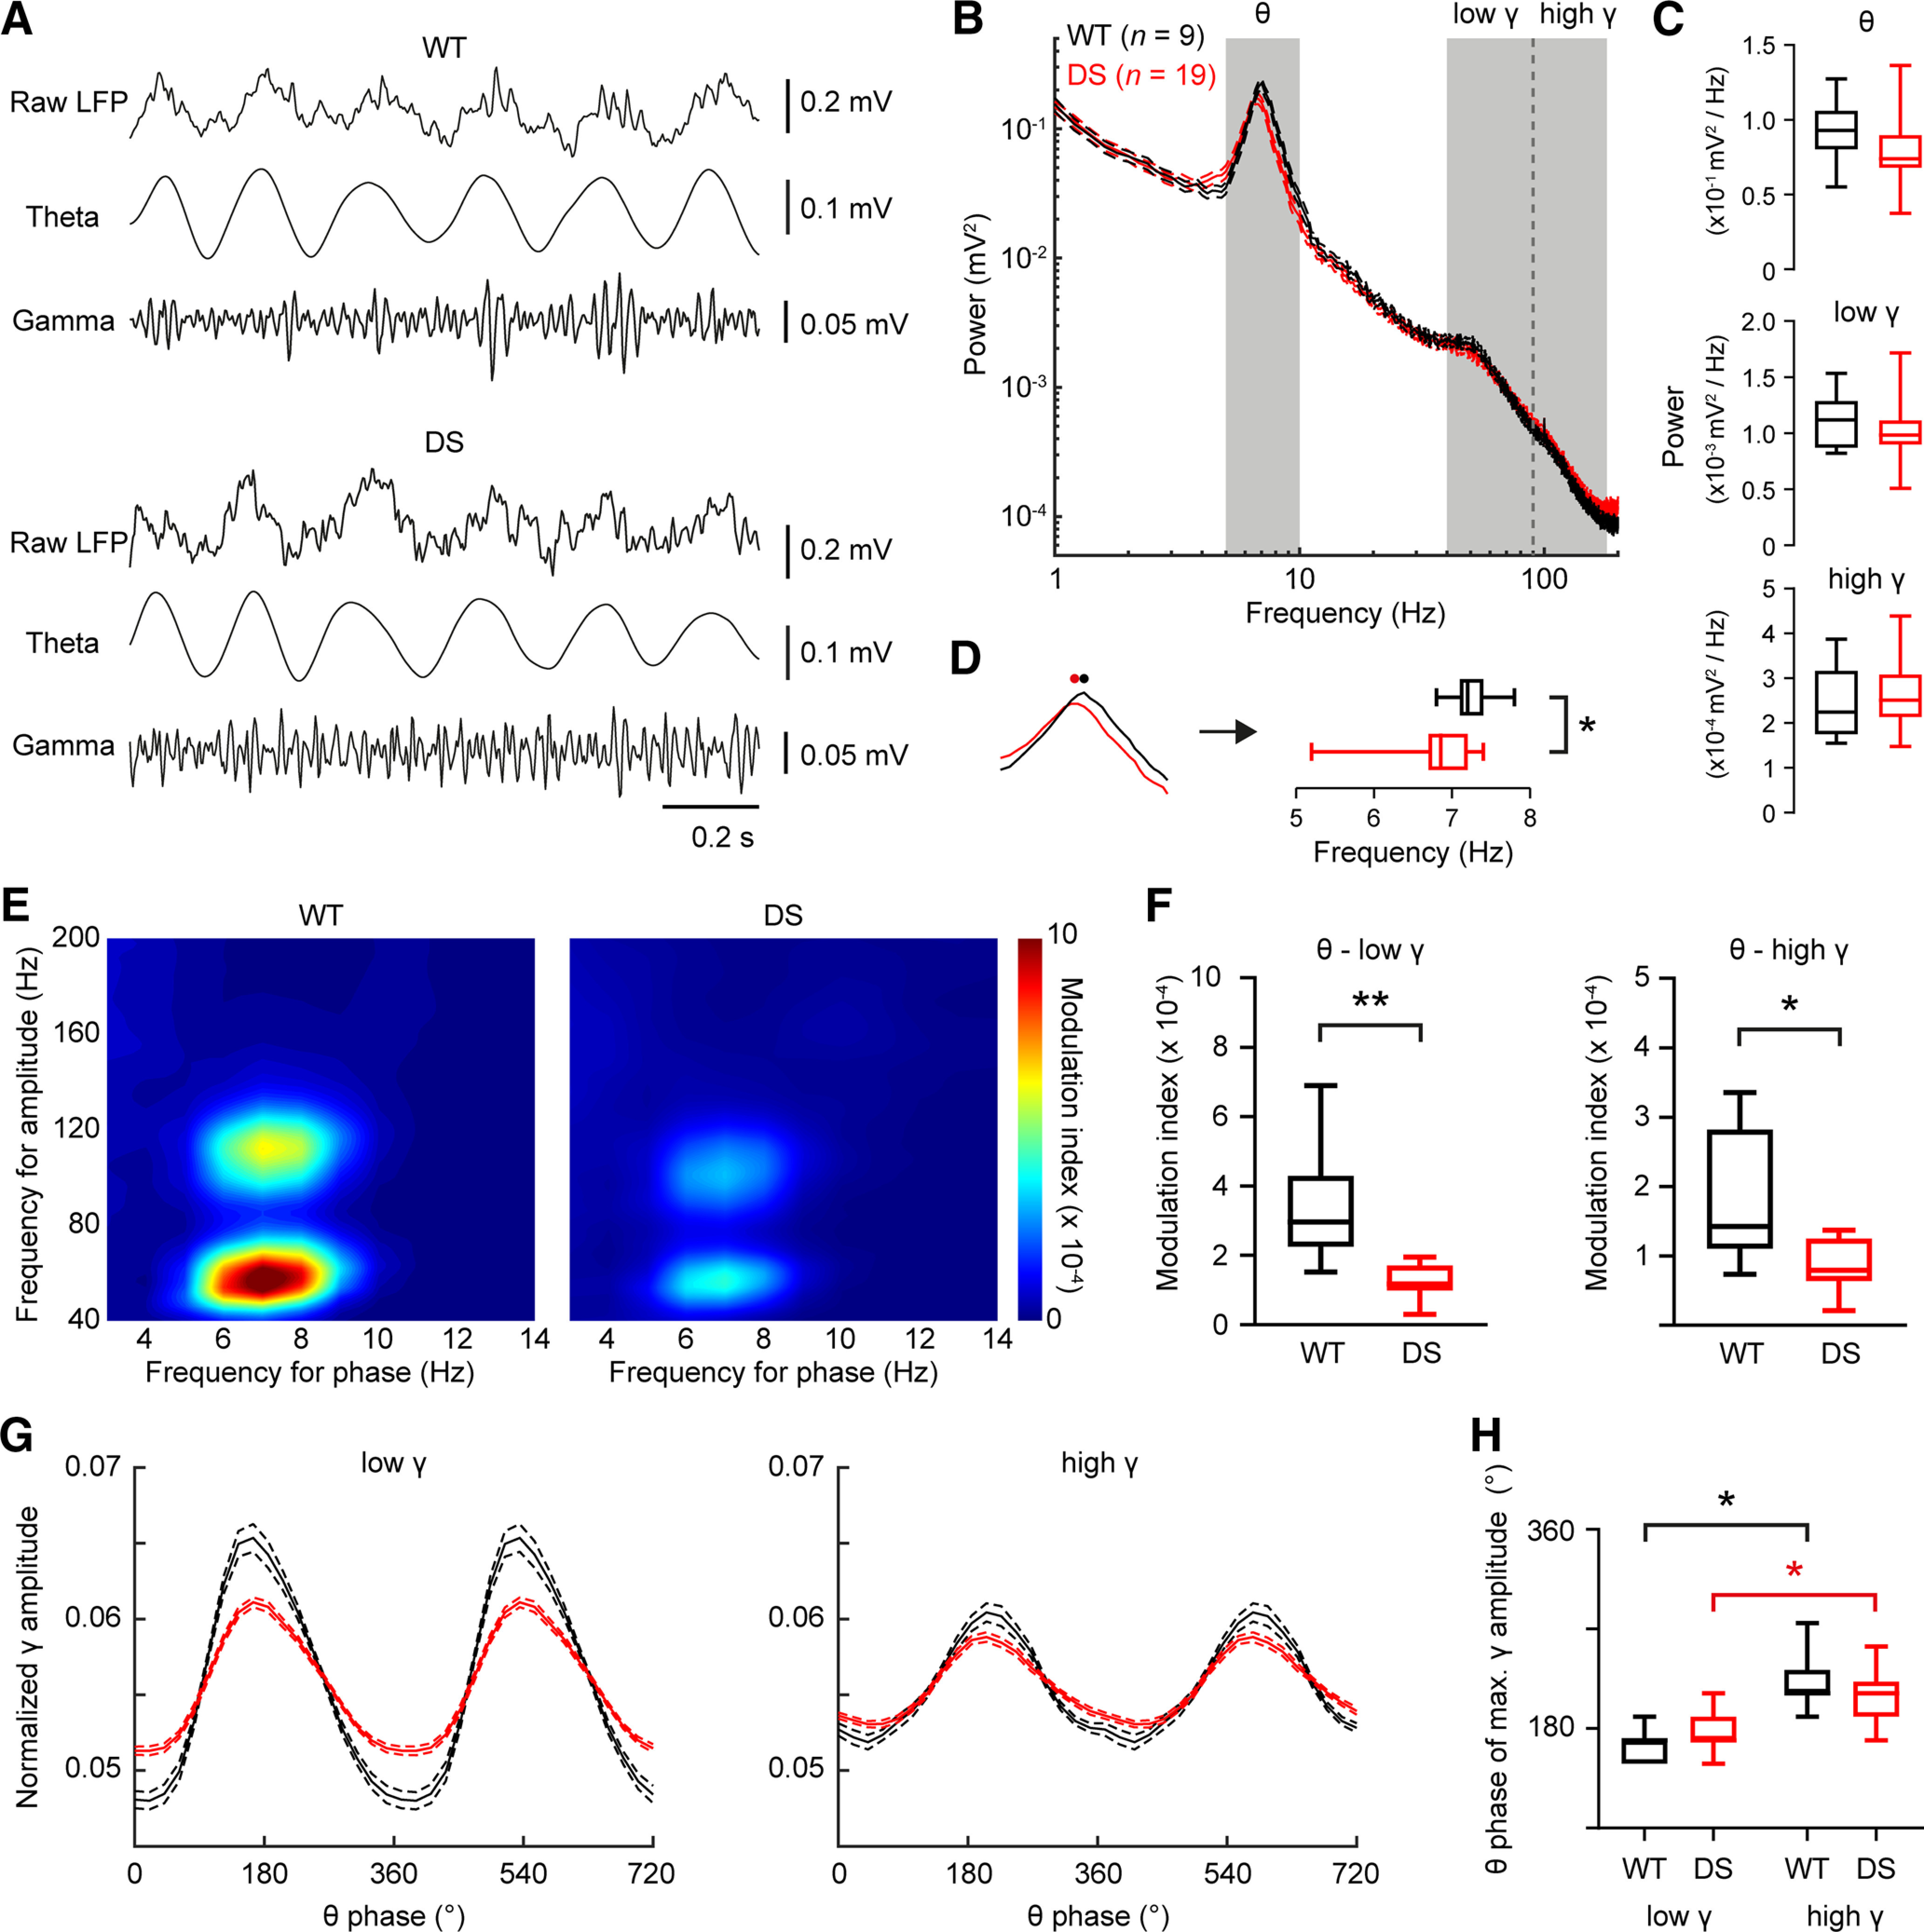
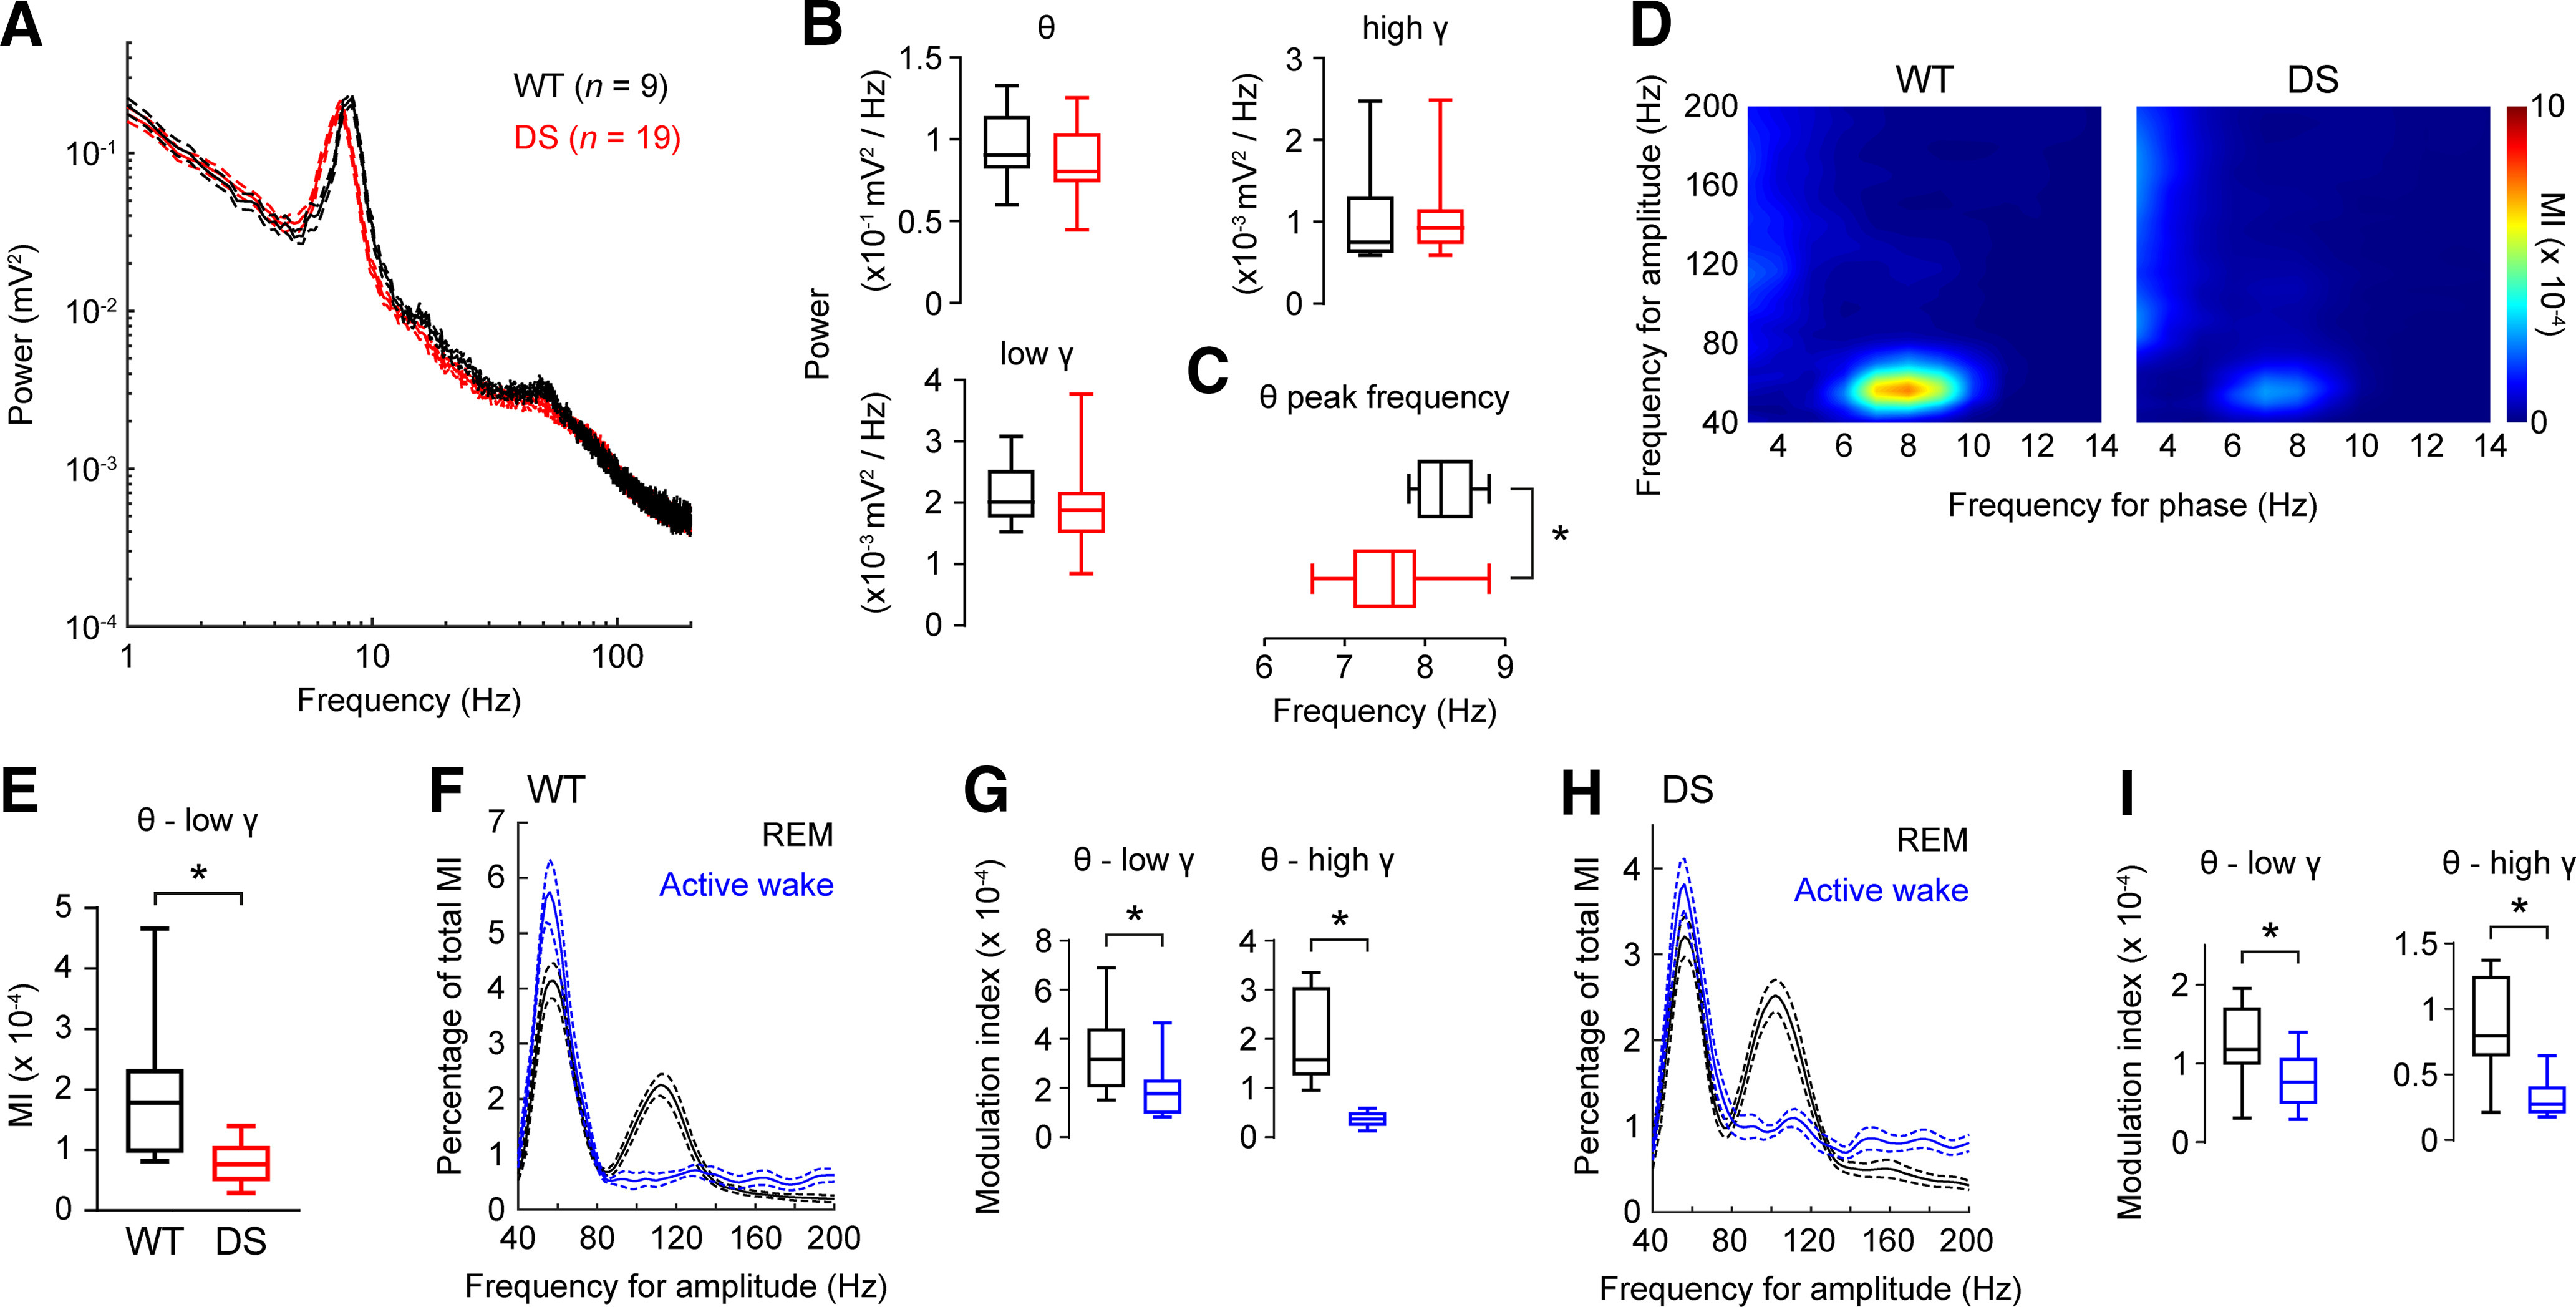
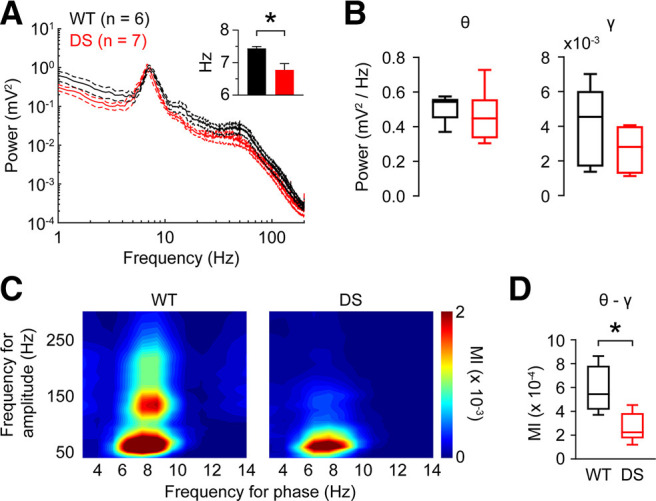
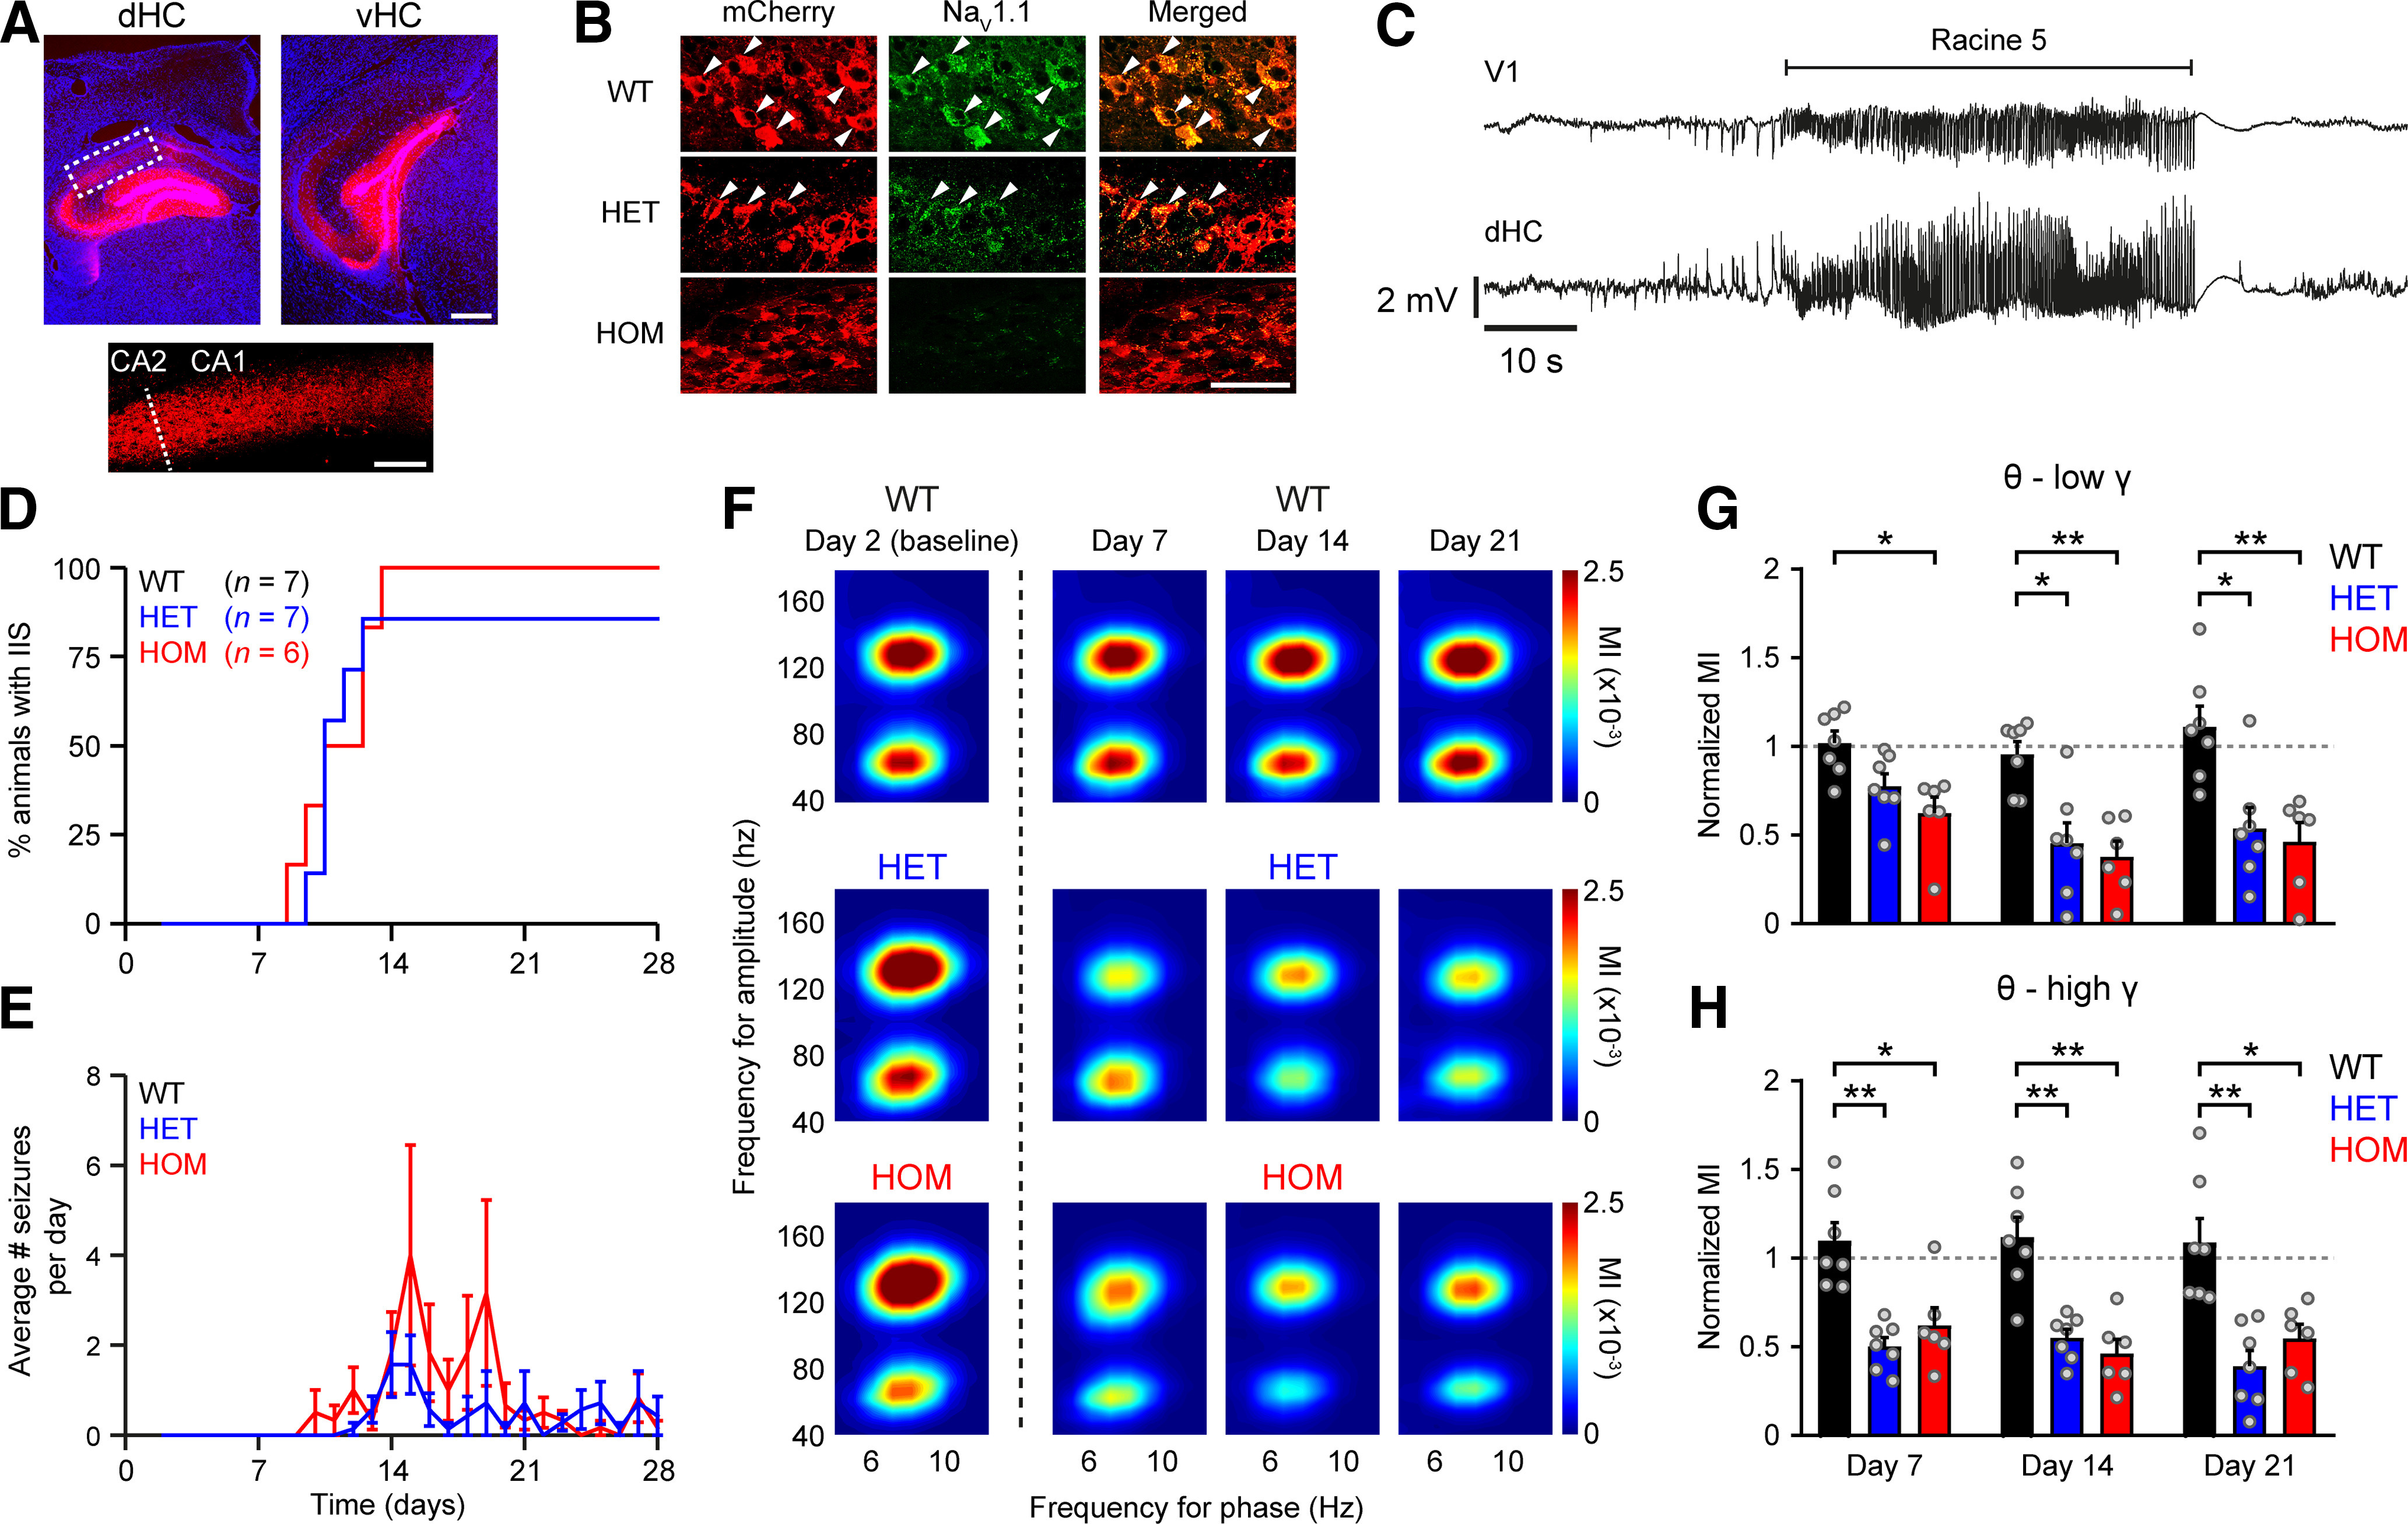
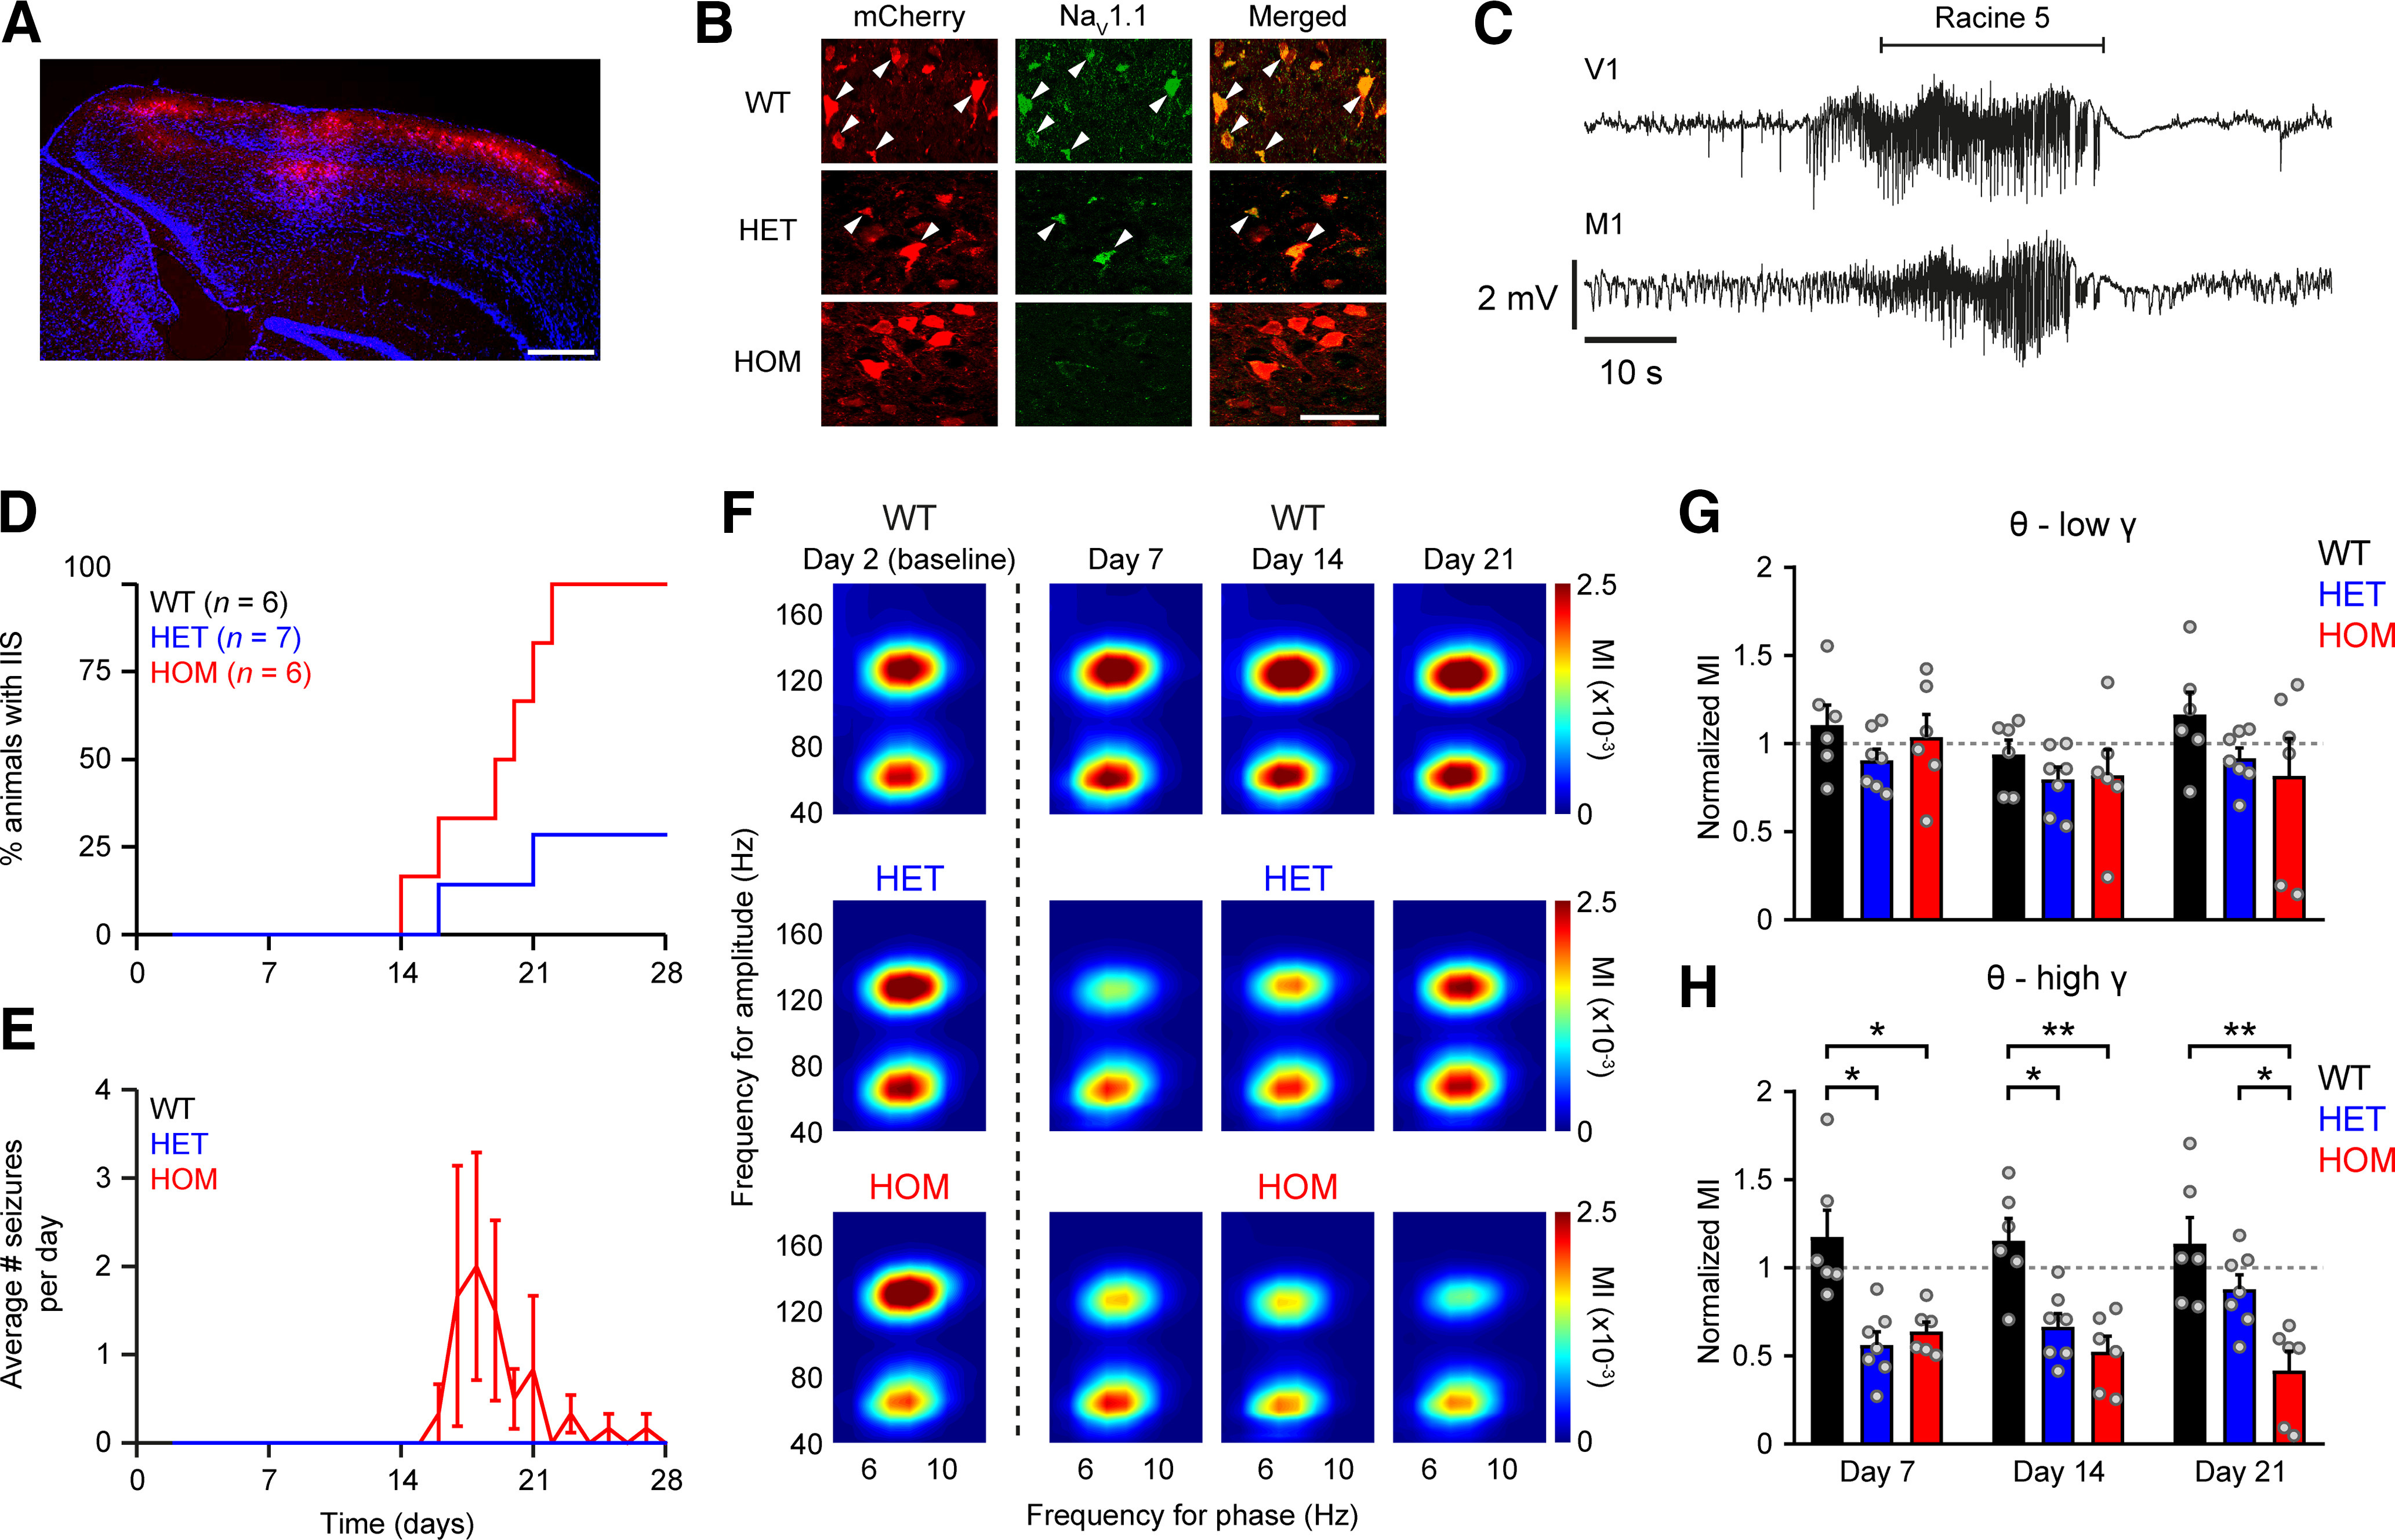
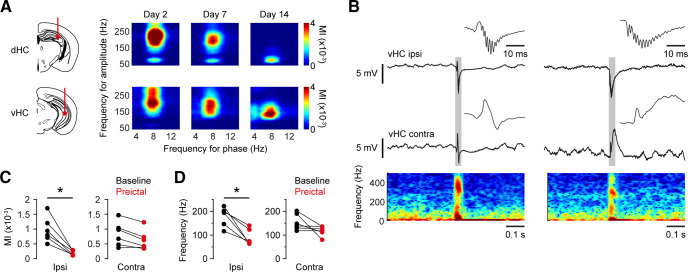
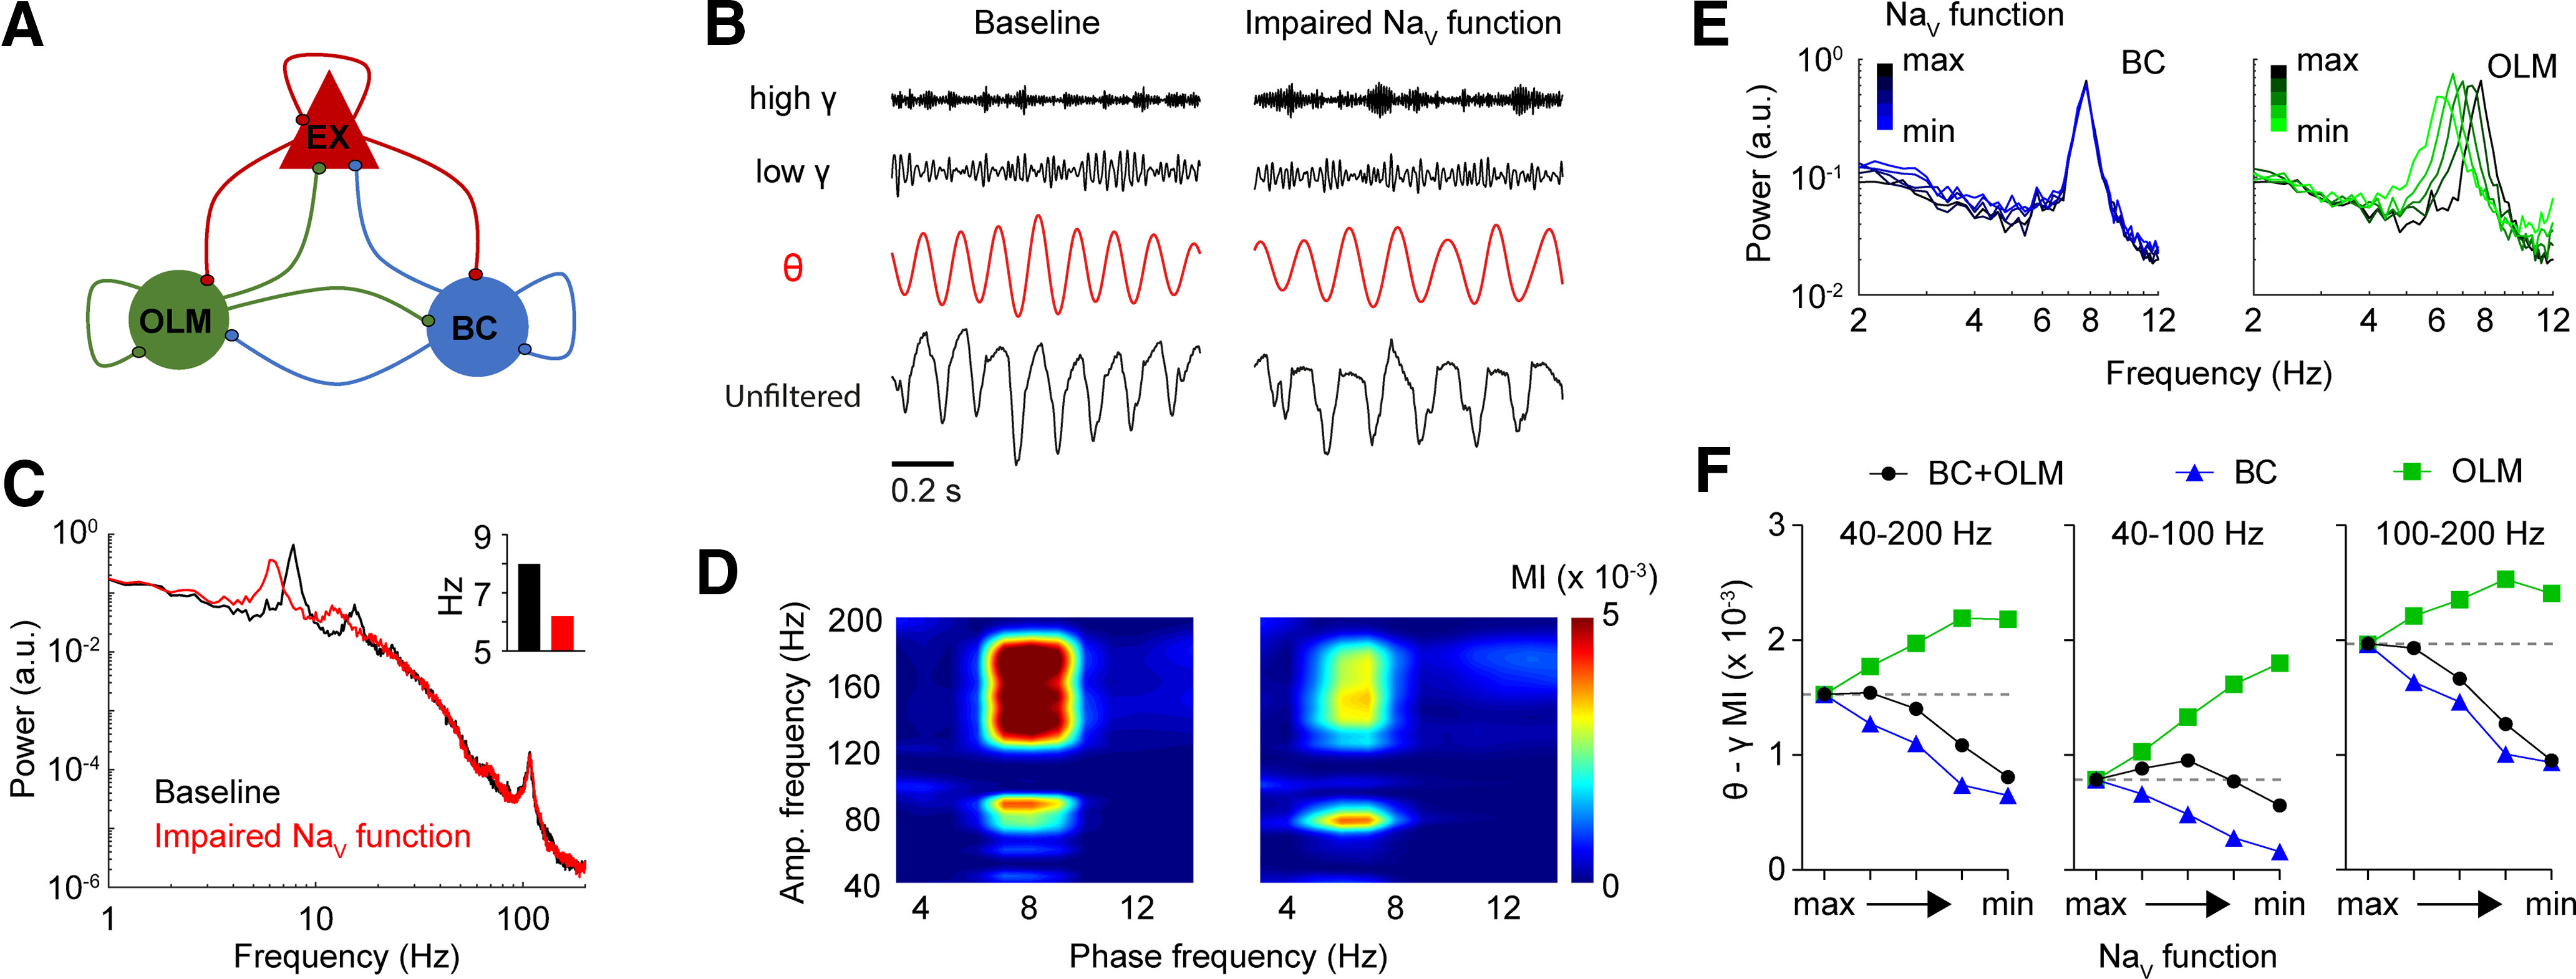
Dravet syndrome (DS) is an epileptic encephalopathy that still lacks biomarkers for epileptogenesis and its treatment. Dysfunction of NaV1.1 sodium channels, which are chiefly expressed in inhibitory interneurons, explains the epileptic phenotype. Understanding the network effects of these cellular deficits may help predict epileptogenesis. Here, we studied θ-γ coupling as a potential marker for altered inhibitory functioning and epileptogenesis in a DS mouse model. We found that cortical θ-γ coupling was reduced in both male and female juvenile DS mice and persisted only if spontaneous seizures occurred. θ-γ Coupling was partly restored by cannabidiol (CBD). Locally disrupting NaV1.1 expression in the hippocampus or cortex yielded early attenuation of θ-γ coupling, which in the hippocampus associated with fast ripples, and which was replicated in a computational model when voltage-gated sodium currents were impaired in basket cells (BCs). Our results indicate attenuated θ-γ coupling as a promising early indicator of inhibitory dysfunction and seizure risk in DS.

Keywords: Dravet syndrome; Nav1.1; epilepsy; interneurons; sodium channels.


Figures

Figure 1.
Figure 1.
DS mice display decreased cortical θ-γ cross-frequency coupling at P23. A, Example traces of raw, θ-filtered (5–10 Hz) and γ-filtered (40–160 Hz) LFP in the V1 during REM sleep in a WT and DS mouse. B, Average V1 LFP power spectra during REM sleep in WT (black) and DS (red) mice. C, No significant differences in power were present between genotypes within θ, low (40–90 Hz) or high γ (90–160 Hz) frequency ranges. Peak θ frequency was significantly reduced in DS mice (D; detail of mean power in θ range, black and red dots indicate average peak θ frequency; t(27) = 2.5, *p =0.020, Welch's t test). E, Average phase-amplitude comodulograms of V1 during REM sleep in WT (n =9) and DS (n =19) mice at P23. F, θ-γ Coupling was significantly reduced in DS mice, for both low and high γ frequencies (t(8.9) = 3.8 and t(9.2) = 2.9, respectively, *p =0.019 and **p =0.004, Welch's t test). G, Normalized γ amplitude per 20° phase bin of the θ cycle for V1 during REM sleep. No significant differences were present between WT and DS mice. H, High γ amplitude peaked significantly later in the θ cycle than low γ in both genotypes (*p <0.005, Wilcoxon test).
Figure 2.
Figure 2.
Deficient cortical θ-γ coupling during active wakefulness in DS mice. A, Average V1 LFP power spectra during wakefulness in WT (black) and DS (red) mice. No significant differences were present between genotypes in power within θ (5–10 Hz), low γ (40–90 Hz), or high γ (90–160 Hz) frequency ranges (B). C, Peak θ frequency was significantly reduced in DS mice (t(22.7) = 3.5, *p =0.002, Welch's t test). D, Average phase-amplitude comodulograms of V1 LFP during active wakefulness in WT (n =9) and DS (n =19) mice at P23. E, θ-Low γ coupling was significantly reduced in DS mice (t(7.9) = 2.7, *p =0.030, Welch's t test). For both WT (F, G) and DS (H, I) mice, θ modulation of γ amplitude was largely limited to low γ frequencies during active wakefulness, while modulation of both low and high γ frequencies was lower when compared with REM sleep.
Figure 3.
Figure 3.
Deficient θ-γ coupling in the hippocampus of DS mice. A, Power spectral density of LFP recorded in the dorsal hippocampus during REM sleep in WT (black) and DS (red) mice. Peak θ frequency was significantly reduced in DS mice (inset; t(6.9) = 3.2, *p =0.011, Welch's t test). No significant differences were present between genotypes in power within θ (5–10 Hz) and γ (40–300 Hz) frequency ranges (B). C, Average phase-amplitude comodulograms of the same LFP signals. D, θ-γ Coupling was significantly reduced in DS mice (t(8.1) = 3.64, *p =0.006, Welch's t test).
Figure 4.
Figure 4.
Persistently reduced cortical θ-γ coupling in DS mice that show spontaneous seizures. A, Average phase-amplitude comodulograms of V1 showing progression of cortical θ-γ coupling during postnatal weeks 4–7. B, Average MI, calculated for θ (5–10 Hz) and total γ (40–160 Hz), was markedly increased in both WT and DS mice at P42, when compared with P23 (t(8) = 7.0 and t(15) = 6.4, respectively, *p <0.0001, paired t test). C, Total frequency of spontaneous seizures in DS mice (n =19). A subset of DS mice (n =3) died during the recording period, between P24–P26. D, Progression of cortical θ-γ cross-frequency coupling for WT (black) and DS mice with (gray) and without (red) spontaneous seizures over the recording period. Note that at P23 the MI was significantly decreased compared with WT for both groups of DS mice, while at later ages this decrease was maintained only in DS mice with seizures for both low (40–90 Hz) and high (90–160 Hz) γ (F(2,22) = 9.5, *p <0.05, **p <0.005, repeated-measures ANOVA with Tukey's test).
Figure 5.
Figure 5.
Acute treatment with CBD improves progression of θ-γ coupling in DS mice. WT mice showed steady progression of average θ-γ cross-frequency coupling over time [A; calculated for total γ (40–160 Hz); F(3,8) = 15.5], while for DS mice progression stagnated after P35 (B; F(3,15) = 27.5, *p <0.05, **p <0.005, repeated-measures ANOVA with Tukey's test). Note that analyses presented in A, B are performed on the same groups as included in Figure 2, excluding DS mice that died during the recording (n =3). C, Average phase-amplitude comodulograms of V1 following treatment with vehicle (VEH) or CBD (100 mg/kg) in DS mice between P35–P42. D, Average MI, calculated for θ (5–10 Hz) and total γ (40–160 Hz), was significantly increased following treatment with CBD (t(8) = 5.1, *p =0.0009, ratio paired t test).
Figure 6.
Figure 6.
Chronic seizure activity following hippocampal ablation of NaV1.1 is preceded by decreases in cortical θ-γ coupling. A, Example of dorsal and ventral hippocampal areas (dHC and vHC, respectively) infected by AAV-mCherry-Cre (red; Hoechst in blue). Scale bar: 500 µm. The targeted area included the CA1 and CA2 region (boxed area expanded in bottom inset; dashed line indicates border CA1/2; scale bar: 200 µm). B, Detail of hippocampal CA1/2 region showing reduced NaV1.1 staining in cells infected by AAV-mCherry-Cre (arrowheads indicate double-labeled cells) in Scn1afl/+ (HET) and Scn1afl/fl (HOM) when compared with WT. Scale bar: 50 µm. C, Spontaneous seizure in a HOM mouse on day 19 after hippocampal AAV-mCherry-Cre. D, Proportion of HET (n =7) and HOM (n =6) mice with IISs, after hippocampal AAV-mCherry-Cre on day 0. No IIS were observed in WT (n =7). E, Average frequency of spontaneous seizures following AAV-mCherry-Cre. F, Average phase-amplitude comodulograms of V1 at different time points after injection. G, H, MI, normalized to values obtained on day 2, was significantly decreased for both low γ (40–90 Hz; G) and high γ (90–160 Hz; H) frequencies in HET and HOM mice, when compared with WT mice (F(2,17) = 14.5 and F(2,17) = 24.9, respectively, *p <0.05, **p <0.005; two-way ANOVA with Tukey's test).
Figure 7.
Figure 7.
Cortical ablation of NaV1.1 specifically decreases θ-high γ coupling. A, Example of the V1 area infected by AAV-mCherry-Cre (red; Hoechst in blue). Scale bar: 500 µm. B, Detail of V1 showing reduced NaV1.1 staining in cells infected by AAV-mCherry-Cre (arrowheads indicate double-labeled cells) in Scn1afl/+ (HET) and Scn1afl/fl (HOM) when compared with WT. Scale bar: 50 µm. C, Spontaneous seizure recorded in an Scn1afl/fl mouse on day 18 after cortical AAV-mCherry-Cre. D, Proportion of HET (n =7) and HOM (n =6) mice with IISs, following cortical AAV-mCherry-Cre on day 0. No IIS were observed in WT mice (n =6). E, Average frequency of spontaneous seizures following injection of AAV-mCherry-Cre. F, Average phase-amplitude comodulograms of V1 at different time points after injection. G, H, MI, normalized to values obtained on day 2, was significantly decreased for high γ (H), but not low γ, in HET and HOM mice when compared with WT mice (F(2,16) = 18.5 and F(2,16) = 1.3, respectively, *p <0.05, **p <0.005; two-way ANOVA with Tukey's test).
Figure 8.
Figure 8.
Deficient hippocampal θ-γ coupling and power following local ablation of NaV1.1. A, Average phase-amplitude comodulograms of LFP obtained from dorsal hippocampus during days 2 (left) and 14 (right) after hippocampal injection of mCherry-Cre. B, θ-γ Coupling was reduced in Scn1afl/+ and Scn1afl/fl mice on day 14 (total θ-γ MI normalized to day 2; F(2,17) = 13.9, *p < 0.01, one-way ANOVA with Dunnett's test). C, MI normalized per 2-Hz γ frequency bin revealed that MI was specifically reduced for γ frequencies >150 Hz, while showing large variation for the lower γ range. D, Statistical comparison revealed no difference for θ-modulated low γ (F(2,17) = 1.3, p =0.31), but a significant reduction for high γ (F(2,17) = 11.4, p =0.001) for both Scn1afl/+ and Scn1afl/fl mice (*p =0.004 and *p =0.001, ANOVA with Dunnett's test). E, Hippocampal LFP power spectral density during REM sleep in WT (n =7), Scn1afl/+ (HET, n =7), and Scn1afl/fl (HOM, n =6) mice during days 2 (black), 14 (red), and 21 (gray) after hippocampal injection of mCherry-Cre. Power was significantly reduced only in HET and HOM mice. Asterisks of corresponding color indicate significant differences of power in θ (5–10 Hz), low γ (40–150 Hz), or high γ (150–300 Hz) on day 2 (*p <0.05, paired t tests).
Figure 9.
Figure 9.
θ-γ Coupling is affected more in areas that show fast ripples following hippocampal NaV1.1 ablation. A, Example phase-amplitude comodulograms of LFP in the dorsal and ventral hippocampus (dHC and vHC, respectively) following hippocampal injection of AAV-mCherry-Cre on day 0 in an Scn1afl/fl mouse. B, Examples of fast ripples observed in the ventral hippocampus of an Scn1afl/fl (left) and Scn1afl/+ (right) mouse. Fast ripples (detailed in insets, corresponding to the shaded area) were observed unilaterally (vHC ipsi) and had a high power in the 250- to 500-Hz range, as shown by the spectrogram of the ipsilateral vHC signal at the bottom. Their onset preceded or coincided with IISs on the contralateral side (vHC contra). C, For hippocampal LFP that contained fast ripples (ipsi), θ-γ coupling, assessed by the MI (averaged for the total γ frequency range, 40–300 Hz), was significantly decreased in the 12 h preceding the first seizure (preictal) when compared with day 2 after injection (baseline; *p =0.031, Wilcoxon test). In parallel, the γ frequency showing peak MI was significantly reduced (D; p =0.031, Wilcoxon test). MI changes of contralateral LFP that did not contain fast ripples (contra) did not reach statistical significance.
Figure 10.
Figure 10.
Modeling impaired NaV functioning in inhibitory neurons replicates the attenuated θ-γ coupling and decreased θ frequency observed after ablation of NaV1.1. A, Schematic of the computational network consisting of five EX, OLM, and fast-spiking BC neurons each with all-to-all connectivity. Full details about the model are provided in Extended Data Figure 10-1. B, Example traces of raw, θ-filtered (θ; 5–10 Hz), low γ-filtered (low γ; 40–100 Hz), and high γ (100–200 Hz) filtered LFP from the model with normal (baseline) and impaired NaV function in both OLM neurons (35 and 28 mS/cm2, respectively) and BC neurons (10 and 6 mS/cm2, respectively). C, Average LFP power spectra from the same simulations used in B with normal (black) or impaired (red) inhibitory NaV function, showing intact γ power and a reduced θ peak frequency in the latter (C, inset). D, Phase-amplitude comodulograms of these simulations show impaired θ-modulated γ. E, Stepwise impairment of NaV function specifically in BC neurons (blue, left plot) or OLM neurons (green, right plot) resulted in a leftward shift in peak θ frequency for OLM neurons (black: 35 mS/cm2, bright green: 28 mS/cm2, steps of 1.75 mS/cm2), but not for BC neurons (black: 10 mS/cm2, bright blue: 6 mS/cm2, steps of 1 mS/cm2). F, Average θ-γ MI calculated for total γ (left), low γ (center), and high γ (right) with decreasing levels of NaV function in BC neurons (blue), OLM neurons (green) and both BC and OLM neurons (black).

Comment in

Similar articles

Cited by

References

    1. Almog Y, Brusel M, Anderson K, Rubinstein M (2019) Early hippocampal hyperexcitability followed by disinhibition in a mouse model of Dravet syndrome. bioRxiv. doi: https://doi.org/10.1101/790170.
    1. Axmacher N, Henseler MM, Jensen O, Weinreich I, Elger CE, Fell J (2010) Cross-frequency coupling supports multi-item working memory in the human hippocampus. Proc Natl Acad Sci USA 107:3228–3233. 10.1073/pnas.0911531107 - DOI - PMC - PubMed
    1. Bandarabadi M, Boyce R, Gutierrez Herrera C, Bassetti CL, Williams S, Schindler K, Adamantidis A (2019) Dynamic modulation of theta-gamma coupling during rapid eye movement sleep. Sleep 42: zsz182. 10.1093/sleep/zsz182 - DOI - PubMed
    1. Belluscio MA, Mizuseki K, Schmidt R, Kempter R, Buzsáki G (2012) Cross-frequency phase-phase coupling between θ and γ oscillations in the hippocampus. J Neurosci 32:423–435. 10.1523/JNEUROSCI.4122-11.2012 - DOI - PMC - PubMed
    1. Bender AC, Natola H, Ndong C, Holmes GL, Scott RC, Lenck-Santini PP (2013) Focal Scn1a knockdown induces cognitive impairment without seizures. Neurobiol Dis 54:297–307. 10.1016/j.nbd.2012.12.021 - DOI - PMC - PubMed

Publication types

MeSH terms