Transcriptional Silencing by TsrA in the Evolution of Pathogenic Vibrio cholerae Biotypes
- PMID: 33234688
- PMCID: PMC7701989
- DOI: 10.1128/mBio.02901-20
Transcriptional Silencing by TsrA in the Evolution of Pathogenic Vibrio cholerae Biotypes
Abstract
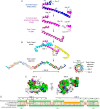
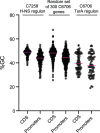
Vibrio cholerae is a globally important pathogen responsible for the severe epidemic diarrheal disease called cholera. The current and ongoing seventh pandemic of cholera is caused by El Tor strains, which have completely replaced the sixth-pandemic classical strains of V. cholerae To successfully establish infection and disseminate to new victims, V. cholerae relies on key virulence factors encoded on horizontally acquired genetic elements. The expression of these factors relies on the regulatory architecture that coordinates the timely expression of virulence determinants during host infection. Here, we apply transcriptomics and structural modeling to understand how type VI secretion system regulator A (TsrA) affects gene expression in both the classical and El Tor biotypes of V. cholerae We find that TsrA acts as a negative regulator of V. cholerae virulence genes encoded on horizontally acquired genetic elements. The TsrA regulon comprises genes encoding cholera toxin (CT), the toxin-coregulated pilus (TCP), and the type VI secretion system (T6SS), as well as genes involved in biofilm formation. The majority of the TsrA regulon is carried on horizontally acquired AT-rich genetic islands whose loss or acquisition could be directly ascribed to the differences between the classical and El Tor strains studied. Our modeling predicts that the TsrA protein is a structural homolog of the histone-like nucleoid structuring protein (H-NS) oligomerization domain and is likely capable of forming higher-order superhelical structures, potentially with DNA. These findings describe how TsrA can integrate into the intricate V. cholerae virulence gene expression program, controlling gene expression through transcriptional silencing.IMPORTANCE Pathogenic Vibrio cholerae strains express multiple virulence factors that are encoded by bacteriophage and chromosomal islands. These include cholera toxin and the intestinal colonization pilus called the toxin-coregulated pilus, which are essential for causing severe disease in humans. However, it is presently unclear how the expression of these horizontally acquired accessory virulence genes can be efficiently integrated with preexisting transcriptional programs that are presumably fine-tuned for optimal expression in V. cholerae before its conversion to a human pathogen. Here, we report the role of a transcriptional regulator (TsrA) in silencing horizontally acquired genes encoding important virulence factors. We propose that this factor could be critical to the efficient acquisition of accessory virulence genes by silencing their expression until other signals trigger their transcriptional activation within the host.
Keywords: TsrA; Vibrio cholerae; horizontal gene transfer; structural modeling; transcriptional regulation.
Copyright © 2020 Caro et al.
Figures


Similar articles
-
Nucleoid-associated proteins shape the global protein occupancy and transcriptional landscape of a clinical isolate of Vibrio cholerae.mSphere. 2024 Jul 30;9(7):e0001124. doi: 10.1128/msphere.00011-24. Epub 2024 Jun 26. mSphere. 2024. PMID: 38920383 Free PMC article.
-
Novel Cholera Toxin Variant and ToxT Regulon in Environmental Vibrio mimicus Isolates: Potential Resources for the Evolution of Vibrio cholerae Hybrid Strains.Appl Environ Microbiol. 2019 Jan 23;85(3):e01977-18. doi: 10.1128/AEM.01977-18. Print 2019 Feb 1. Appl Environ Microbiol. 2019. PMID: 30446560 Free PMC article.
-
TsrA Regulates Virulence and Intestinal Colonization in Vibrio cholerae.mSphere. 2020 Dec 9;5(6):e01014-20. doi: 10.1128/mSphere.01014-20. mSphere. 2020. PMID: 33298574 Free PMC article.
-
Expression of Vibrio cholerae virulence genes in response to environmental signals.Curr Issues Intest Microbiol. 2002 Sep;3(2):29-38. Curr Issues Intest Microbiol. 2002. PMID: 12400636 Review.
-
Phage-bacterial interactions in the evolution of toxigenic Vibrio cholerae.Virulence. 2012 Nov 15;3(7):556-65. doi: 10.4161/viru.22351. Epub 2012 Oct 17. Virulence. 2012. PMID: 23076327 Free PMC article. Review.
Cited by
-
Paradoxical Activation of a Type VI Secretion System Phospholipase Effector by Its Cognate Immunity Protein.J Bacteriol. 2023 Jun 27;205(6):e0011323. doi: 10.1128/jb.00113-23. Epub 2023 May 22. J Bacteriol. 2023. PMID: 37212679 Free PMC article.
-
Nucleoid-associated proteins shape the global protein occupancy and transcriptional landscape of a clinical isolate of Vibrio cholerae.mSphere. 2024 Jul 30;9(7):e0001124. doi: 10.1128/msphere.00011-24. Epub 2024 Jun 26. mSphere. 2024. PMID: 38920383 Free PMC article.
-
New Insights into Vibrio cholerae Biofilms from Molecular Biophysics to Microbial Ecology.Adv Exp Med Biol. 2023;1404:17-39. doi: 10.1007/978-3-031-22997-8_2. Adv Exp Med Biol. 2023. PMID: 36792869 Free PMC article.
-
Sporadic type VI secretion in seventh pandemic Vibrio cholerae.Microbiology (Reading). 2023 May;169(5):001329. doi: 10.1099/mic.0.001329. Microbiology (Reading). 2023. PMID: 37134007 Free PMC article.
References
Publication types
MeSH terms
Substances
Grants and funding
LinkOut - more resources
Full Text Sources
Medical
Molecular Biology Databases
Miscellaneous

