. 2020 Nov 24;11(1):5971.
doi: 10.1038/s41467-020-19739-0.

Shape-preserving erosion controlled by the graded microarchitecture of shark tooth enameloid

Affiliations

Shape-preserving erosion controlled by the graded microarchitecture of shark tooth enameloid

Shahrouz Amini et al. Nat Commun. .

Abstract

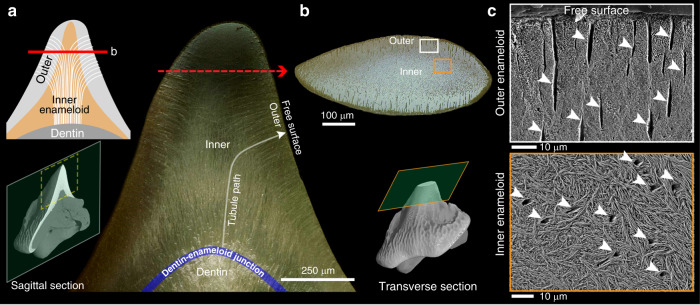
The teeth of all vertebrates predominantly comprise the same materials, but their lifespans vary widely: in stark contrast to mammals, shark teeth are functional only for weeks, rather than decades, making lifelong durability largely irrelevant. However, their diets are diverse and often mechanically demanding, and as such, their teeth should maintain a functional morphology, even in the face of extremely high and potentially damaging contact stresses. Here, we reconcile the dilemma between the need for an operative tooth geometry and the unavoidable damage inherent to feeding on hard foods, demonstrating that the tooth cusps of Port Jackson sharks, hard-shelled prey specialists, possess unusual microarchitecture that controls tooth erosion in a way that maintains functional cusp shape. The graded architecture in the enameloid provokes a location-specific damage response, combining chipping of outer enameloid and smooth wear of inner enameloid to preserve an efficient shape for grasping hard prey. Our discovery provides experimental support for the dominant theory that multi-layered tooth enameloid facilitated evolutionary diversification of shark ecologies.


Conflict of interest statement

The authors declare no competing interests.

Figures

Fig. 1
Fig. 1. Anterior cuspidate teeth of the Port Jackson shark.
a Photograph of an adult male Port Jackson shark (H. portusjacksoni). b X-ray microtomography image of the upper jaw tooth array showing the arrangement of the cuspidate and molariform teeth, at the anterior and posterior edges of the tooth array, respectively. The bottom inset image shows a single “file” of the cuspidate teeth, and the development from newly formed, to functional to post-functional teeth. c High-resolution X-ray microtomography demonstrating the change in tooth cusp morphology that occurs as teeth pass through the functional zone (i.e., from rows 8–4). d Virtual sections of the same pre-functional and post-functional teeth, illustrating erosion occurs only in the enameloid layer. In addition to the sharp transition in relative density between enameloid and dentin, a gradation in density is also present within the enameloid layer.
Fig. 2
Fig. 2. Microtubules in the enameloid layer of the Port Jackson shark teeth.
a Dark-field optical micrograph of a sagittal section, and b bright-field optical micrograph of a transverse section of the cusp (rows 6–7) showing the paths of tubules from the inner toward the outer enameloid at the free surface of the cusp. c SEM micrographs, showing that the arced morphologies of microtubules result in their being cross- vs. longitudinally sectioned in the inner vs. outer enameloid, respectively (arrows).
Fig. 3
Fig. 3. Elemental distribution maps extracted from sagittal section of the enameloid using high-resolution EDS analysis, showing the absence of site-specific compositional variation in the enameloid layer.
a Spectral color code of Ca map (right) where higher calcium wt% is associated with higher relative intensity in µ-CT data (left and Fig. 1d). The locations of enameloid and dentin marked with circles were used for point elemental analysis studies. The colored dots indicate tooth regions (maroon: outer enameloid; red: outer-inner transition; orange: inner enameloid; and blue: dentin) are consistent also with b and c. b Comparison of the collected EDS data presenting the uniformity of the elemental spectra across different regions of the enameloid. c Mean values of Ca/P ratios showing a statistically significant (P < 0.001, T test: paired, n = 5) compositional shift between the dentin and both enameloid regions, whereas there was no significant difference (P = 0.02, T test: paired, n = 5) between the outer and inner enameloid (bars represent mean values ± standard deviations). d High-resolution EDS maps collected from the enameloid revealing a uniform distribution of the chemical elements. e EDS maps gathered with higher magnification and collected counts (longer probing time), revealing that microtubule walls contained the highest concentration of Mg (bars represent mean values ± standard deviations, n = 5).
Fig. 4
Fig. 4. Raman analysis of the enameloid demonstrating the graded microarchitecture of the FAP crystallites.
a Raman spectra profiles of enameloid regions (the color-coded spots marked on the tooth image), underlining that the enameloid is homogeneously crystalline fluorapatite in composition. The change in the relative intensity of vibrational band peaks ν4 (581 cm−1, 591 cm−1) and ν3 (1033 cm−1, 1041 cm−1), denoting variation in FAP crystallite alignment in different regions. b Polarized Raman spectroscopy study of a geological FAP monocrystal, used to calibrate the relationship between crystal orientation and peak intensity for ν3 and ν4 vibrational bands. Extracted spectra reveal that the relative intensities of the 581 cm−1 and 591 cm−1 peaks, as well as the presence of the 1059 cm−1 peak in cross-polarized measurements indicate the crystallographic orientations of the FAP crystals. c Collected Raman maps using parallel polarization and cross-polarization acquired in the rectangular ROI indicated in the schematic image at the top of the panel (scanning area of 50 μm × 194 μm). The maps were filtered for the orientation-sensitive peaks shown in c (581 cm−1, 591 cm−1, 1059 cm−1) to illustrate local variation in the relative peak intensity. By calibrating the collected maps from the enameloid according to the extracted spectra from the geological FAP (b and Supplementary Fig. 5), the orientations of FAP crystallites in different enameloid layers were quantified. As illustrated by the schematic image on the right of the panel, the parallel-aligned FAP crystallites at the free surface of the outer enameloid gradually transition to a tangled organization in the inner enameloid.
Fig. 5
Fig. 5. Graded microarchitectural arrangement of FAP crystallites in the enameloid layer.
The FESEM micrographs collected from acid-etched sections of the enameloid reveal that while the outer enameloid is composed of parallel and aligned FAP bundles, the inner enameloid possesses a tangled and woven architecture. The inner enameloid at the apex of the cusp (top row, middle panel) is exposed by the natural erosion of the outer enameloid layer that occurs with use (e.g., from grasping hard prey, ingesting sediment). FESEM imaging also showed the thin (2–10 µm) shiny enameloid layer, comprising randomly packed crystallites and covering the outer surface of the tooth. The color designations for tooth regions are the same as in Fig. 3a–c.
Fig. 6
Fig. 6. Scratch-induced damage mechanisms in the different layers of the enameloid.
Post-scratch FESEM micrographs revealing the different induced damage modes, namely intercrystalline sliding (left column), delamination (middle column), and compaction (right column), occurring in different enameloid regions and under different loading orientations (also from left to right): in the outer layer under normal contact (biting direction), the outer layer under tangential contact (along the c-axis of FAP crystallites), and the inner layer. Scratching in the tangential orientation in the outer layer cause the most severe cracks and delamination across the scratch track, evidenced also by the force fluctuations in the lateral force-displacement curve (middle column). In hydrated conditions, despite an increment in lateral forces (due to higher contact depths), the pattern of the curves and the nature of the of the damages were consistent with the dry condition (Supplementary Fig. 7). In contrast, scratching in the normal orientation in the outer layer (left column) and inner layer (right column) induces only microcracks along the scratch tracks. The smooth erosion in the inner layer manifested by a wider scratch track and a smooth lateral force-displacement curve indicates compaction damage, which arises from the woven arrangement of the FAP crystallites and eventually prevents the formation of brittle damage. The color designations for tooth regions are the same as in Figs. 3a–c and 5.
Fig. 7
Fig. 7. Differentiated damage modes in the outer and inner enameloid, likely induced by hard targets, such as seashells, sea urchin spines/test, sand, and sediments.
ac Wide-field backscattered scanning electron micrographs presenting b smooth erosion at the apex of the cusp and c chipped zones in the outer enameloid (white arrows). d High-resolution μ-CT images revealing the propagation of the circumferential microcracks beneath and along the free surface of the outer enameloid. These microcracks cause chipping damage. e Port Jackson shark photographs demonstrating the anterior grasping position of the cuspidate teeth, as points of first contact with food items. In the detail photo of the mouth (f), the teeth are red, believed to be from repeated ingestion of sea urchins, a common hard-shelled prey item (J. Kadar, pers. comm.). g A schematic illustration of the enameloid graded architecture and corresponding damage mechanisms. The graded microarchitecture of the enameloid layers results in chipping damage in the outer layer and smooth erosion in the inner layer, which promotes a higher rate of damage in the outer enameloid, and consequently a self-sharpening mechanism at the cusp. The estimated radii of an eroded cusp with a graded architecture (rG) and an eroded cusp with any given homogeneous architecture (rH) are illustrated for a rough visualization. The color designations for tooth regions are the same as in Figs. 3a–c and 5.

References

    1. Corn KA, Farina SC, Brash J, Summers AP. Modelling tooth-prey interactions in sharks: the importance of dynamic testing. R. Soc. Open Sci. 2016;3:160141–160141. doi: 10.1098/rsos.160141. - DOI - PMC - PubMed
    1. Enax J, Janus AM, Raabe D, Epple M, Fabritius H-O. Ultrastructural organization and micromechanical properties of shark tooth enameloid. Acta Biomater. 2014;10:3959–3968. doi: 10.1016/j.actbio.2014.04.028. - DOI - PubMed
    1. Shellis, R. P. in The Periodontal Ligament in Health and Disease (eds Berkovitz, B. K. B., Moxham, B. J. & Newman, H. N.) (Pergamon Press, Oxford, 1982).
    1. Daculsi G, Kerebel LM. Ultrastructural study and comparative analysis of fluoride content of enameloid in sea-water and fresh-water sharks. Arch. Oral. Biol. 1980;25:145–151. doi: 10.1016/0003-9969(80)90013-8. - DOI - PubMed
    1. Marcus MA, et al. Parrotfish teeth: stiff biominerals whose microstructure makes them tough and abrasion-resistant to bite stony corals. ACS Nano. 2017;11:11856–11865. doi: 10.1021/acsnano.7b05044. - DOI - PubMed

Publication types