Horizontally acquired papGII-containing pathogenicity islands underlie the emergence of invasive uropathogenic Escherichia coli lineages
- PMID: 33235212
- PMCID: PMC7686366
- DOI: 10.1038/s41467-020-19714-9
Horizontally acquired papGII-containing pathogenicity islands underlie the emergence of invasive uropathogenic Escherichia coli lineages
Abstract
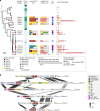
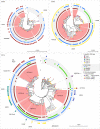
Escherichia coli is the leading cause of urinary tract infection, one of the most common bacterial infections in humans. Despite this, a genomic perspective is lacking regarding the phylogenetic distribution of isolates associated with different clinical syndromes. Here, we present a large-scale phylogenomic analysis of a spatiotemporally and clinically diverse set of 907 E. coli isolates, including 722 uropathogenic E. coli (UPEC) isolates. A genome-wide association approach identifies the (P-fimbriae-encoding) papGII locus as the key feature distinguishing invasive UPEC, defined as isolates associated with severe UTI, i.e., kidney infection (pyelonephritis) or urinary-source bacteremia, from non-invasive UPEC, defined as isolates associated with asymptomatic bacteriuria or bladder infection (cystitis). Within the E. coli population, distinct invasive UPEC lineages emerged through repeated horizontal acquisition of diverse papGII-containing pathogenicity islands. Our findings elucidate the molecular determinants of severe UTI and have implications for the early detection of this pathogen.
Conflict of interest statement
The authors declare no competing interests.
Figures


Comment in
-
Uro-Science.J Urol. 2021 Jul;206(1):162-163. doi: 10.1097/JU.0000000000001795. Epub 2021 Apr 16. J Urol. 2021. PMID: 33858176 No abstract available.
Similar articles
-
Virulence genes and phylogenetic groups of uropathogenic Escherichia coli isolates from patients with urinary tract infection and uninfected control subjects: a case-control study.BMC Infect Dis. 2021 Apr 17;21(1):361. doi: 10.1186/s12879-021-06036-4. BMC Infect Dis. 2021. PMID: 33865334 Free PMC article.
-
Distribution of papG alleles among uropathogenic Escherichia coli from reproductive age women.J Biomed Sci. 2022 Sep 7;29(1):66. doi: 10.1186/s12929-022-00848-5. J Biomed Sci. 2022. PMID: 36068602 Free PMC article.
-
Pathogenomics of uropathogenic Escherichia coli.Indian J Med Microbiol. 2012 Apr-Jun;30(2):141-9. doi: 10.4103/0255-0857.96657. Indian J Med Microbiol. 2012. PMID: 22664427 Review.
-
Genomic epidemiology and antibiotic susceptibility profiling of uropathogenic Escherichia coli among children in the United States.mSphere. 2023 Oct 24;8(5):e0018423. doi: 10.1128/msphere.00184-23. Epub 2023 Aug 15. mSphere. 2023. PMID: 37581436 Free PMC article.
-
Virulence factors of uropathogenic E. coli and their interaction with the host.Adv Microb Physiol. 2014;65:337-72. doi: 10.1016/bs.ampbs.2014.08.006. Epub 2014 Nov 4. Adv Microb Physiol. 2014. PMID: 25476769 Review.
Cited by
-
Distribution of papA and papG Variants among Escherichia coli Genotypes: Association with Major Extraintestinal Pathogenic Lineages.Int J Mol Sci. 2024 Jun 17;25(12):6657. doi: 10.3390/ijms25126657. Int J Mol Sci. 2024. PMID: 38928363 Free PMC article.
-
Predicting the primary infection source of Escherichia coli bacteremia using virulence-associated genes.Eur J Clin Microbiol Infect Dis. 2024 Apr;43(4):641-648. doi: 10.1007/s10096-024-04754-6. Epub 2024 Jan 25. Eur J Clin Microbiol Infect Dis. 2024. PMID: 38273191 Free PMC article.
-
Phylogroup stability contrasts with high within sequence type complex dynamics of Escherichia coli bloodstream infection isolates over a 12-year period.Genome Med. 2021 May 5;13(1):77. doi: 10.1186/s13073-021-00892-0. Genome Med. 2021. PMID: 33952335 Free PMC article.
-
Genomics, biofilm formation and infection of bladder epithelial cells in potentially uropathogenic Escherichia coli (UPEC) from animal sources and human urinary tract infections (UTIs) further support food-borne transmission.One Health. 2023 May 3;16:100558. doi: 10.1016/j.onehlt.2023.100558. eCollection 2023 Jun. One Health. 2023. PMID: 37363240 Free PMC article.
-
Genotypic and phenotypic characterisation of asymptomatic bacteriuria (ABU) isolates displaying bacterial interference against multi-drug resistant uropathogenic E. Coli.Arch Microbiol. 2024 Sep 9;206(10):394. doi: 10.1007/s00203-024-04114-0. Arch Microbiol. 2024. PMID: 39245770 Free PMC article.
References
-
- Vihta K-D, et al. Trends over time in Escherichia coli bloodstream infections, urinary tract infections, and antibiotic susceptibilities in Oxfordshire, UK, 1998–2016: a study of electronic health records. Lancet Infect. Dis. 2018;18:1138–1149. doi: 10.1016/S1473-3099(18)30353-0. - DOI - PMC - PubMed
-
- van Hout D, et al. Extended-spectrum beta-lactamase (ESBL)-producing and non-ESBL-producing Escherichia coli isolates causing bacteremia in the Netherlands (2014–2016) differ in clonal distribution, antimicrobial resistance gene and virulence gene content. PLoS ONE. 2020;15:e0227604. doi: 10.1371/journal.pone.0227604. - DOI - PMC - PubMed
Publication types
MeSH terms
Substances
Grants and funding
LinkOut - more resources
Full Text Sources
Molecular Biology Databases

