. 2020 Nov 24;11(1):5958.
doi: 10.1038/s41467-020-19665-1.

Common diseases alter the physiological age-related blood microRNA profile

Affiliations

Common diseases alter the physiological age-related blood microRNA profile

Tobias Fehlmann et al. Nat Commun. .

Abstract

Aging is a key risk factor for chronic diseases of the elderly. MicroRNAs regulate post-transcriptional gene silencing through base-pair binding on their target mRNAs. We identified nonlinear changes in age-related microRNAs by analyzing whole blood from 1334 healthy individuals. We observed a larger influence of the age as compared to the sex and provide evidence for a shift to the 5' mature form of miRNAs in healthy aging. The addition of 3059 diseased patients uncovered pan-disease and disease-specific alterations in aging profiles. Disease biomarker sets for all diseases were different between young and old patients. Computational deconvolution of whole-blood miRNAs into blood cell types suggests that cell intrinsic gene expression changes may impart greater significance than cell abundance changes to the whole blood miRNA profile. Altogether, these data provide a foundation for understanding the relationship between healthy aging and disease, and for the development of age-specific disease biomarkers.


Conflict of interest statement

M.K. is also employed by Hummingbird Diagnostic GmbH. The remaining authors declare no competing interests.

Figures
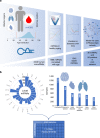
Fig. 1
Fig. 1. Study characteristics.
a Study set up and analysis workflow from high-throughput data to a specific aging network. The cohort consist of 4393 samples of which the age distribution is provided. For the 4393 samples genome wide miRNA screening using microarrays has been performed. The first analysis describes 1568 miRNAs that are correlated to age in healthy individuals. In the second step we identified disease specific miRNA changes with aging and finally define a set of 1242 miRNAs that are not affected by diseases. Finally, to model regulatory cascades in healthy aging we related the miRNA data to plasma proteins and identified a core aging network. b The circular plot shows the genome wide nature of our miRNA approach, all miRNAs from miRBase V21 were included in the experimental analysis. We measured 4393 samples for the abundance of these miRNAs, resulting in a 2549 times 4393 data table containing 11.2 million miRNA measurements that correspond to over 2 × 108 spots on the arrays.
Fig. 2
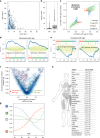
Fig. 2. miRNAs dependency on age and gender.
a Smoothed scatter plot of the two-tailed age and gender association p-value for 2549 miRNAs. P-values for the sex are computed using Wilcoxon Mann–Whitney test and for the Spearman Correlation via the asymptotic t approximation. The p-values are Benjamini–Hochberg adjusted. b Boxplot of the age and gender p-value from a for 2549 miRNAs. The box spans the 25% and 75% quantile, the solid horizontal line represents the median and the whiskers extend to the most extreme data point which is no more than 1.5 times the interquartile range from the box. c Correlation of miRNAs with age in males and females. Gray dots: not significant; orange and blue dots: miRNAs significantly correlated with age only in males or females; green dots: miRNAs significantly correlated with age in males and females. d Results of the miRNA enrichment analysis. Colored curves in the background represent random permutations of miRNAs. The cluster membership is projected next to the order of miRNAs. The category “negative correlated with age” is highly significant and confirms our data in general. Also, the category “downregulated in AD” is enriched with miRNAs decreasing over age. e Regulation of synaptic transmission is among the categories being enriched in miRNAs going up with age. Moreover, APP catabolic processes is another category being enriched in miRNAs going up with age. f Linear Pearson correlation versus non-linear distance correlation for the association of age to miRNAs. Orange dots have a high non-linear correlation that is not explained by linear correlation and are decreasing with age, green dots have a high non-linear correlation that is not explained by linear correlation and are increasing with. The orange dotted line represents a smoothed spline and the four numbers in gray circles represent the position of miRNAs where examples are provided in g. g Examples of correlation for miRNAs with age. (1) gray: no correlation; (2) orange dominantly positive linear correlation; (3) blue dominantly negative linear correlation; (4) non-linear correlation. Each solid line is a smoothing spline. h Tissue enrichment for the miRNAs that are correlated with age in a non-linear fashion. The human model has all organs highlighted in gray that are significantly enriched. The table on the right lists the organs with corresponding p-values. P-values have been computed using the hypergeometric distribution and were adjusted for multiple testing using the Benjamini–Hochberg approach.
Fig. 3
Fig. 3. Diseases miRNAs are affected by age effects.
a Boxplot of the Spearman correlation coefficient for each miRNA to all samples, healthy individuals, and patients. Group sizes: nHC = 1334, nPD = 944, nHD = 607, nNTLD, nLC = 517, nOD = 405. The box spans the 25% and 75% quantile, the solid horizontal line represents the median and the whiskers extend to the most extreme data point which is no more than 1.5 times the interquartile range from the box. b Boxplot of p-values for the Spearman correlation coefficient of each miRNA to all samples, healthy individuals, and patients from a. Group sizes: nHC = 1334, nPD = 944, nHD = 607, nNTLD, nLC = 517, nOD = 405. The box spans the 25% and 75% quantile, the solid horizontal line represents the median and the whiskers extend to the most extreme data point which is no more than 1.5 times the interquartile range from the box. The p-values have been computed via the asymptotic t approximation. c Number of deregulated miRNAs in disease groups depending on different ages in a sliding window analysis. Each solid line is a smoothing spline (green–heart diseases; red–non tumor lung diseases; gray–lung cancer; blue–Parkinson’s disease). The areas represent the 95% confidence intervals. For all disease groups, the number of deregulated miRNAs decreases with age while it increases for Parkinson’s Disease. d Smoothed scatterplot showing the average effect size per miRNA dependent on the number of diseases where the miRNA is associated with. In the lower right corner (the y-axis value of 1) the specific miRNAs with high effect sizes can be found. In the upper right corner, miRNAs with high effect sizes independent of the disease are located. The two numbers represent the location of the examples provided in e and f. e Example of a miRNA that is downregulated in heart diseases of younger patients, upregulated in older Parkinson’s patients and not deregulated in lung diseases. Each solid line is a smoothing spline (green–heart diseases; red–non tumor lung diseases; gray–lung cancer; blue–Parkinson’s disease). The areas represent the 95% confidence intervals. f Example of a miRNA from the lower right part of Fig. 3d. The miRNA is significant upregulated in lung cancer independent of age but basically not associated with other diseases. Color codes of panels c, e, and f are matched. Each solid line is a smoothing spline (green–heart diseases; red–non tumor lung diseases; gray–lung cancer; blue–Parkinson’s disease). The areas represent the 95% confidence intervals.
Fig. 4
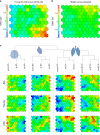
Fig. 4. Disease specificity of miRNA biomarkers.
a Heat map representation of the SOM analysis as a 10 × 10 grid with 100 entries. Each cell contains at least one miRNA and up to 20 miRNAs. The full annotation of miRNAs to cells are provided in Supplementary Data 7). The cells are colored by the effect size of miRNAs for the comparison in old versus young. Red cells contain miRNAs with effect sizes >0.5 that are upregulated and in blue miRNAs that are downregulated with effect sizes <−0.5. b Same heat map as in a but colored for the difference in young versus old. The scale for the effect size has been kept the same as a. Thus fewer yellow/red, as well as blue spots indicate overall lower effect sizes. c Clustering of the SOM results in biomarkers for the four diseases and in all biomarkers independently of age, biomarkers for young patients and biomarker for old patients. The dendrogram has been computed from hierarchical clustering (complete linkage on the Euclidean distance). In all cases the biomarkers cluster by disease and not by age and the old biomarker set is closest to the all biomarker set while the young biomarker set has larger distances. Overall, NTLD and LCa markers are closest to each other, second closest are heart biomarkers and most different PD biomarkers. The SOM cells clearly highlight differences between biomarkers for diseases in young and old patients.
Fig. 5
Fig. 5. Blood cell deconvolution.
a The distribution of miRNAs in the different blood compounds. The rows are sorted by the blood compounds given on the right (RBC: red blood cell; CF: cell free), the columns are sorted according to a decreasing number of miRNAs. b Relative abundance of all miRNAs in the different blood compounds. c Distribution of miRNAs in cell types. The green distribution is the background and presents the relative composition of 1451 miRNAs in cluster 3. The blue distribution represents miRNAs increasing by age (cluster 4&5) and are enriched e.g., in B cells and serum. The red distribution represents miRNAs decreasing by age (cluster 1&2) and are enriched e.g., in neutrophils and RBCs.
Fig. 6
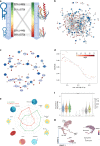
Fig. 6. Age related miRNAs are correlated to age related proteins.
a Correlation of miRNAs to proteins. miRNAs and proteins are sorted by increasing correlation with age. Thin lines are miRNA/gene interactions between top/bottom 10% of miRNAs and proteins. Numbers represent actual count of edges. b, c Core network. Proteins (larger nodes) are targeted by miRNAs (smaller nodes). Edge width correspond to the correlation. Blue nodes represent increase with age, red nodes decrease with age. The outer circles of the protein nodes indicate an expected an influence of the miRNAs leading to an increase with age. Panel c represents a more stringent version of the network from panel b. d One representative example of an edge from the network in b, c: SEMA3E and miR-6812-3p. Each dot represents all individuals in a time interval of 10 years, shifted between 30 and 70 years. SEMA3E is high expressed in older individuals while miR-6812-3p is low expressed (dark red points in the upper right corner). In young individuals the pattern is opposite (tale points in the lower right corner). e Blood cell compound distribution. miRNAs from the core network come from neutrophils, monocytes and B cells. f Violin plot of expression of SRSF7 in human blood cells. g UMAP embedding of human blood cells colored by expression of SRSF7.

References

    1. Harman D. The aging process: major risk factor for disease and death. Proc. Natl Acad. Sci. USA. 1991;88:5360–5363. doi: 10.1073/pnas.88.12.5360. - DOI - PMC - PubMed
    1. Valdes AM, Glass D, Spector TD. Omics technologies and the study of human ageing. Nat. Rev. Genet. 2013;14:601–607. doi: 10.1038/nrg3553. - DOI - PubMed
    1. Deelen J, et al. A meta-analysis of genome-wide association studies identifies multiple longevity genes. Nat. Commun. 2019;10:3669. doi: 10.1038/s41467-019-11558-2. - DOI - PMC - PubMed
    1. Aramillo Irizar P, et al. Transcriptomic alterations during ageing reflect the shift from cancer to degenerative diseases in the elderly. Nat. Commun. 2018;9:327. doi: 10.1038/s41467-017-02395-2. - DOI - PMC - PubMed
    1. Lehallier B, et al. Undulating changes in human plasma proteome profiles across the lifespan. Nat. Med. 2019;25:1843–1850. doi: 10.1038/s41591-019-0673-2. - DOI - PMC - PubMed

Publication types