. 2020 Nov 24;11(1):5972.
doi: 10.1038/s41467-020-19603-1.

Recent evolution of a TET-controlled and DPPA3/STELLA-driven pathway of passive DNA demethylation in mammals

Affiliations

Recent evolution of a TET-controlled and DPPA3/STELLA-driven pathway of passive DNA demethylation in mammals

Christopher B Mulholland et al. Nat Commun. .

Erratum in

Abstract

Genome-wide DNA demethylation is a unique feature of mammalian development and naïve pluripotent stem cells. Here, we describe a recently evolved pathway in which global hypomethylation is achieved by the coupling of active and passive demethylation. TET activity is required, albeit indirectly, for global demethylation, which mostly occurs at sites devoid of TET binding. Instead, TET-mediated active demethylation is locus-specific and necessary for activating a subset of genes, including the naïve pluripotency and germline marker Dppa3 (Stella, Pgc7). DPPA3 in turn drives large-scale passive demethylation by directly binding and displacing UHRF1 from chromatin, thereby inhibiting maintenance DNA methylation. Although unique to mammals, we show that DPPA3 alone is capable of inducing global DNA demethylation in non-mammalian species (Xenopus and medaka) despite their evolutionary divergence from mammals more than 300 million years ago. Our findings suggest that the evolution of Dppa3 facilitated the emergence of global DNA demethylation in mammals.


Conflict of interest statement

The authors declare no competing interests.

Figures

Fig. 1
Fig. 1. TET1 and TET2 prevent hypermethylation of the naïve genome.
a Loss of TET catalytic activity leads to global DNA hypermethylation. Percentage of total 5mC as measured by RRBS. For each genotype, n = 2 biologically independent samples per condition. b Loss of TET catalytic activity leads to widespread DNA hypermethylation especially at repetitive elements. Relative proportion of DNA hypermethylation (q value < 0.05; absolute methylation difference >20%) at each genomic element in T1CM, T2CM, and T12CM ESCs compared to wt ESCs. c Heat map of the hierarchical clustering of the RRBS data depicting the top 2000 most variable 1 kb tiles during differentiation of wt ESCs to EpiLCs with n = 2 biologically independent samples per genotype and condition. d Venn diagram depicting the overlap of hypermethylated (compared to wt ESCs; q value < 0.05; absolute methylation difference >20%) sites among T1CM, T2CM, and T12CM ESCs and wt EpiLCs. e, f TET binding is not associated with DNA hypermethylation in TET mutant ESCs. Occupancy of (e) TET1 and (f) TET2 over 1 kb tiles hypermethylated (dark red) or unchanged (dark gray) in T1CM and T2CM ESCs, respectively (SPMR: Signal per million reads). In the boxplots in (a) and (c), horizontal black lines within boxes represent median values, boxes indicate the upper and lower quartiles, and whiskers extend to the most extreme value within 1.5 x the interquartile range from each hinge. In (b) and (d), the q-values were calculated with a two-sided Wald test followed by p-value adjustment using SLIM.
Fig. 2
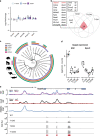
Fig. 2. TET1 and TET2 catalytic activity is necessary for Dppa3 expression.
a Expression of genes involved in regulating DNA methylation levels in T1CM, T2CM, and T12CM ESCs as assessed by RNA-seq. Expression is given as the log2 fold-change compared to wt ESCs. Error bars indicate mean ± SD, n = 4 biological replicates. No significant changes observable (Likelihood ratio test). b Dppa3 is downregulated upon loss of TET activity and during differentiation. Venn diagram depicting the overlap (red) of genes differentially expressed (compared to wt ESCs; adjusted p < 0.05) in T1CM, T2CM, T12CM ESCs, and wt EpiLCs. c Phylogenetic tree of TET1, DNMT1, UHRF1, and DPPA3 in metazoa. d Dppa3 expression levels as determined by RNA-seq in the indicated ESC and EpiLC lines (n = 4 biological replicates). e TET proteins bind and actively demethylate the Dppa3 locus. Genome browser view of the Dppa3 locus with tracks of the occupancy (Signal pileup per million reads; (SPMR)) of TET1, TET2, and PRDM14 in wt ESCs, 5caC enrichment in wt vs. TDG−/− ESCs, and 5mC (%) levels in wt, T1CM, T2CM, and T12CM ESCs (RRBS). Red bars indicate CpGs covered by RRBS. In the boxplots in (d), horizontal black lines within boxes represent median values, boxes indicate the upper and lower quartiles, and whiskers extend to the most extreme value within 1.5 x the interquartile range from each hinge.
Fig. 3
Fig. 3. DPPA3 acts downstream of TET1 and TET2 to establish and preserve global hypomethylation.
a Dppa3 loss results in global hypermethylation. Percentage of total 5mC as measured by RRBS using n = 2 biologically independent samples per condition. b Dppa3 prevents the premature acquisition of a primed methylome. Principal component (PC) analysis of RRBS data from wt, T1CM, T2CM, and T12CM ESCs and EpiLCs and Dppa3KO ESCs. c DPPA3 and TET proteins promote demethylation of largely similar targets. Venn Diagram depicting the overlap of hypermethylated sites among T1CM, T2CM, T12CM, and Dppa3KO ESCs. d Dppa3 protects mostly repeats from hypermethylation. Fraction of hypermethylated genomic elements classified as TET-specific (only hypermethylated in TET mutant ESCs), DPPA3-specific (only hypermethylated in Dppa3KO ESCs), or common (hypermethylated in TET mutant and Dppa3KO ESCs). e Gene ontology (GO) terms associated with promoters specifically dependent on TET activity; adjusted p-values calculated using a two-sided Fisher’s exact test followed by Benjamini-Hochberg correction for multiple testing. f TET activity remains unaffected in Dppa3KO ESCs. DNA modification levels for 5-methylcytosine (5mC) and 5-hydroxymethylcytosine (5hmC) as measured by mass spectrometry (LC-MS/MS) in wt (n = 24), T1CM (n = 8), T2CM (n = 12), T12CM (n = 11), Dppa3KO (n = 12) mESC biological replicates. g Dppa3 expression can rescue the hypermethylation in TET mutant ESCs. DNA methylation levels at LINE-1 elements (%) as measured by bisulfite sequencing 0, 3, or 6 days after doxycycline (dox) induction of Dppa3 expression using n = 2 replicates per condition. The dashed red line indicates the median methylation level of wt ESCs. In the boxplots in (af and g), horizontal black lines within boxes represent median values, boxes indicate the upper and lower quartiles, and whiskers extend to the most extreme value within 1.5 x the interquartile range from each hinge. In (a, f, and g), p-values were calculated using Welch’s two-sided t-test: ***p < 2e−16. Source data are provided as a Source Data file.
Fig. 4
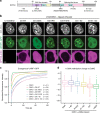
Fig. 4. TET-dependent expression of DPPA3 alters UHRF1 localization and chromatin binding in naïve ESCs.
a Localization of endogenous DPPA3-HALO in live ESCs counterstained with SiR-Hoechst (DNA). Representative result, n ≥ 4. Scale bar: 5 μm. b Volcano plot from DPPA3-FLAG pulldowns in ESCs. Dark gray dots: significantly enriched proteins. Red dots: proteins involved in DNA methylation regulation. Purple dots: proteins involved in nuclear transport. anti-FLAG antibody: n = 3 biological replicates, IgG control antibody: n = 3 biological replicates. Statistical significance determined by performing a Student’s t test with a permutation-based FDR of 0.05 and an additional constant S0 = 1. c FRAP analysis of endogenous UHRF1-GFP. Each genotype comprises the combined single-cell data from two independent clones acquired in two independent experiments. d Localization dynamics of endogenous UHRF1-GFP in response to Dppa3 induction in U1G/D3KO + pSBtet-D3 ESCs with confocal timelapse imaging over 8 h (10 min intervals). t = 0 corresponds to start of Dppa3 induction with doxycycline (+Dox). (top panel) Representative images of UHRF1-GFP and DNA (SiR-Hoechst stain) throughout confocal timelapse imaging. Scale bar: 5 μm. (middle panel) Nucleus to cytoplasm ratio (N/C ratio) of endogenous UHRF1-GFP signal. (bottom panel) Coefficient of variance (CV) of endogenous UHRF1-GFP intensity in the nucleus. (middle and bottom panel) N/C ratio and CV values: measurements in n > 200 single cells per time point (precise values can be found in the Source Data file), acquired at n = 16 separate positions. Curves represent fits of four parameter logistic (4PL) functions to the N/C ratio (pink line) and CV (green line) data. Live-cell imaging was repeated three times with similar results. In (c), the mean fluorescence intensity of n cells (indicated in the plots) at each timepoint are depicted as shaded dots. Error bars indicate mean ± SEM. Curves (solid lines) indicate double-exponential functions fitted to the FRAP data. In the boxplots in (d), darker horizontal lines within boxes represent median values. The limits of the boxes indicate upper and lower quartiles, and whiskers extend to the most extreme value within 1.5 x the interquartile range from each hinge. P-values based on Welch’s two-sided t test. Source data are provided as a Source Data file.
Fig. 5
Fig. 5. DPPA3-mediated demethylation is achieved via inhibition of UHRF1 chromatin binding and attenuated by nuclear export.
a Schematic illustration of murine DPPA3 with the nuclear localization signals (NLS), nuclear export signal (NES), and predicted domains (SAP-like and splicing factor-like) annotated. For the DPPA3 mutant forms used in this study, point mutations are indicated with arrows (∆NES, KRR, R107E) and the two truncations are denoted by the middle break (1–60, left half; 61–150, right half). b, c Nuclear export and the N-terminus of DPPA3 are dispensable for disrupting focal UHRF1 patterning and chromatin binding in ESCs. b Representative confocal images illustrating the localization of endogenous UHRF1-GFP and the indicated mDPPA3-mScarlet fusions in live U1G/D3KO + pSB-D3-mSC ESCs after doxycycline induction. DNA counterstain: SiR-Hoechst. Scale bar: 5 μm. c FRAP analysis of endogenous UHRF1-GFP in U1G/D3KO ESCs expressing the indicated mutant forms of DPPA3. FRAP Curves (solid lines) indicate double-exponential functions fitted to the FRAP data acquired from n cells (shown in the plots). For single-cell FRAP data and additional quantification, see Supplementary Fig. 6d–k. d DPPA3-mediated inhibition of UHRF1 chromatin binding is necessary and sufficient to promote DNA demethylation. Percentage of DNA methylation change at LINE-1 elements (%) in D3KO ESCs after induction of the indicated mutant forms of Dppa3 as measured by bisulfite sequencing of n = 4 biological replicates. In the boxplot in (d), horizontal lines within boxes represent median values, boxes indicate the upper and lower quartiles, whiskers extend to the most extreme value within 1.5 x the interquartile range from each hinge, and dots indicate outliers. Source data are provided as a Source Data file.
Fig. 6
Fig. 6. DPPA3 binds nuclear UHRF1 with high affinity prompting its release from chromatin in naïve ESCs.
a Overview of RICS and ccRICS. Confocal image series are acquired on a laser scanning confocal microscope, containing spatiotemporal fluorescence information on the microsecond and millisecond timescales. A spatial autocorrelation function (SACF) is calculated from the fluorescence image and fit to a diffusive model. The cross-correlation of intensity between two channels is used to estimate the co-occurrence of two fluorescent molecules in live cells. The mean cross-correlation of the fluctuations is calculated and shown in the 3D plot color-coded according to the correlation value. be Representative plots of the spatial cross-correlation function (SCCF) between the depicted fluorescent molecules in cells from each cell line measured: (b) wild-type (U1WT:D3WT) and (c) K85E/R85E/R87E DPPA3 mutant (U1WT:D3KRR), and control ESCs expressing (d) free eGFP, free mScarlet (eGFP + mScarlet) and (e) an eGFP-mScarlet tandem fusion (eGFP-mScarlet). f, g Mobile fraction of (f) mScarlet and (g) eGFP species in the cell lines depicted in (b, c, and e) and in Uhrf1KO ESCs expressing free eGFP and wild-type DPPA3-mScarlet (U1KO:D3WT). The mobile fraction was derived from a two-component model fit of the autocorrelation function. Data are pooled from three (U1WT:D3WT, U1WT:D3KRR) or two (U1KO:D3WT, eGFP-mScar) independent experiments. h Mean cross-correlation values of mobile eGFP and mScarlet measured in the cell lines depicted in (be). The spatial lag in the x-dimension (sensitive to fast fluctuations) is indicated by ξ, and the spatial lag in the y-dimension (sensitive to slower fluctuations) is indicated by ψ. Data are pooled from two independent experiments. i Microscale thermophoresis measurements of UHRF1-eGFP binding to GST-DPPA3 WT (D3WT) or GST-DPPA3 1–60 (D31–60). Error bars indicate the mean ± SEM of n = 2 technical replicates from n = 4 independent experiments. In (fh), each data point represents the measured and fit values from a single cell where n = number of cells measured (indicated in the plots). In the boxplots, darker horizontal lines within boxes represent median values. The limits of the boxes indicate the upper and lower quartiles; the whiskers extend to the most extreme value within 1.5 x the interquartile range from each hinge. Source data are provided as a Source Data file.
Fig. 7
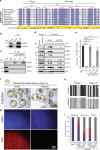
Fig. 7. DPPA3 evolved in boreoeutherian mammals but also functions in lower vertebrates.
a Protein sequence alignment of the PHD domain of the UHRF1 family. b Endogenous xUHRF1 binds mDPPA3. IPs were performed on Xenopus egg extracts incubated with FLAG-mDPPA3 using either a control (Mock) or anti-xUHRF1 antibody and then analyzed by immunoblotting using the indicated antibodies. Representative of n = 3 independent experiments. c GST-tagged mDPPA3 wild-type (WT), point mutant R107E, and truncations (1–60 and 61–150) were immobilized on GSH beads and incubated with Xenopus egg extracts. Bound proteins were analyzed using the indicated antibodies. Representative of n = 3 independent experiments. d Sperm chromatin was incubated with interphase Xenopus egg extracts supplemented with buffer (+buffer) or GST-mDPPA3 (+mDPPA3). Chromatin fractions were isolated and subjected to immunoblotting using the antibodies indicated. Representative of n = 3 independent experiments. e The efficiency of maintenance DNA methylation was assessed by the incorporation of radiolabelled methyl groups from S-[methyl-3H]-adenosyl-L-methionine (3H-SAM) into DNA purified from egg extracts. Disintegrations per minute (DPM). Error bars indicate mean ± SD calculated from n = 4 independent experiments. Depicted p-values based on Welch’s two-sided t-test. f Representative images of developing mid-gastrula stage embryos (control injection) and arrested, blastula stage embryos injected with mDppa3. Injections were performed on one-cell stage embryos and images were acquired ~18 h after fertilization. g Immunofluorescence staining of 5mC in control and mDppa3-injected medaka embryos at the late blastula stage (~8 h after fertilization). Images are representative of n = 3 independent experiments. DNA counterstain: DAPI,4′,6-diamidino-2-phenylindole. h Bisulfite sequencing of two intergenic regions (Region 1: chr20:18,605,227-18,605,449, Region 2: chr20:18,655,561-18,655,825) in control and mDppa3-injected medaka embryos at the late blastula stage. i Percentage of normal, abnormal, or dead medaka embryos. Embryos were injected with wild-type mDppa3 (WT) or mDppa3 R107E (R107E) at two different concentrations (100 ng/µl or 500 ng/µl) or water at the one-cell stage and analyzed ~18 h after fertilization. N = number of embryos from n = 3 independent injection experiments. Source data are provided as a Source Data file.
Fig. 8
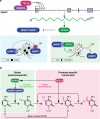
Fig. 8. Recent evolution of a TET-controlled and DPPA3-mediated pathway of DNA demethylation in boreoeutherian mammals.
a In mammals, TET1 and TET2 are recruited by PRDM14 to the promoter of Dppa3 where they promote active DNA demethylation and transcription of Dppa3. In most cellular contexts, high fidelity maintenance DNA methylation is guaranteed by the concerted activities of UHRF1 and DNMT1 at newly replicated DNA. Both the recruitment and activation of DNMT1 critically depend on the binding and ubiquitination of H3 tails by UHRF1. In naïve pluripotent cells, DPPA3 is expressed and inhibits maintenance DNA methylation by directly binding UHRF1 via its PHD domain and releasing it from chromatin. b TET1 and TET2 control DNA methylation levels by two evolutionary and mechanistically distinct pathways. TET-mediated active demethylation regulates focal DNA methylation states e.g. developmental genes and is evolutionarily conserved among vertebrates. The use of TET proteins to promote global demethylation appears to be specific to mammalian pluripotency and mediated by the recently evolved Dppa3.

References

    1. Ladstätter S, Tachibana K. Genomic insights into chromatin reprogramming to totipotency in embryos. J. Cell Biol. 2019;218:70–82. doi: 10.1083/jcb.201807044. - DOI - PMC - PubMed
    1. Warren IA, et al. Evolutionary impact of transposable elements on genomic diversity and lineage-specific innovation in vertebrates. Chromosome Res. 2015;23:505–531. doi: 10.1007/s10577-015-9493-5. - DOI - PubMed
    1. Arkhipova IR. Neutral theory, transposable elements, and eukaryotic genome evolution. Mol. Biol. Evol. 2018;35:1332–1337. doi: 10.1093/molbev/msy083. - DOI - PMC - PubMed
    1. Jacobs FMJ, et al. An evolutionary arms race between KRAB zinc-finger genes ZNF91/93 and SVA/L1 retrotransposons. Nature. 2014;516:242–245. doi: 10.1038/nature13760. - DOI - PMC - PubMed
    1. Friedli M, Trono D. The developmental control of transposable elements and the evolution of higher species. Annu. Rev. Cell Dev. Biol. 2015;31:429–451. doi: 10.1146/annurev-cellbio-100814-125514. - DOI - PubMed

Publication types