

Mapping wind erosion hazard with regression-based machine learning algorithms
- PMID: 33235269
- PMCID: PMC7686346
- DOI: 10.1038/s41598-020-77567-0
Mapping wind erosion hazard with regression-based machine learning algorithms
Abstract
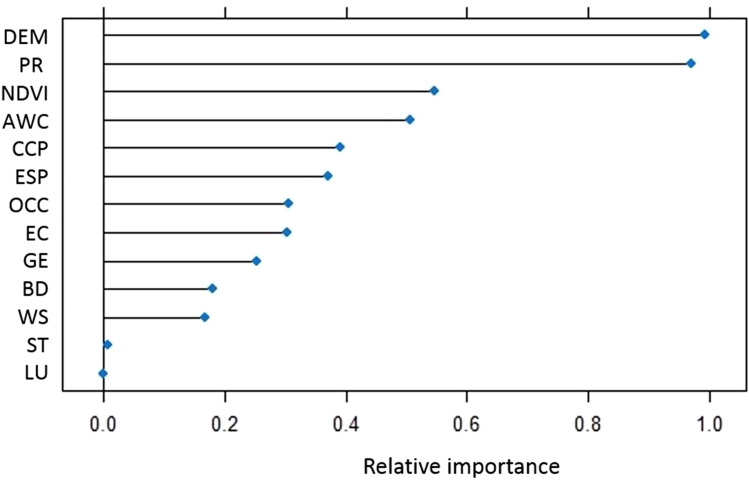
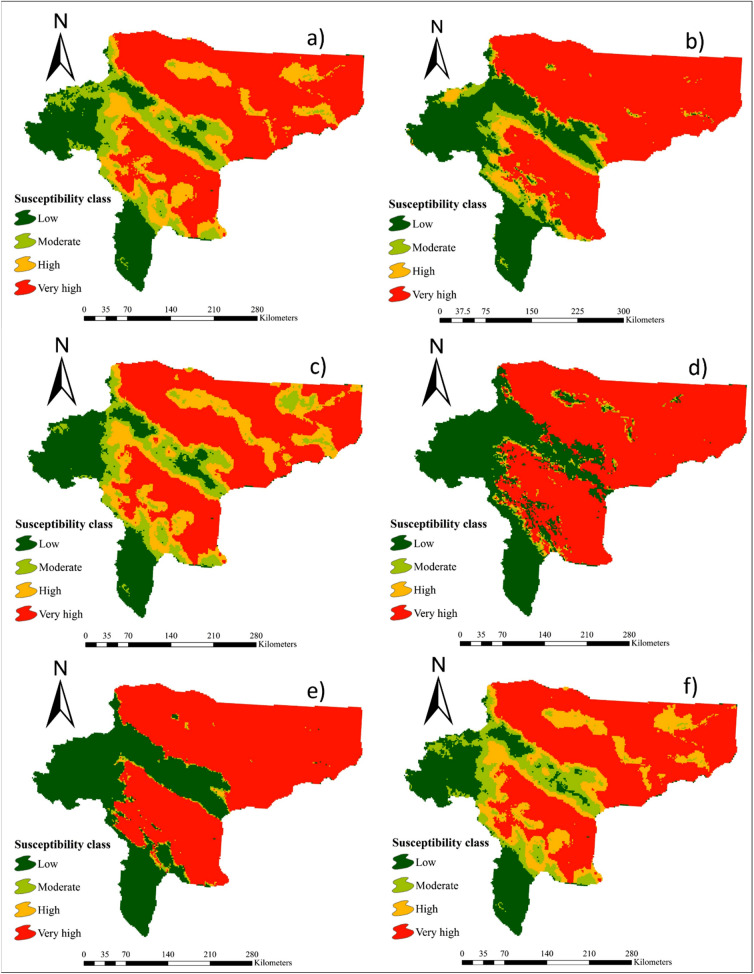
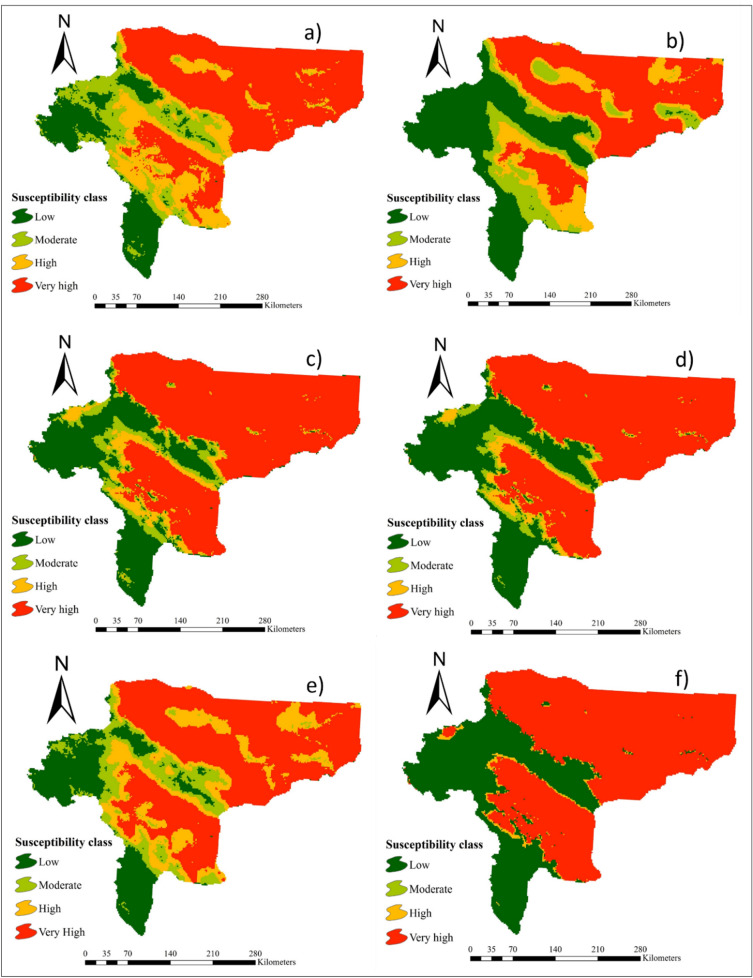
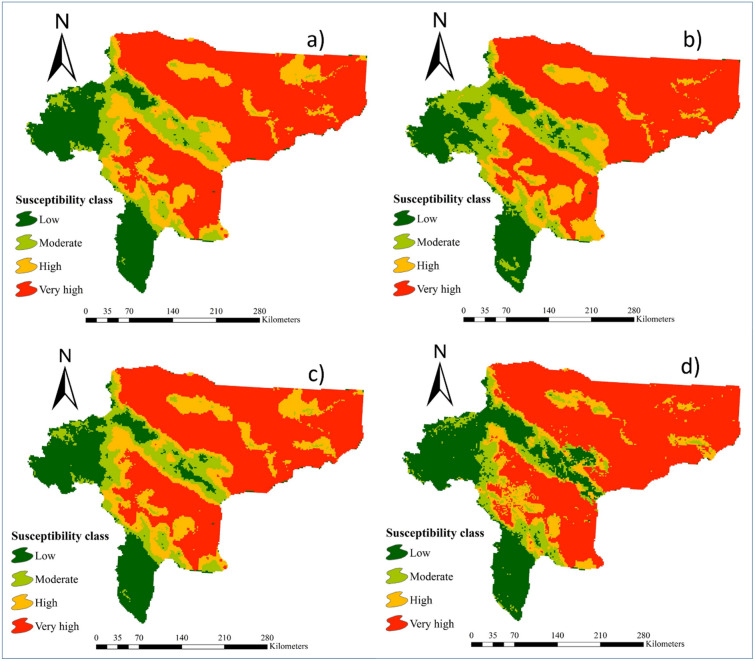
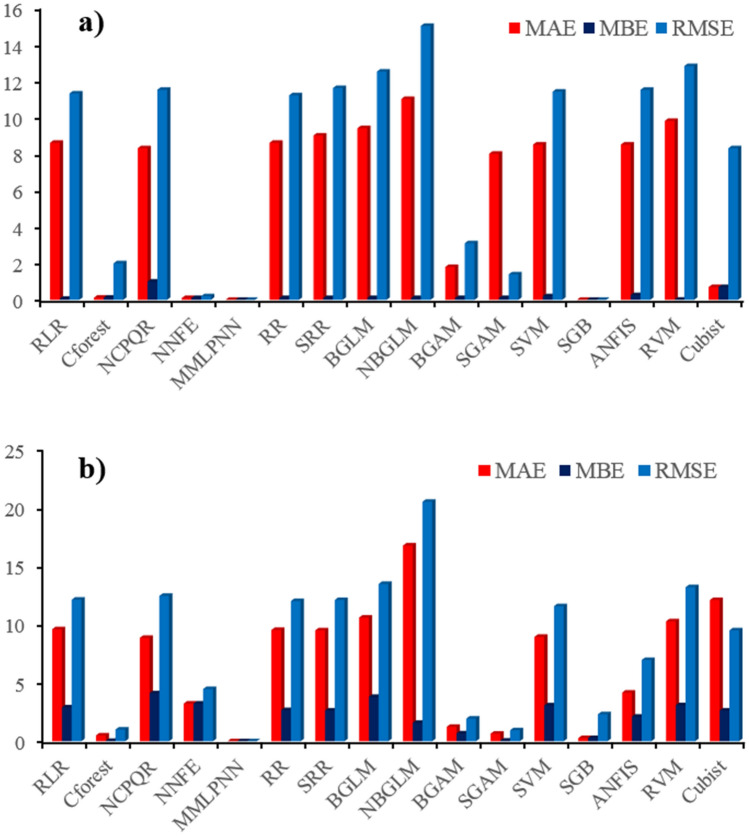
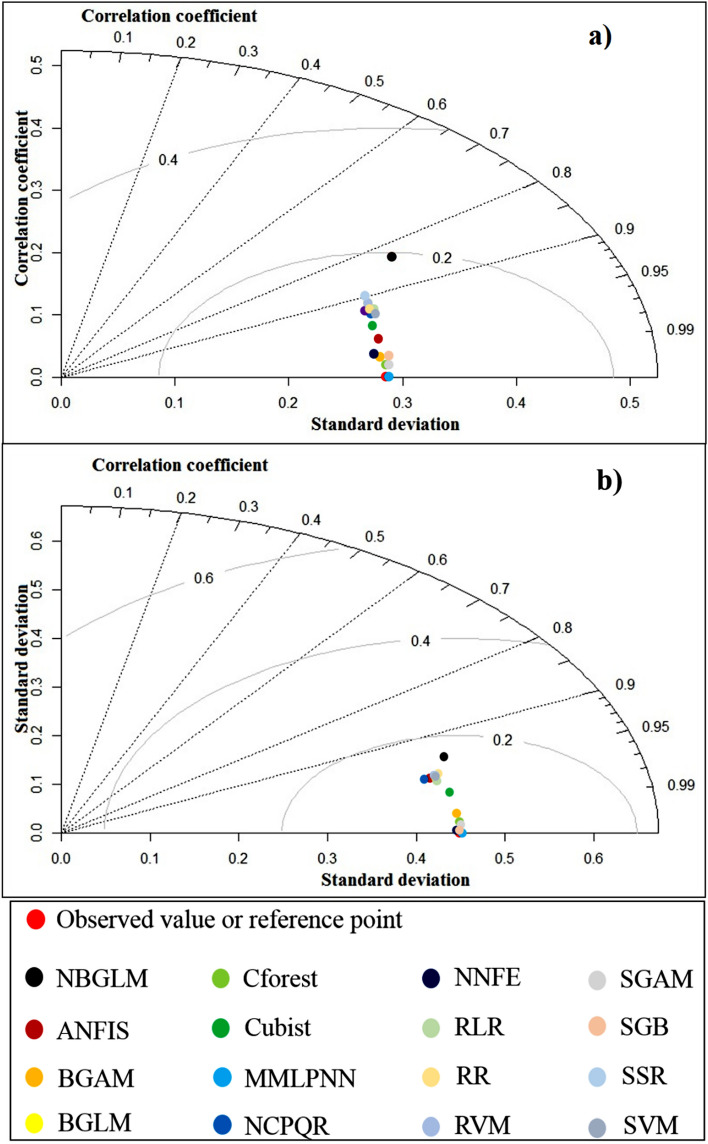
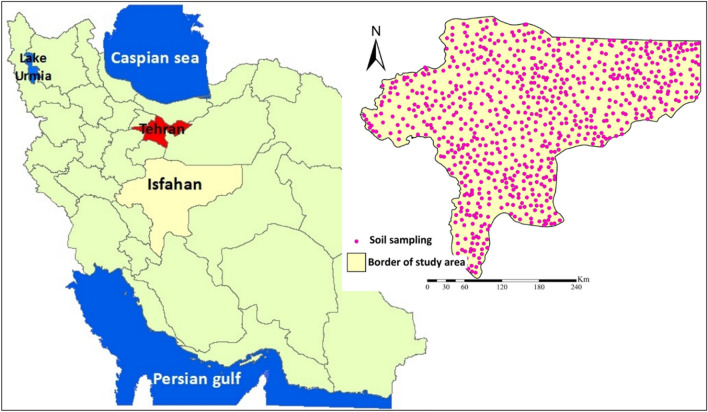
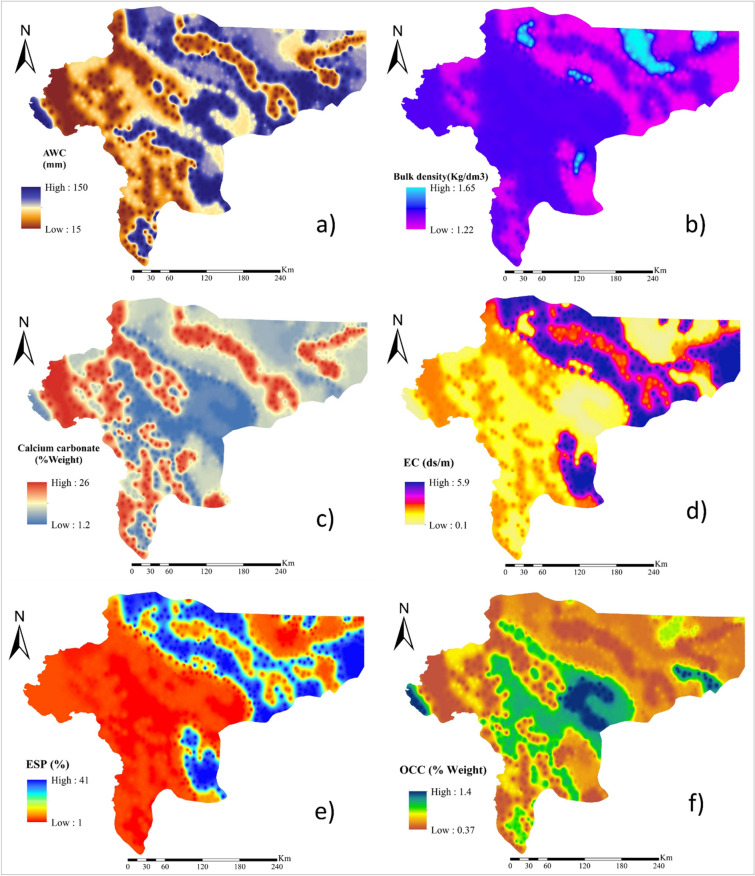
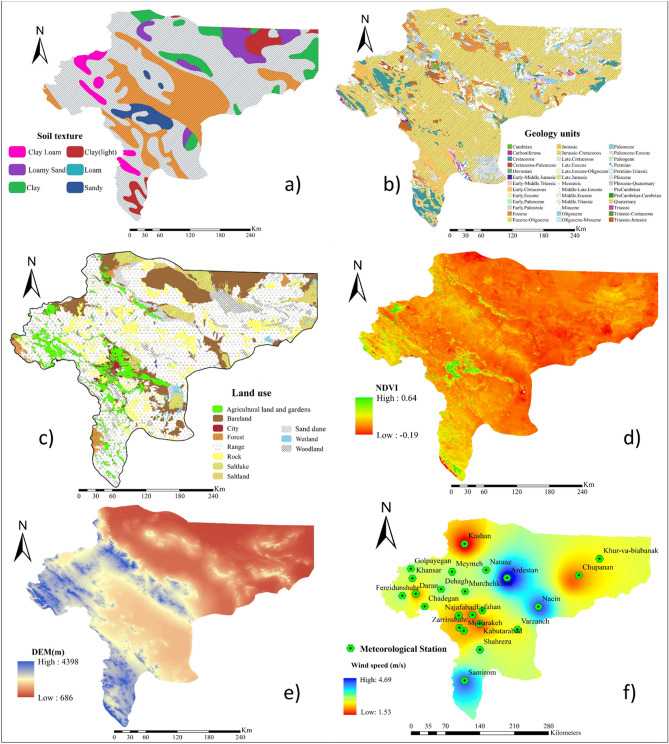
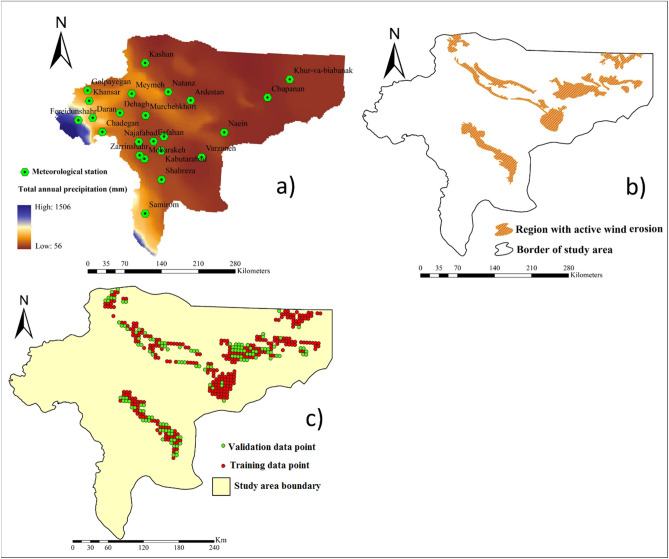
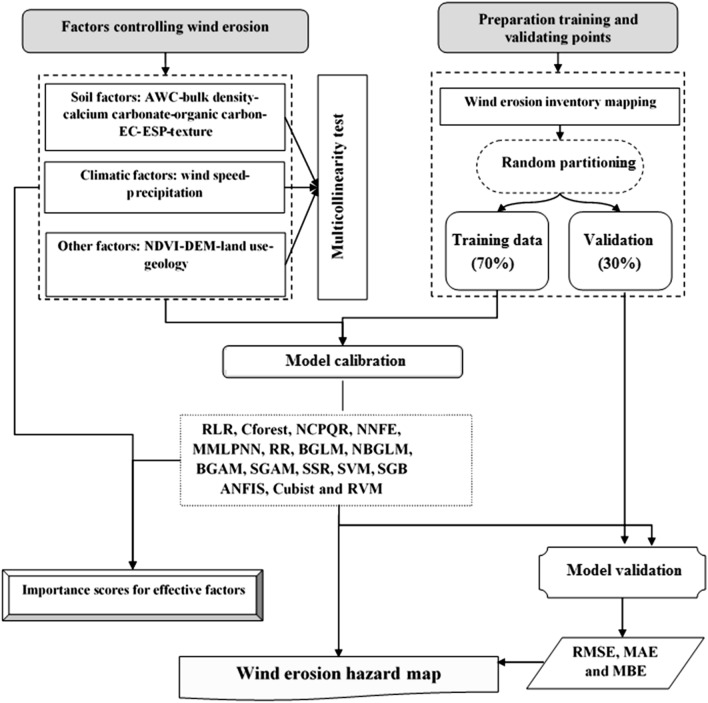
Land susceptibility to wind erosion hazard in Isfahan province, Iran, was mapped by testing 16 advanced regression-based machine learning methods: Robust linear regression (RLR), Cforest, Non-convex penalized quantile regression (NCPQR), Neural network with feature extraction (NNFE), Monotone multi-layer perception neural network (MMLPNN), Ridge regression (RR), Boosting generalized linear model (BGLM), Negative binomial generalized linear model (NBGLM), Boosting generalized additive model (BGAM), Spline generalized additive model (SGAM), Spike and slab regression (SSR), Stochastic gradient boosting (SGB), support vector machine (SVM), Relevance vector machine (RVM) and the Cubist and Adaptive network-based fuzzy inference system (ANFIS). Thirteen factors controlling wind erosion were mapped, and multicollinearity among these factors was quantified using the tolerance coefficient (TC) and variance inflation factor (VIF). Model performance was assessed by RMSE, MAE, MBE, and a Taylor diagram using both training and validation datasets. The result showed that five models (MMLPNN, SGAM, Cforest, BGAM and SGB) are capable of delivering a high prediction accuracy for land susceptibility to wind erosion hazard. DEM, precipitation, and vegetation (NDVI) are the most critical factors controlling wind erosion in the study area. Overall, regression-based machine learning models are efficient techniques for mapping land susceptibility to wind erosion hazards.
Conflict of interest statement
The authors declare no competing interests.
Figures
Similar articles
-
An interpretable (explainable) model based on machine learning and SHAP interpretation technique for mapping wind erosion hazard.Environ Sci Pollut Res Int. 2024 Dec;31(56):64628-64643. doi: 10.1007/s11356-024-35521-x. Epub 2024 Nov 15. Environ Sci Pollut Res Int. 2024. PMID: 39546243
-
An assessment of global land susceptibility to wind erosion based on deep-active learning modelling and interpretation techniques.Sci Rep. 2024 Aug 15;14(1):18951. doi: 10.1038/s41598-024-70125-y. Sci Rep. 2024. PMID: 39147802 Free PMC article.
-
Evaluation of different boosting ensemble machine learning models and novel deep learning and boosting framework for head-cut gully erosion susceptibility.J Environ Manage. 2021 Apr 15;284:112015. doi: 10.1016/j.jenvman.2021.112015. Epub 2021 Jan 28. J Environ Manage. 2021. PMID: 33515838
-
An extensive experimental survey of regression methods.Neural Netw. 2019 Mar;111:11-34. doi: 10.1016/j.neunet.2018.12.010. Epub 2018 Dec 21. Neural Netw. 2019. PMID: 30654138 Review.
-
Machine learning and deep learning methods that use omics data for metastasis prediction.Comput Struct Biotechnol J. 2021 Sep 4;19:5008-5018. doi: 10.1016/j.csbj.2021.09.001. eCollection 2021. Comput Struct Biotechnol J. 2021. PMID: 34589181 Free PMC article. Review.
Cited by
-
Application of smart technologies for predicting soil erosion patterns.Sci Rep. 2025 Jul 21;15(1):26479. doi: 10.1038/s41598-025-12125-0. Sci Rep. 2025. PMID: 40691718 Free PMC article.
-
Hybrid system model for wind abrasion segmentation using semi-automatic classification of remote sensing multispectral areas.Heliyon. 2023 Sep 3;9(9):e19655. doi: 10.1016/j.heliyon.2023.e19655. eCollection 2023 Sep. Heliyon. 2023. PMID: 37809392 Free PMC article.
-
Challenges in data-driven geospatial modeling for environmental research and practice.Nat Commun. 2024 Dec 19;15(1):10700. doi: 10.1038/s41467-024-55240-8. Nat Commun. 2024. PMID: 39702456 Free PMC article. Review.
-
Mapping the EORTC QLQ-C30 and QLQ-LC13 to the SF-6D utility index in patients with lung cancer using machine learning and traditional regression methods.Health Qual Life Outcomes. 2025 Jul 1;23(1):66. doi: 10.1186/s12955-025-02394-8. Health Qual Life Outcomes. 2025. PMID: 40597342 Free PMC article.
References
-
- Prospero JM, Ginoux P, Torres O, Nicholson SE, Gill TE. Environmental characterization of global sources of atmospheric soil dust identified with the Nimbus 7 Total Ozone Mapping Spectrometer (TOMS) absorbing aerosol product. Rev. Geophys. 2002;40(1):1–31. doi: 10.1029/2000RG000095. - DOI
-
- Goossens D. On-site and off-site effects of wind erosion. In: Warren A, editor. Wind Erosion on Agricultural Land in Europe. European Commission: Luxembourg; 2003. pp. 29–38.
-
- Dahmardeh Behrooz, R., Gholami, H., Telfer, M. W., Jansen, J. D. & Fathabadi, A. Uisng GLUE to pull apart the provenance of atmospheric dust. Aeolian Res.37, 1–13 (2019).
Publication types
Grants and funding
LinkOut - more resources
Full Text Sources
