. 2020 Nov 24;10(1):20435.
doi: 10.1038/s41598-020-76982-7.

Characterization of dysregulated glutamine metabolism in human glioma tissue with 1H NMR

Affiliations

Characterization of dysregulated glutamine metabolism in human glioma tissue with 1H NMR

Selin Ekici et al. Sci Rep. .

Abstract

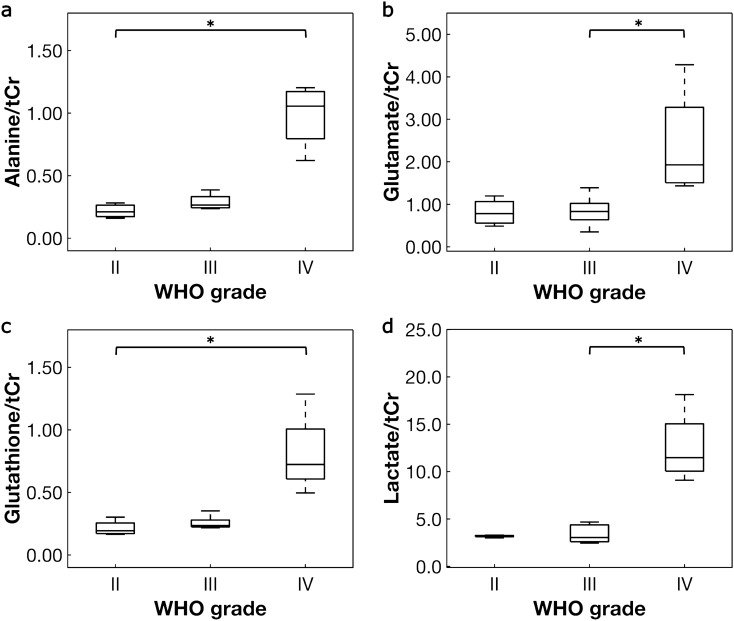
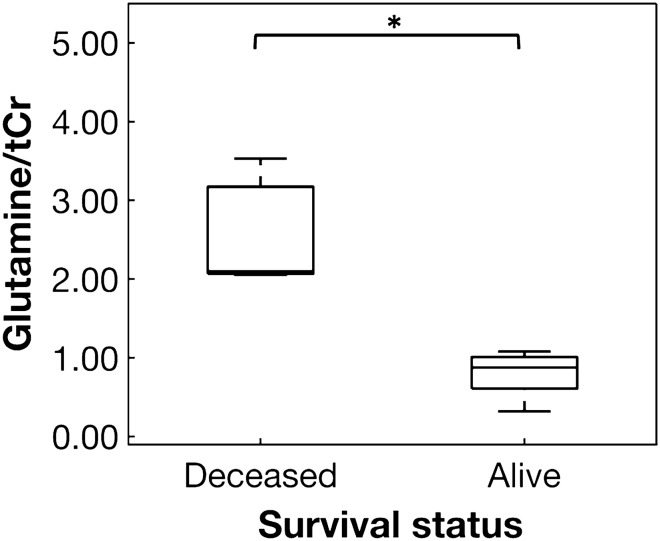
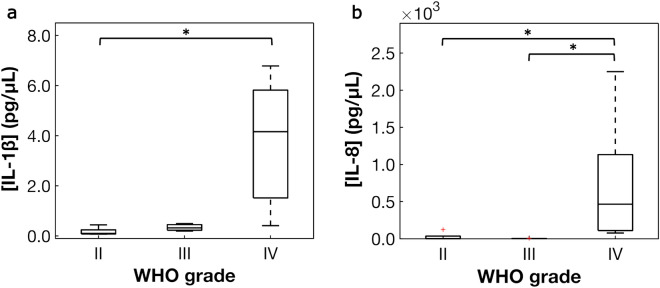
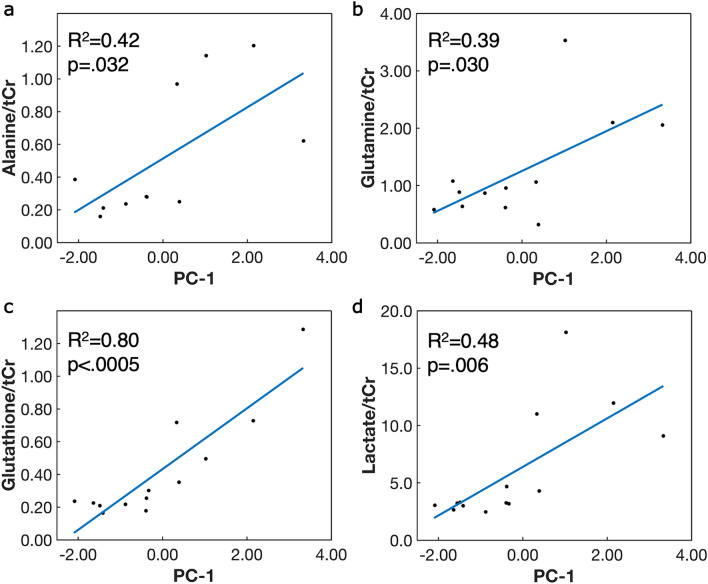
Gliomas are one of the most common types of brain tumors. Given low survival and high treatment resistance rates, particularly for high grade gliomas, there is a need for specific biomarkers that can be used to stratify patients for therapy and monitor treatment response. Recent work has demonstrated that metabolic reprogramming, often mediated by inflammation, can lead to an upregulation of glutamine as an energy source for cancer cells. As a result, glutamine pathways are an emerging pharmacologic target. The goal of this pilot study was to characterize changes in glutamine metabolism and inflammation in human glioma samples and explore the use of glutamine as a potential biomarker. 1H high-resolution magic angle spinning nuclear magnetic resonance spectra were acquired from ex vivo glioma tissue (n = 16, grades II-IV) to quantify metabolite concentrations. Tumor inflammatory markers were quantified using electrochemiluminescence assays. Glutamate, glutathione, lactate, and alanine, as well as interleukin (IL)-1β and IL-8, increased significantly in samples from grade IV gliomas compared to grades II and III (p ≤ .05). Following dimension reduction of the inflammatory markers using probabilistic principal component analysis, we observed that glutamine, alanine, glutathione, and lactate were positively associated with the first inflammatory marker principal component. Our findings support the hypothesis that glutamine may be a key marker for glioma progression and indicate that inflammation is associated with changes in glutamine metabolism. These results motivate further in vivo investigation of glutamine as a biomarker for tumor progression and treatment response.


Conflict of interest statement

The authors declare no competing interests.

Figures

Figure 1
Figure 1
Box plots of tumor metabolites that varied significantly as a function of WHO grade. Metabolites in glioma samples were quantified using 1H HRMAS NMR. Differences as a function of WHO grade were assessed with Kruskal–Wallis H-tests and post-hoc pair-wise Dunn’s tests (Table 2). A Bonferroni correction was applied to the p value of the Dunn’s test to correct for multiple comparisons within each metabolite. Metabolites that varied significantly in post-hoc analysis include (a) alanine, (b) glutamate, (c) glutathione, and (d) lactate. Metabolite concentrations were normalized to creatine + phosphocreatine (tCr). *Denotes significance at p ≤ .05.
Figure 2
Figure 2
Glutamine concentration varied significantly as a function of survival status. Glutamine concentration was significantly higher in deceased versus alive patients when assessed with a Mann–Whitney U-test (p = .012). Glutamine was normalized to creatine + phosphocreatine (tCr). *Denotes significance at p ≤ .05.
Figure 3
Figure 3
Box plots of inflammatory markers that varied significantly as a function of WHO grade. Inflammatory markers in glioma samples were quantified using electrochemiluminescence assays. Differences as a function of WHO grade were assessed with Kruskal–Wallis H-tests and post-hoc pair-wise Dunn’s tests (Table 3). A Bonferroni correction was applied to the p value of the Dunn’s test to correct for multiple comparisons within each inflammatory marker. Significant differences were observed for (a) IL-1β, and (b) IL-8. *Denotes significance at p ≤ .05.
Figure 4
Figure 4
Significant associations between tumor metabolite concentrations and inflammatory marker principal component-1 (PC-1). PC-1 contains contributions primarily from interleukin (IL)-1α, IL-1β, and IL-8. Solid black circles represent raw data and blue line is the linear least-squares regression. Significant positive associations were observed between (a) alanine, (b) glutamine, (c) glutathione, and (d) lactate with inflammatory marker PC-1. Metabolites were normalized to creatine + phosphocreatine (tCr). Significance was determined by p ≤ .05.

References

    1. Weller M, et al. Glioma. Nat. Rev. Dis. Primers. 2015;1:15017. doi: 10.1038/nrdp.2015.17. - DOI - PubMed
    1. Ostrom QT, et al. CBTRUS statistical report: primary brain and other central mervous system tumors diagnosed in the united states in 2012–2016. Neuro Oncol. 2019;21:v1–v100. doi: 10.1093/neuonc/noz150. - DOI - PMC - PubMed
    1. Suzuki H, et al. Mutational landscape and clonal architecture in grade II and III gliomas. Nat. Genet. 2015;47:458–468. doi: 10.1038/ng.3273. - DOI - PubMed
    1. Cloughesy TF, Cavenee WK, Mischel PS. Glioblastoma: from molecular pathology to targeted treatment. Annu. Rev. Pathol. 2014;9:1–25. doi: 10.1146/annurev-pathol-011110-130324. - DOI - PubMed
    1. Upadhyay N, Waldman AD. Conventional MRI evaluation of gliomas. Br. J. Radiol. 2011;84:S107–S111. doi: 10.1259/bjr/65711810. - DOI - PMC - PubMed

Publication types