. 2020 Nov 24;10(1):20485.
doi: 10.1038/s41598-020-77588-9.

The frequency of follicular T helper cells differs in acute and chronic neuroinflammation

Affiliations

The frequency of follicular T helper cells differs in acute and chronic neuroinflammation

Adalie Baniahmad et al. Sci Rep. .

Abstract

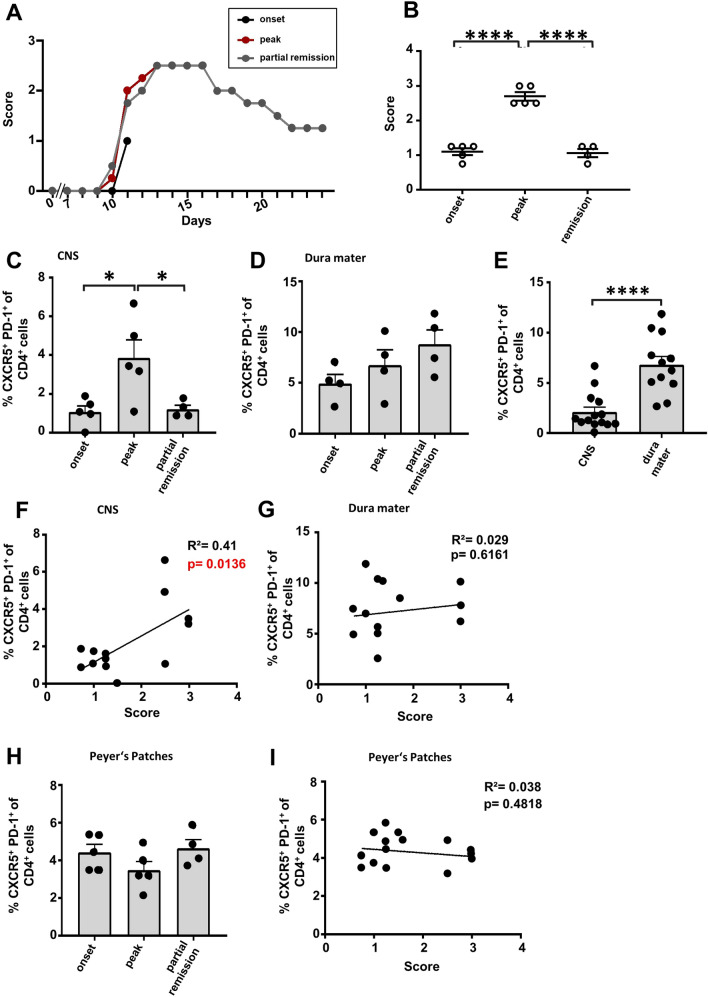
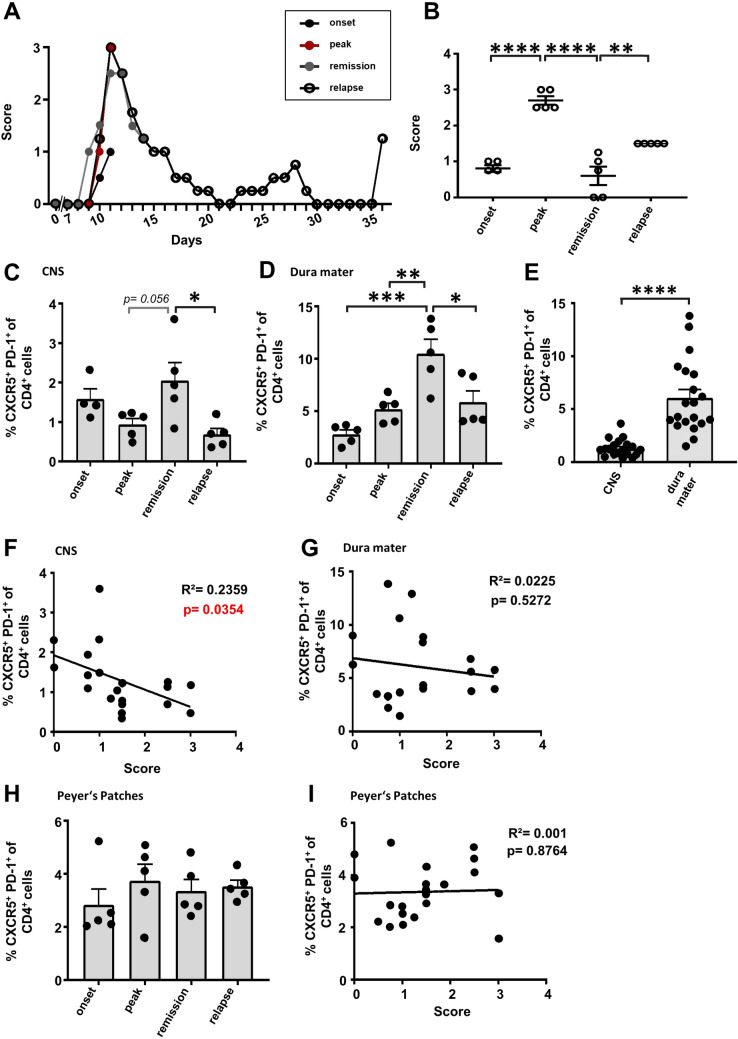
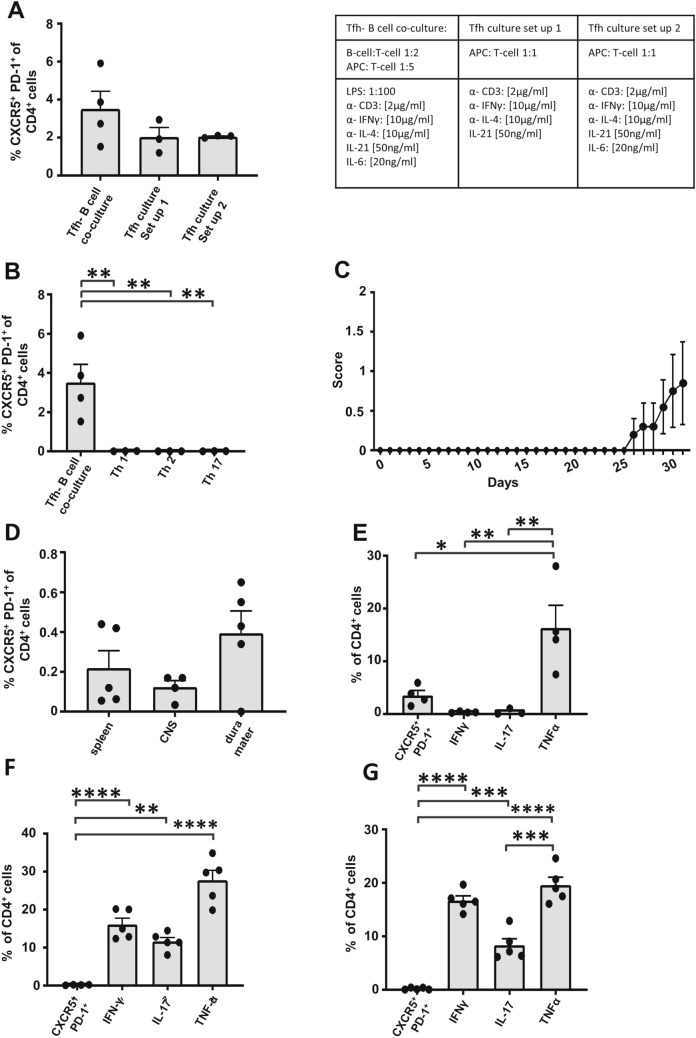
Beyond the major role of T cells in the pathogenesis of the autoimmune neuroinflammatory disorder multiple sclerosis (MS), recent studies have highlighted the impact of B cells on pathogenic inflammatory processes. Follicular T helper cells (Tfh) are essential for the promotion of B cell-driven immune responses. However, their role in MS and its murine model, experimental autoimmune encephalomyelitis (EAE), is poorly investigated. A first step to achieving a better understanding of the contribution of Tfh cells to the disease is the consideration of Tfh cell localization in relation to genetic background and EAE induction method. Here, we investigated the Tfh cell distribution during disease progression in disease relevant organs in three different EAE models. An increase of Tfh frequency in the central nervous system (CNS) was observed during peak of C57BL/6 J EAE, paralleling chronic disease activity, whereas in relapsing-remitting SJL EAE mice Tfh cell frequencies were increased during remission. Furthermore, transferred Tfh-skewed cells polarized in vitro induced mild clinical symptoms in B6.Rag1-/- mice. We identified significantly higher levels of Tfh cells in the dura mater than in the CNS both in C57BL/6 and in SJL/J mice. Overall, our study emphasizes diverse, non-static roles of Tfh cells during autoimmune neuroinflammation.


Conflict of interest statement

The authors declare no competing interests.

Figures

Figure 1
Figure 1
Tfh cell dynamics in C57BL/6 EAE. EAE was induced in C57BL/6 mice via MOG35-55 peptide immunization. (A) EAE course mimicking chronic disease progression, each stage represented by the disease progress of one exemplary mouse. Disease onset (dpi 10–12), peak (dpi 12–16) and partial remission (dpi 22–24) were defined dependent on the EAE course. The mean clinical score was compared between these different disease stages (B). (CE) Percentage of Tfh cells (CXCR5 + PD-1 +) among T cells (living CD4+CD3+CD11bCD45.2+ lymphocytes) were compared via FACS between the defined disease stages in the CNS (C) and dura mater (D). In addition, pooled Tfh frequencies from different time points (onset, peak, partial remission) of CNS and dura mater were compared (E). Data shown are mean ± SEM (CE). (F, G) Correlation analysis between the percentage of Tfh cells and the clinical score of the CNS (F) and the dura mater (G). (H ,I) Analysis of the Tfh frequency (H) and the correlation analysis (I) in the Peyer’s patches. Results are representative of two independent experiments. Statistical analysis was performed using one-way ANOVA followed by Tukey’s multiple comparison test (BE, H) or linear regression (F, G, I). *p < 0.05; **p < 0.01; ***p < 0.001; ****p < 0.0001. Onset n = 5, peak n = 5, partial remission n = 4.
Figure 2
Figure 2
Tfh cell dynamics in SJL/J EAE. EAE was induced in SJL/J mice via PLP139-151 peptide immunization. (A) EAE course mimicking relapsing–remitting disease progression, each stage represented by the disease progress of one exemplary mouse. Disease onset (average of dpi: 9–11; score range: 0.5–1.25), peak (average of dpi: 11–13; score range: 2.5–3), remission (average of dpi: 16–17; score range: 0–1.25) and relapse (average of dpi: 34–36, score range: 1–2) of the disease were defined dependent on the EAE course. The mean clinical score was compared between these different disease stages (B). (CE) Percentage of Tfh cells (CXCR5+PD-1+) among T cells (living CD4+CD3+CD11bCD45+ lymphocytes) were compared between the defined disease stages in the CNS (C) and dura mater (D). In addition, pooled Tfh frequencies on different time points (onset, peak, partial remission and relapse) of CNS and dura mater were compared (E). Data shown are mean ± SEM (CE). (F, G) Correlation analysis between the percentage of Tfh cells and the clinical score of the CNS (F) and the dura mater (G). (H, I) Analysis of the Tfh frequency (H) and the correlation analysis (I) in the Peyer’s patches. Results are representative of two independent experiments. Statistical analysis was performed using one-way ANOVA followed by Tukey’s multiple comparison test (BE, H) or linear regression (F, G, I). *p < 0.05; **p < 0.01; ***p < 0.001; ****p < 0.0001. Onset n = 4, peak n = 5, remission n = 5, relapse n = 5.
Figure 3
Figure 3
Transfer of in vitro cultured Tfh cells into Rag1−/− mice. (A) Tfh cells were cultured in vitro under different conditions: Tfh-B cell co-culture with a B cell-T cell ratio of 1:2 and a CD90 splenocytes—T-cell ratio of 1:5 in the presence of 2 µg/ml anti-CD3, 20 ng/ml IL-6, 50 ng/ml IL-20, 10 µg/ml anti-IL-4 and 10 µg/ml anti-IFNγ. Two different set ups of Tfh culture with a T-cell- CD90 splenocytes ratio of 1:1 in presence of a similar cytokine mix. Set-up 1 in the absence of IL-6, set-up 2 in the presence of 20 ng/ml IL-6. (B) Flow cytometric analysis of Tfh cells (CXCR5+ PD-1+ of CD4+ cell) in Th1, Th2 and Th17 cultures in comparison to the Tfh-B cell co-culture. (C) EAE disease course of B6.Rag1-/- mice intravenously treated with 5 × 106 of the above described in vitro Tfh-skewed cell cultures (4% Tfh positive) per mouse. (D) Flow cytometric analysis of Tfh cell population in the spleen, the CNS and the dura mater was performed on dpi 31. (CG) Analysis of the cytokine production (IFNγ, IL-17 and TNFα) and CXCR5+ PD-1+ expression of CD4+ lymphocytes in the in vitro Tfh culture on the day of transfer (E), compared to the lymphocytes CNS (F) and the spleen (G) of B6.Rag1−/− EAE mice on dpi 31, n = 5. Statistical analysis was performed using one-way ANOVA followed by Tukey’s multiple comparison test (A, B ,DG). *p < 0.05; **p < 0.01; ***p < 0.001; ****p < 0.0001. Tfh-B cell co culture n = 4, Tfh culture version 1 n = 3, Tfh culture version 2 n = 3, Th1 culture n = 3, Th2 culture n = 3, Th17 culture n = 3. Data shown are mean ± SEM.

Similar articles

Cited by

References

    1. Lassmann H, Bruck W, Lucchinetti CF. The immunopathology of multiple sclerosis: an overview. Brain Pathol. 2007;17:210–218. doi: 10.1111/j.1750-3639.2007.00064.x. - DOI - PMC - PubMed
    1. International Multiple Sclerosis Genetics Consortium et al. Genetic risk and a primary role for cell-mediated immune mechanisms in multiple sclerosis. Nature476, 214–219 (2011). - PMC - PubMed
    1. Komiyama Y, et al. IL-17 plays an important role in the development of experimental autoimmune encephalomyelitis. J. Immunol. 2006;177:566–573. doi: 10.4049/jimmunol.177.1.566. - DOI - PubMed
    1. Langrish CL, et al. IL-23 drives a pathogenic T cell population that induces autoimmune inflammation. J. Exp. Med. 2005;201:233–240. doi: 10.1084/jem.20041257. - DOI - PMC - PubMed
    1. Mulero P, Midaglia L, Montalban X. Ocrelizumab: a new milestone in multiple sclerosis therapy. Ther. Adv. Neurol. Disord. 2018;11:1756286418773025. doi: 10.1177/1756286418773025. - DOI - PMC - PubMed

Publication types

MeSH terms