. 2020 Nov 24;10(1):20434.
doi: 10.1038/s41598-020-77417-z.

The microbiota of farmed mink (Neovison vison) follows a successional development and is affected by early life antibiotic exposure

Affiliations

The microbiota of farmed mink (Neovison vison) follows a successional development and is affected by early life antibiotic exposure

Martin Iain Bahl et al. Sci Rep. .

Abstract

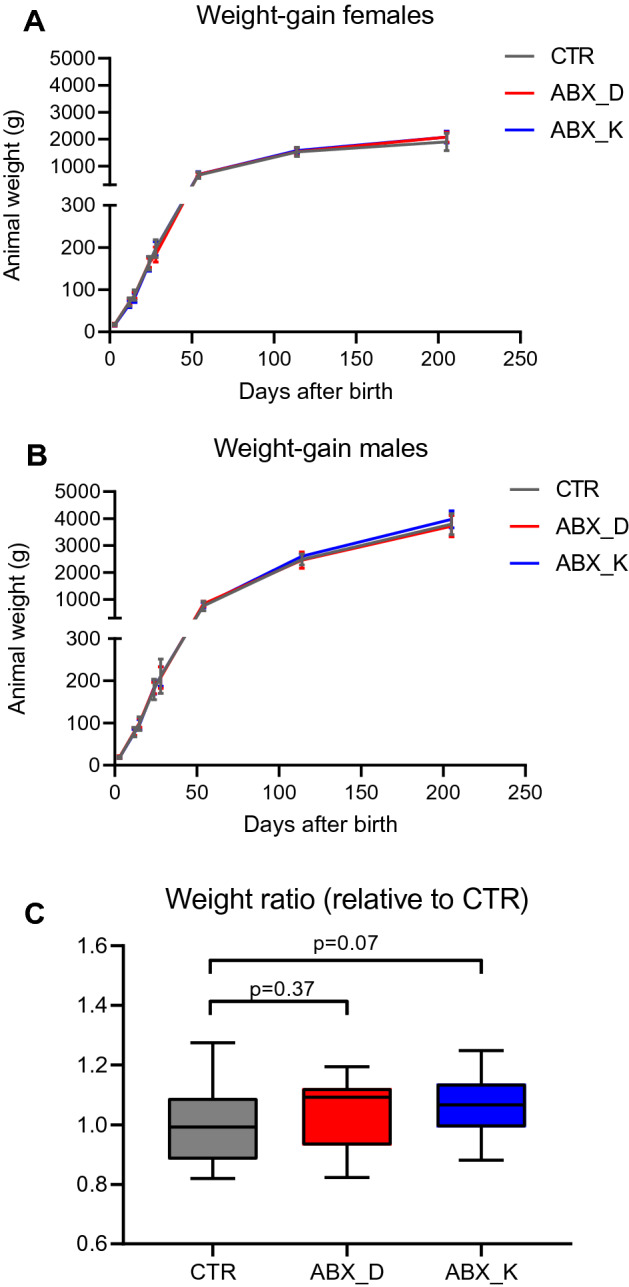
On many mink farms, antibiotics are used extensively during the lactation period to reduce the prevalence and severity of pre-weaning diarrhoea (PWD) in mink kits (also referred to as greasy kit syndrome). Concerns have been raised, that routine treatment of PWD with antibiotics could affect the natural successional development of the gut microbiota, which may have long lasting consequences. Here we investigated the effects of early life antibiotic treatment administered for 1 week (postnatal days 13-20). Two routes of antibiotic administration were compared to a non-treated control group (CTR, n = 24). Routes of administration included indirect treatment, through the milk from dams receiving antibiotics by intramuscular administration (ABX_D, n = 24) and direct treatment by intramuscular administration to the kits (ABX_K, n = 24). A tendency for slightly increased weight at termination (Day 205) was observed in the ABX_K group. The gut microbiota composition was profiled by 16S rRNA gene sequencing at eight time points between Day 7 and Day 205. A clear successional development of the gut microbiota composition was observed and both treatment regimens caused detectable changes in the gut microbiota until at least eight days after treatment ceased. At termination, a significant positive correlation was identified between microbial diversity and animal weight.


Conflict of interest statement

The authors declare no competing interests.

Figures

Figure 1
Figure 1
Experimental design. Coloured bars represent CTR (grey), ABX_D (red) and ABX_K (blue) groups with treatment period highlighted (yellow). Recording of weight and sampling of feed and intestinal contents was performed at the time-points indicated. Only animals that survived until Day 205 were included in the analysis.
Figure 2
Figure 2
Animal weight gain. (A,B) The mean animal weight for female (A) and male (B) mink kits within each treatment group shown as a function of time (days after birth). Error bars indicate standard error of means. (C) Box-plot showing the weight ratio of animals in the ABX_D and ABX_K groups compared to the average weight of animals of the same sex in the CTR group on Day 205. The horizontal line shows the median value and whisker indicate total range. Differences between antibiotic treatment groups and the CTR group were assessed using Student’s t-test with p-values indicated.
Figure 3
Figure 3
Temporal development of microbiota in mink kits and effect of early life antibiotic exposure. (A) Alpha diversity shown as Mean Shannon index of faecal samples collected at different time point from animals in the CTR, ABX_D, ABX_K groups. Error bars indicate standard error of means. Differences between antibiotic treatment groups and the CTR group were assessed using Mann–Whitney test with p-values indicated. (B) Beta diversity shown as Principle coordinate analysis (PCoA) based on Bray–Curtis distances of faecal samples collected at different time points from the CTR group as well as feed samples. (C) Bacterial composition in mink kits from the CTR, ABX_D, ABX_K groups at different time points shown as average relative abundance at the genus level. Bacterial genera representing less than 4% on average in any of the groups were aggregated into one category (Other). The different genera are coloured in grades of Blue, Bacilli; Green, Clostridia; Yellow, Fusobacterium, Red, Proteobacteria; Gray, Mollicutes. (D) Heatmap illustrating analysis of similarities (ANOSIM) between indicated groups at the different time points. (E) Principle coordinate analysis (PCoA) based on Bray–Curtis distances of faecal samples collected from groups ABX_D, ABX_K and CTR on Day 18, during the antibiotic treatment period. Colours show groups and different symbols are used to indicate litter. (F) Spearman’s Rank correlation analysis between microbial Shannon index and relative animal weight on Day 205. In panels (A) and (D): *p < 0.05; **p < 0.01; ***p < 0.001; ****p < 0.0001.

References

    1. Kinross JM, Darzi AW, Nicholson JK. Gut microbiome-host interactions in health and disease. Genome Med. 2011;3:14. doi: 10.1186/gm228. - DOI - PMC - PubMed
    1. Stewart CJ, et al. Temporal development of the gut microbiome in early childhood from the TEDDY study. Nature. 2018;562:583–588. doi: 10.1038/s41586-018-0617-x. - DOI - PMC - PubMed
    1. Levy M, Blacher E, Elinav E. Microbiome, metabolites and host immunity. Curr. Opin. Microbiol. 2017;35:8–15. doi: 10.1016/j.mib.2016.10.003. - DOI - PubMed
    1. Kim CH. Immune regulation by microbiome metabolites. Immunology. 2018;154:220–229. doi: 10.1111/imm.12930. - DOI - PMC - PubMed
    1. Cox LM, Blaser MJ. Antibiotics in early life and obesity. Nat. Rev. Endocrinol. 2015;11:182–190. doi: 10.1038/nrendo.2014.210. - DOI - PMC - PubMed

Publication types

MeSH terms