. 2020 Aug 19;6(2):veaa061.
doi: 10.1093/ve/veaa061. eCollection 2020 Jul.

Temporal signal and the phylodynamic threshold of SARS-CoV-2

Affiliations

Temporal signal and the phylodynamic threshold of SARS-CoV-2

Sebastian Duchene et al. Virus Evol. .

Abstract

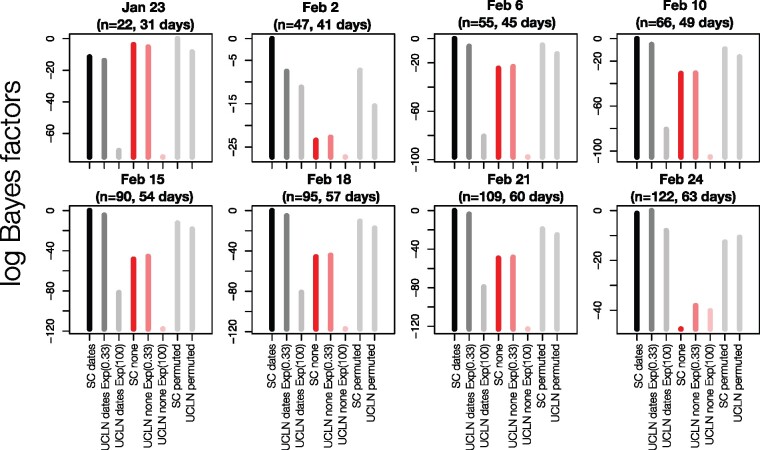
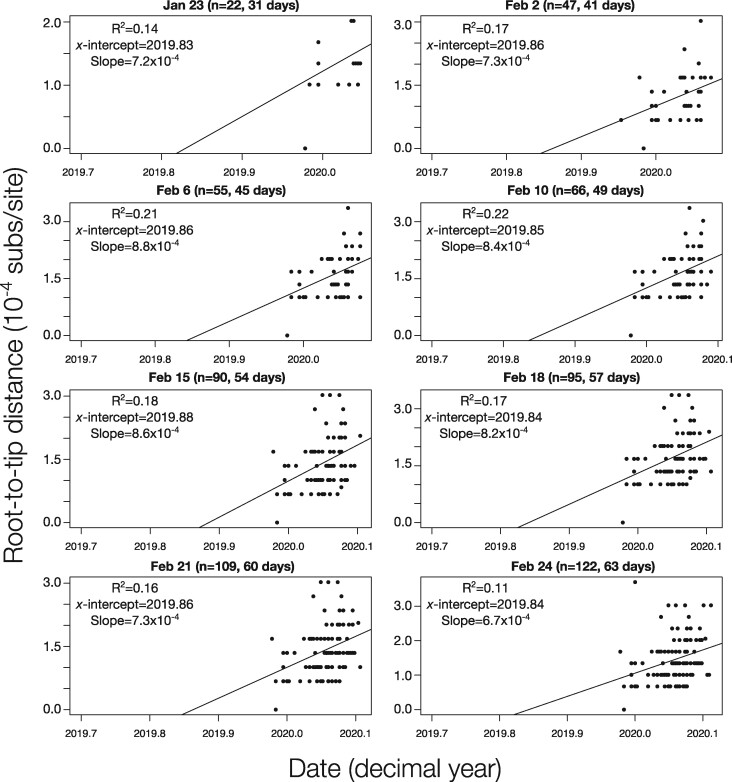
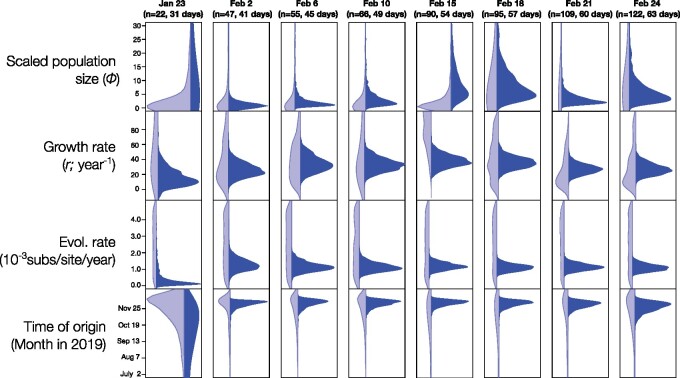
The ongoing SARS-CoV-2 outbreak marks the first time that large amounts of genome sequence data have been generated and made publicly available in near real time. Early analyses of these data revealed low sequence variation, a finding that is consistent with a recently emerging outbreak, but which raises the question of whether such data are sufficiently informative for phylogenetic inferences of evolutionary rates and time scales. The phylodynamic threshold is a key concept that refers to the point in time at which sufficient molecular evolutionary change has accumulated in available genome samples to obtain robust phylodynamic estimates. For example, before the phylodynamic threshold is reached, genomic variation is so low that even large amounts of genome sequences may be insufficient to estimate the virus's evolutionary rate and the time scale of an outbreak. We collected genome sequences of SARS-CoV-2 from public databases at eight different points in time and conducted a range of tests of temporal signal to determine if and when the phylodynamic threshold was reached, and the range of inferences that could be reliably drawn from these data. Our results indicate that by 2 February 2020, estimates of evolutionary rates and time scales had become possible. Analyses of subsequent data sets, that included between 47 and 122 genomes, converged at an evolutionary rate of about 1.1 × 10⁻³ subs/site/year and a time of origin of around late November 2019. Our study provides guidelines to assess the phylodynamic threshold and demonstrates that establishing this threshold constitutes a fundamental step for understanding the power and limitations of early data in outbreak genome surveillance.

Keywords: 2019 novel coronavirus (SARS-CoV-2); molecular clock; phylodynamic threshold; phylogenetics; severe acute respiratory syndrome corona virus 2; temporal signal.


Figures

Figure 1.
Figure 1.
BETS results. Each panel corresponds to a snapshot data set collected up to a given month and day in 2020, with a certain number, n, of genomes, and the number of days since the first genome sample was collected (23 December 2019). The y-axis represents the log Bayes factors, where the best-performing model has a value of 0. Each bar corresponds to an analysis configuration for BETS, with two possible molecular clock models: the strict (SC) and the uncorrelated relaxed clock with an underlying lognormal distribution (UCLN). For the UCLN, we considered two possible priors on the standard deviation of the lognormal distribution: an exponential distribution with mean 0.33 or with mean 100, labelled as Exp(0.33) and Exp(100), respectively. The sampling times could be configured using the true values (dates), no sampling times (none), or permuted, with these latter two options indicating no temporal signal. For the analyses with permuted sampling times and the UCLN, we used an exponential prior with mean 0.33 for the standard deviation of the lognormal distribution. Black and dark grey bars correspond to analyses with the correct sampling times with the SC or UCLN clock models, respectively. Dark and light red bars are for analyses with no sampling times with these two clock models, and all light grey bars are for analyses with permuted sampling times.
Figure 2.
Figure 2.
Root-to-tip regressions for snapshot data sets. The y-axis corresponds to the root-to-tip distance of phylogenetic trees with branch lengths in units of substitutions per site. The x-axis represents calendar time. Each point corresponds to a tip in the tree. The regression line is the best fitting line using the root position that maximised R2. The R2, the intercept with the x-axis (x-intercept), and slope are shown for each data set, with the latter two representing crude estimates of the evolutionary rate and time of origin, respectively.
Figure 3.
Figure 3.
Prior and posterior densities for parameters of interest using the molecular clock model with best fit for all snapshot data set (SC for all data sets, except for 24 February, where the UCLN was chosen). The y-axis corresponds to parameter values, while the x-axis represents the relative density. Light blue densities correspond to the effective prior, while those in dark blue show the posterior.

Similar articles

Cited by

References

    1. Andersen K. G. et al. (2020) ‘The Proximal Origin of SARS-CoV-2’, Nature Medicine, 26: 450–2. - PMC - PubMed
    1. Baele G., Lemey P., Suchard M. A. (2016) ‘Genealogical Working Distributions for Bayesian Model Testing with Phylogenetic Uncertainty’, Systematic Biology, 65: 250–64. - PMC - PubMed
    1. Baele G. et al. (2012) ‘Accurate Model Selection of Relaxed Molecular Clocks in Bayesian Phylogenetics’, Molecular Biology and Evolution, 30: 239–43. - PMC - PubMed
    1. Baele G. et al. (2017) ‘Emerging Concepts of Data Integration in Pathogen Phylodynamics’, Systematic Biology, 66: e47–e65. - PMC - PubMed
    1. Biek R. et al. (2015) ‘Measurably Evolving Pathogens in the Genomic Era’, Trends in Ecology & Evolution, 30: 306–13. - PMC - PubMed