. 2020 Nov 25;17(6):066007.
doi: 10.1088/1741-2552/abbfef.

Decoding spoken English from intracortical electrode arrays in dorsal precentral gyrus

Affiliations

Decoding spoken English from intracortical electrode arrays in dorsal precentral gyrus

Guy H Wilson et al. J Neural Eng. .

Abstract

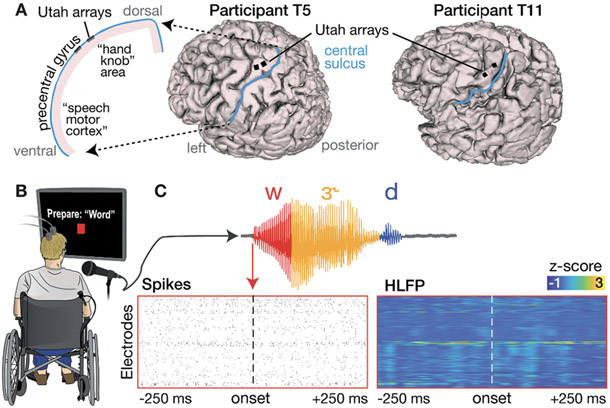
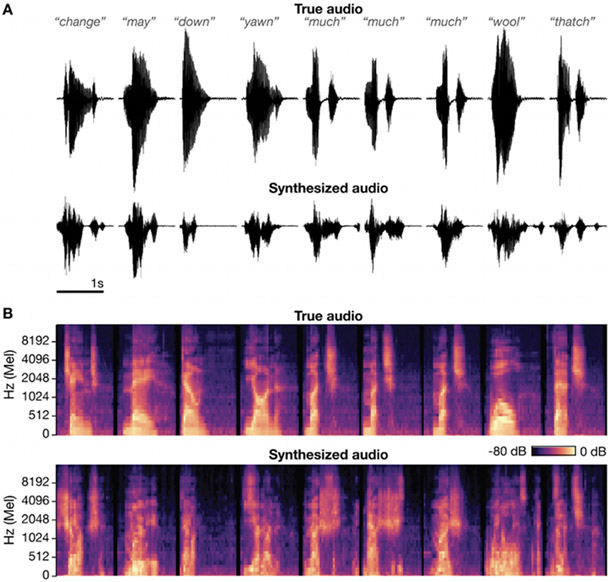
Objective: To evaluate the potential of intracortical electrode array signals for brain-computer interfaces (BCIs) to restore lost speech, we measured the performance of decoders trained to discriminate a comprehensive basis set of 39 English phonemes and to synthesize speech sounds via a neural pattern matching method. We decoded neural correlates of spoken-out-loud words in the 'hand knob' area of precentral gyrus, a step toward the eventual goal of decoding attempted speech from ventral speech areas in patients who are unable to speak.

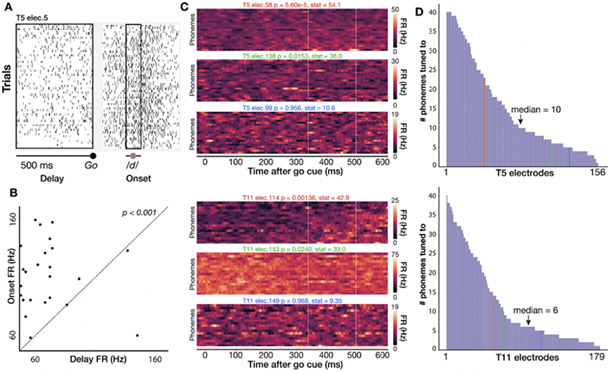
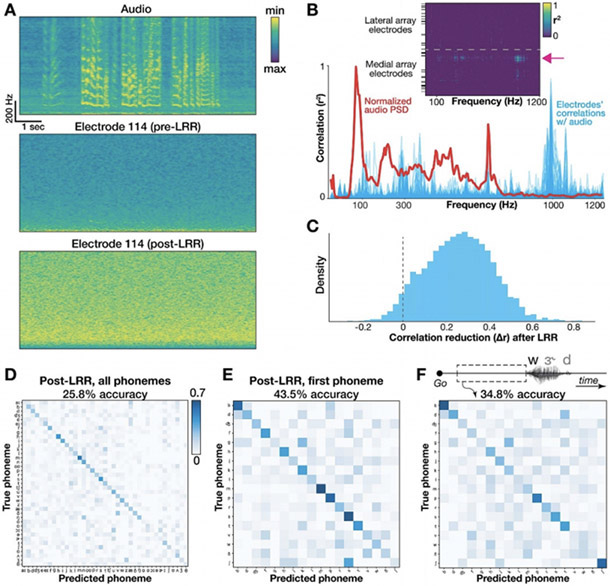
Approach: Neural and audio data were recorded while two BrainGate2 pilot clinical trial participants, each with two chronically-implanted 96-electrode arrays, spoke 420 different words that broadly sampled English phonemes. Phoneme onsets were identified from audio recordings, and their identities were then classified from neural features consisting of each electrode's binned action potential counts or high-frequency local field potential power. Speech synthesis was performed using the 'Brain-to-Speech' pattern matching method. We also examined two potential confounds specific to decoding overt speech: acoustic contamination of neural signals and systematic differences in labeling different phonemes' onset times.

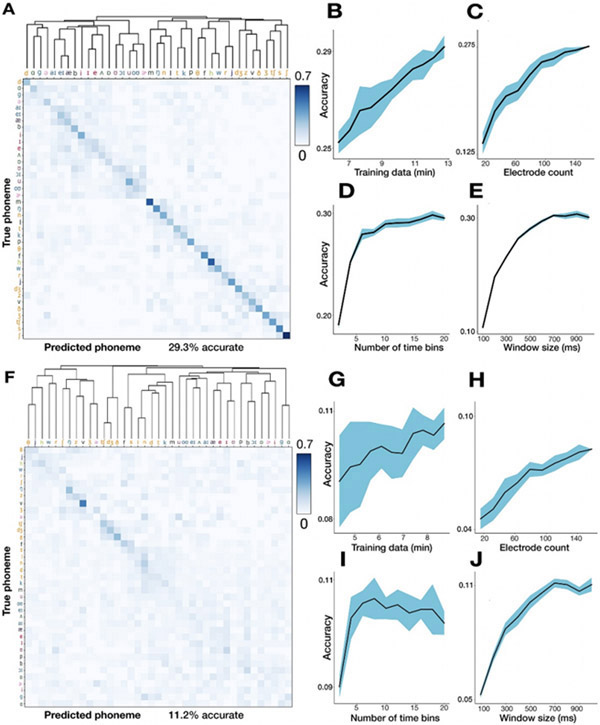
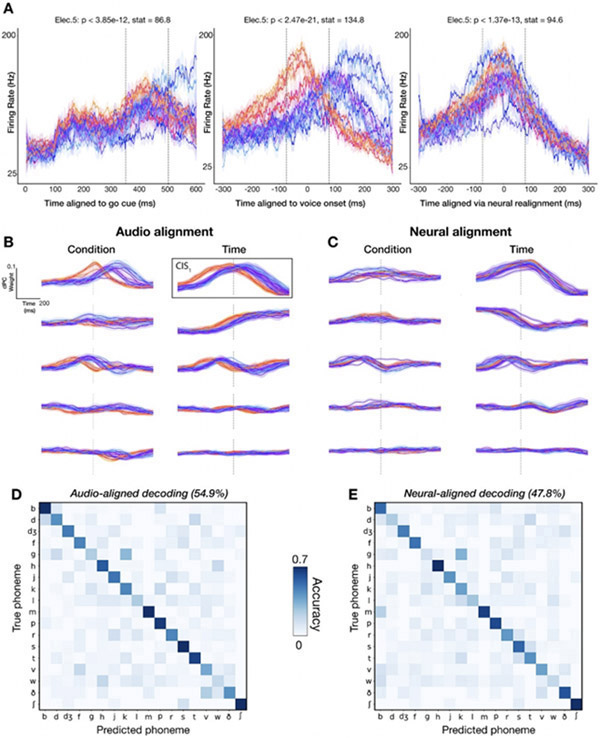
Main results: A linear decoder achieved up to 29.3% classification accuracy (chance = 6%) across 39 phonemes, while an RNN classifier achieved 33.9% accuracy. Parameter sweeps indicated that performance did not saturate when adding more electrodes or more training data, and that accuracy improved when utilizing time-varying structure in the data. Microphonic contamination and phoneme onset differences modestly increased decoding accuracy, but could be mitigated by acoustic artifact subtraction and using a neural speech onset marker, respectively. Speech synthesis achieved r = 0.523 correlation between true and reconstructed audio.

Significance: The ability to decode speech using intracortical electrode array signals from a nontraditional speech area suggests that placing electrode arrays in ventral speech areas is a promising direction for speech BCIs.


Conflict of interest statement

Declaration of interests

The MGH Translational Research Center has a clinical research support agreement with Neuralink, Paradromics, and Synchron, for which L.R.H. provides consultative input. JMH is a consultant for Neuralink Corp and Proteus Biomedical, and serves on the Medical Advisory Board of Enspire DBS. KVS consults for Neuralink Corp. and CTRL-Labs Inc. (part of Facebook Reality Labs) and is on the scientific advisory boards of MIND-X Inc., Inscopix Inc., and Heal Inc. All other authors have no competing interests.

Figures

Figure 1.
Figure 1.
Neural data recorded during a word speaking task. (A) Array placements on 3D reconstructions of each participant’s brain. The left side illustration highlights that we recorded neural correlates of overt speech in a dorsal cortical area that is distinct from the ventral areas where speech production is typically decoded. (B) Illustration of the visually-prompted word speaking task. (C) Example phoneme segmentation of a word from the recorded audio. Below we show threshold crossing spikes and high frequency LFP (HLFP) for a 500 ms window rates centered on voice onset for this utterance of /w/.
Figure 2.
Figure 2.. Individual electrodes show broad tuning across phonemes.
(A) Spike rasters for a single T5 electrode across all instances of /d/ in the full dataset of spoken words. Black boxes show a 500 ms delay period analysis window before the go cue and a 100 ms analysis window centered around voice onset). (B) Scatter plot of firing rates during the delay and onset epochs for the electrode shown in A; each point is one trial. Firing rates are significantly higher around voice onset (two-sided permutation sign test; p<0.001). (C) Three example T5 electrodes (top) and T11 electrodes (bottom) chosen to exemplify high, low, and not significant selectivity between speaking different phones (Kruskal-Wallis across single trial firing rates from 350 to 500 ms after go cue, marked by vertical lines).. The phonemes were sorted by firing rate for each participant’s high tuning example electrode and then kept in the same order for the other two electrodes. (D) Distribution of number of phonemes to which T5’s (top) and T11’s (bottom) electrodes are tuned (i.e., having a significant firing rate difference between delay and onset epochs), sorted from broadest tuning to most narrow tuning. In general, electrodes show a broad tuning profile. Vertical colored lines indicate the corresponding color’s electrode in panel C.
Figure 3.
Figure 3.
Decoding 39 English phonemes and associated hyperparameter sweeps. (A) T5 phoneme decoding confusion matrix, sorted by a hierarchical clustering dendrogram. Values are normalized so that each row adds up to 1. Overall accuracy was 29.3% using leave-one-out cross-validation. Note that the colorbar saturates at 0.7 (to better show the pattern of errors), not 1. Phoneme labels are colored based on their place of articulation group, which is examined further in Supplementary Figure 2. (B-C) Parameter sweeps for training set size (B) and number of electrodes (C). Shading denotes standard deviation across 10 repetitions of 10-fold cross-validation. (D) Creating finer-grained time bins from the overall 500 millisecond window improves performance. For example, twenty time bins (the rightmost point of this plot) means that each electrode contributes twenty bins each averaging HLFP across 25 ms to the overall neural feature vector. (E) Using a larger window (with 50 ms non-overlapping bins) increases performance until saturation around 600 ms. (F-J) same as above for T11 data.
Figure 4:
Figure 4:
Audio-based phoneme onset alignments cause spurious neural variance across phonemes. (A) Firing rate (20 ms bins) of an example electrode across 18 phoneme classes is plotted for distinct alignment strategies (left to right: aligning the same utterances’ data to the go cue, voice onset, and the “neural onset” approach we introduce). Each trace is one phoneme, and shading denotes standard errors. Plosives are shaded with warm colors to illustrate how voice onset alignment systematically biases the alignment of certain phonemes. (B-C) dPCs for phoneme-dependent and phoneme-independent factorizations of neural ensemble firing rates in a 1500 ms window. The top five dPC component projections (sorted by variance explained) are displayed for each marginalization for the audio and neural alignment approaches. (B) dPC projections aligned to voice onset (vertical dotted lines). Plosives (warm colors) have a similar temporal profile to other phonemes (cool colors) except for a temporal offset. This serves as a warning that voice onset alignment may artificially introduce differences between different phonemes’ trial-averaged activities. To compensate for this, we re-aligned data to a neural (rather than audio) anchor: each phoneme’s trial-averaged peak time of the largest condition-invariant component, outlined in black, was used to determine a “neural onset” for neural realignment. (C) Recomputed dPC projections using this CIS1-realigned neural data. Vertical dotted lines show estimated CIS1 peaks. (D) Decoder confusion matrix from predicting the first phoneme in each word using a 500 ms window centered on voice onset. (E) Confusion matrix when classifying the same phoneme utterances, but now using neurally realigned data.
Fig. 5:
Fig. 5:
Quantifying and mitigating acoustic contamination of neural signals. (A) Spectrograms for audio and neural data in the electrode and block exhibiting the strongest audio-neural correlations. Frequencies range from 5 to 1000 Hz. The bottom plot shows the same electrode after LRR “decontamination”. (B) Plot of the mean audio PSD (red) and all electrodes’ Pearson correlations (blue) from the same example block. Inset shows correlation coefficients of individual electrodes (rows) across frequencies (columns). Black horizontal ticks denote electrodes excluded from neural analyses. The pink arrow shows the example electrode from panel A. (C) Change in audio-neural correlations after LRR, pooled across all blocks, electrodes, and frequencies (restricted to electrodes with r2 > 0.1 originally). Values to the right of the dotted ‘0’ line indicate a reduction in correlation strength. The mean audio-neural correlation reduction was 0.26. (D) Full classifier confusion matrix after LRR (25.8% overall accuracy across 39 classes). (E) Confusion matrix for first phoneme decoding after applying LRR. As in D, the classifier used a 500 ms window centered on voice onset. (F) Confusion matrix showing decoding each word’s first phoneme using 500 ms leading up to voice onset to avoid possible audio contamination or neural activity related to auditory feedback.
Fig. 6:
Fig. 6:
Speech synthesis using ‘brain-to-speech’ unit selection. (A) Audio waveforms for the actual words spoken by participant T5 (top) and the synthesized audio reconstructed from neural data (bottom). (B) Corresponding acoustic spectrograms. The correlation coefficient between true and synthesized audio (averaged across all 40 Mel frequency bins) for these 9 good examples was 0.696.

Similar articles

Cited by

References

    1. Abadi Martín, Barham Paul, Chen Jianmin, Chen Zhifeng, Davis Andy, Dean Jeffrey, Devin Matthieu, et al. 2016. “Tensorflow: A System for Large-Scale Machine Learning.” In 12th ${USENIX} Symposium on Operating Systems Design and Implementation ({OSDI}$ 16), 265–83.
    1. Abbott LF, and Dayan P. 1999. “The Effect of Correlated Variability on the Accuracy of a Population Code.” Neural Computation 11 (1): 91–101. - PubMed
    1. Ajiboye A. Bolu, Willett Francis R., Young Daniel R., Memberg William D., Murphy Brian A., Miller Jonathan P., Walter Benjamin L., et al. 2017. “Restoration of Reaching and Grasping Movements through Brain-Controlled Muscle Stimulation in a Person with Tetraplegia: A Proof-of-Concept Demonstration.” The Lancet 389 (10081): 1821–30. - PMC - PubMed
    1. Akbari Hassan, Khalighinejad Bahar, Herrero Jose L., Mehta Ashesh D., and Mesgarani Nima. 2019. “Towards Reconstructing Intelligible Speech from the Human Auditory Cortex.” Scientific Reports 9 (1): 1–12. - PMC - PubMed
    1. Angrick Miguel, Herff Christian, Mugler Emily, Tate Matthew C., Slutzky Marc W., Krusienski Dean J., and Schultz Tanja. 2019. “Speech Synthesis from ECoG Using Densely Connected 3D Convolutional Neural Networks.” Journal of Neural Engineering 16 (3): 036019. - PMC - PubMed

Publication types