. 2021 May;34(5):e4393.
doi: 10.1002/nbm.4393. Epub 2020 Nov 25.

Contribution of macromolecules to brain 1 H MR spectra: Experts' consensus recommendations

Affiliations

Contribution of macromolecules to brain 1 H MR spectra: Experts' consensus recommendations

Cristina Cudalbu et al. NMR Biomed. 2021 May.

Abstract

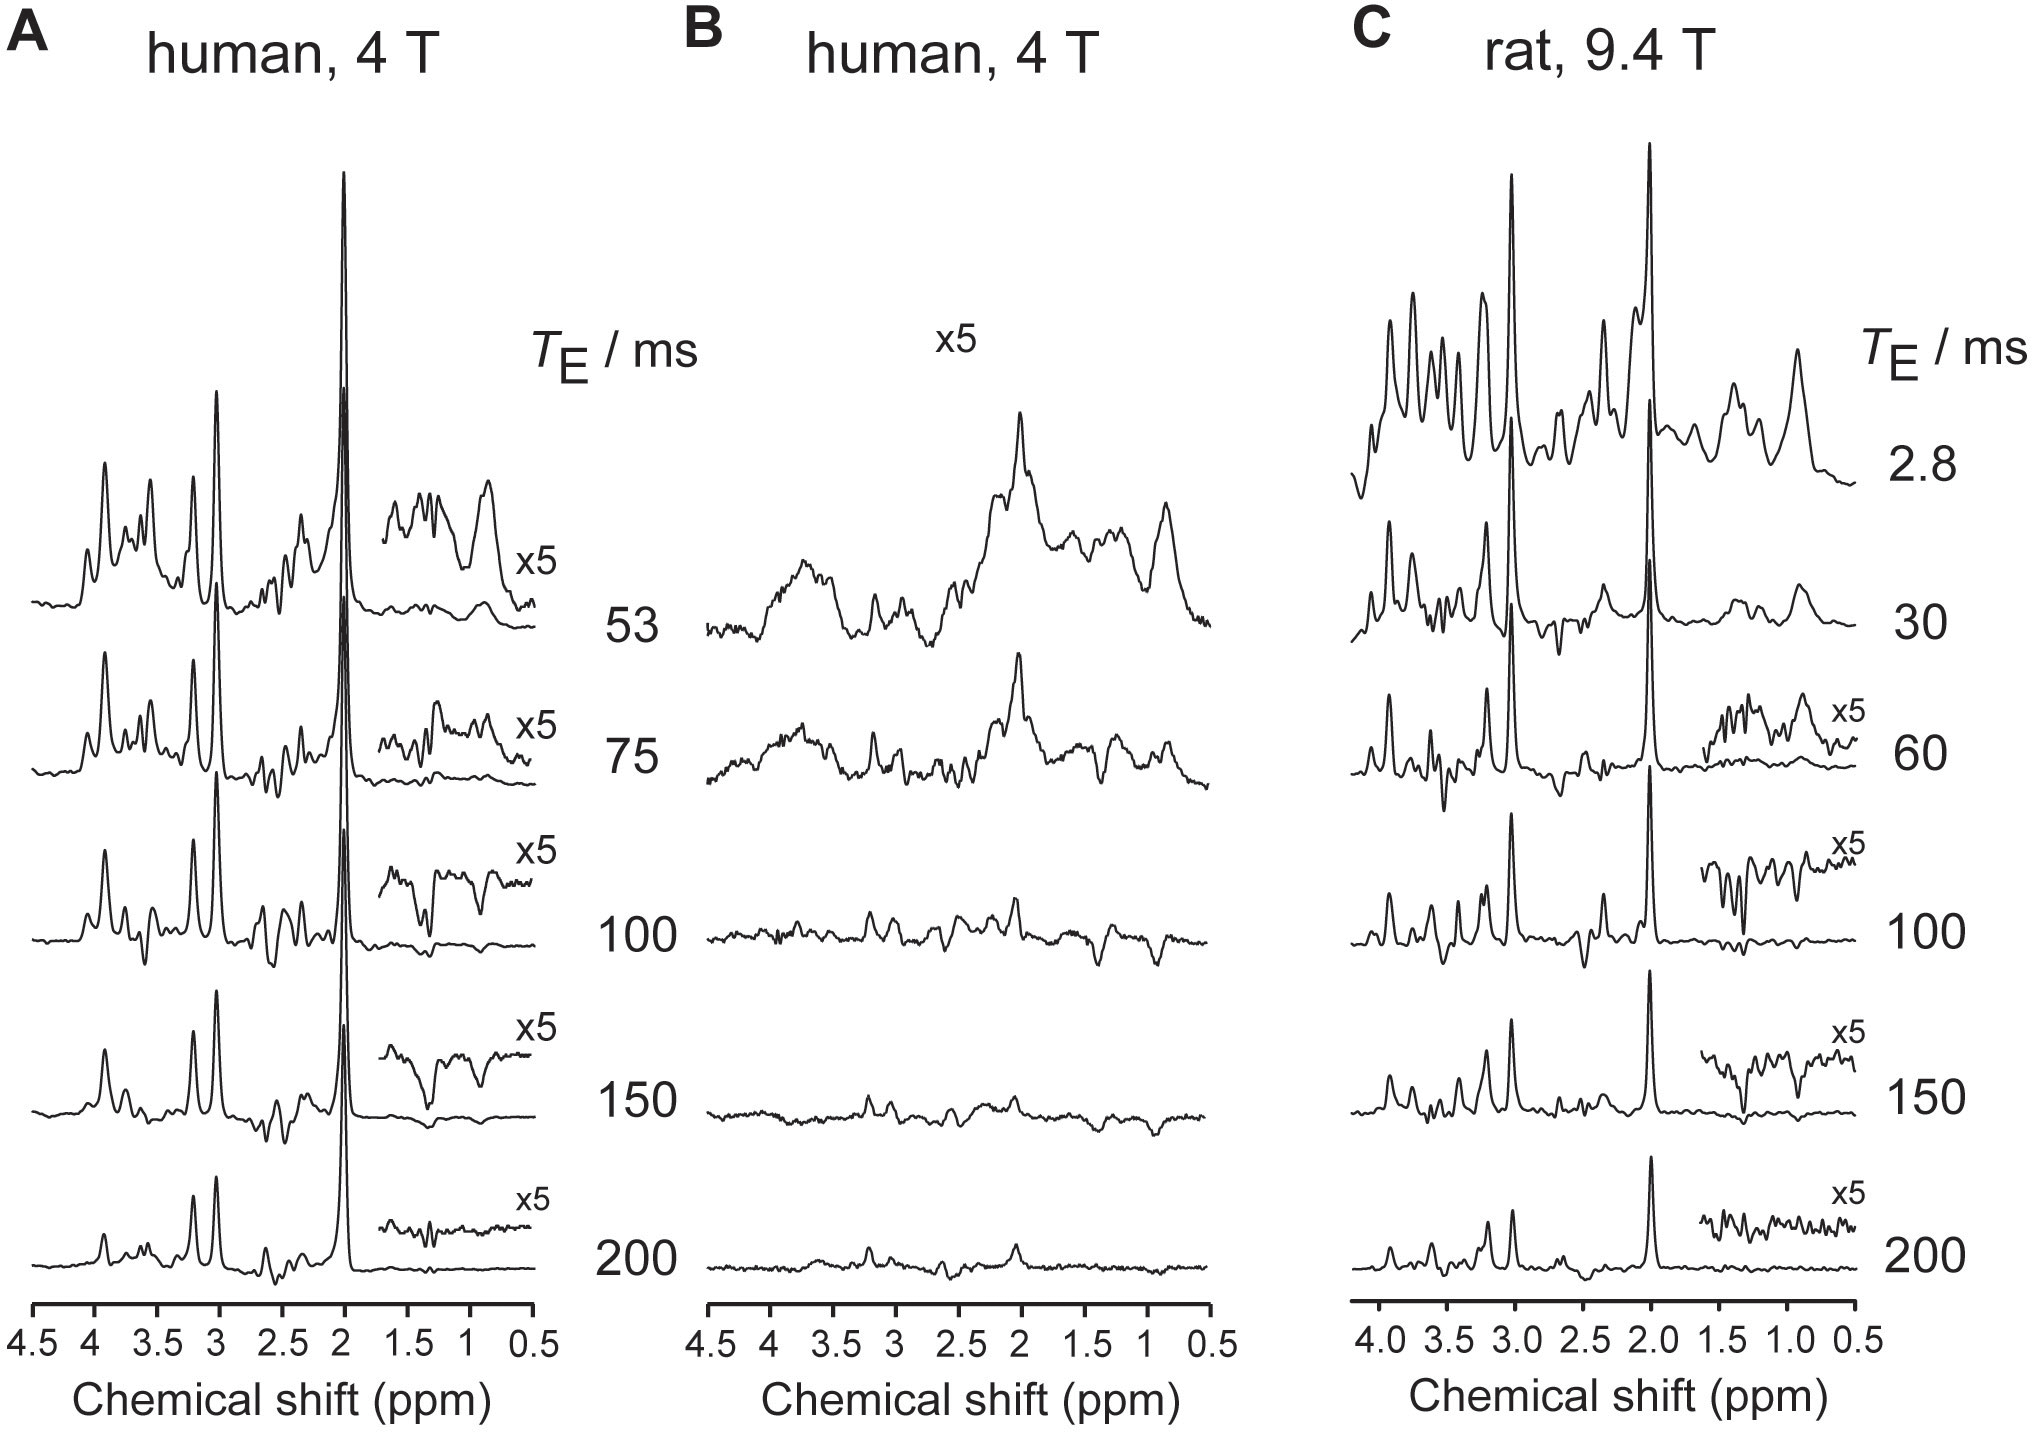
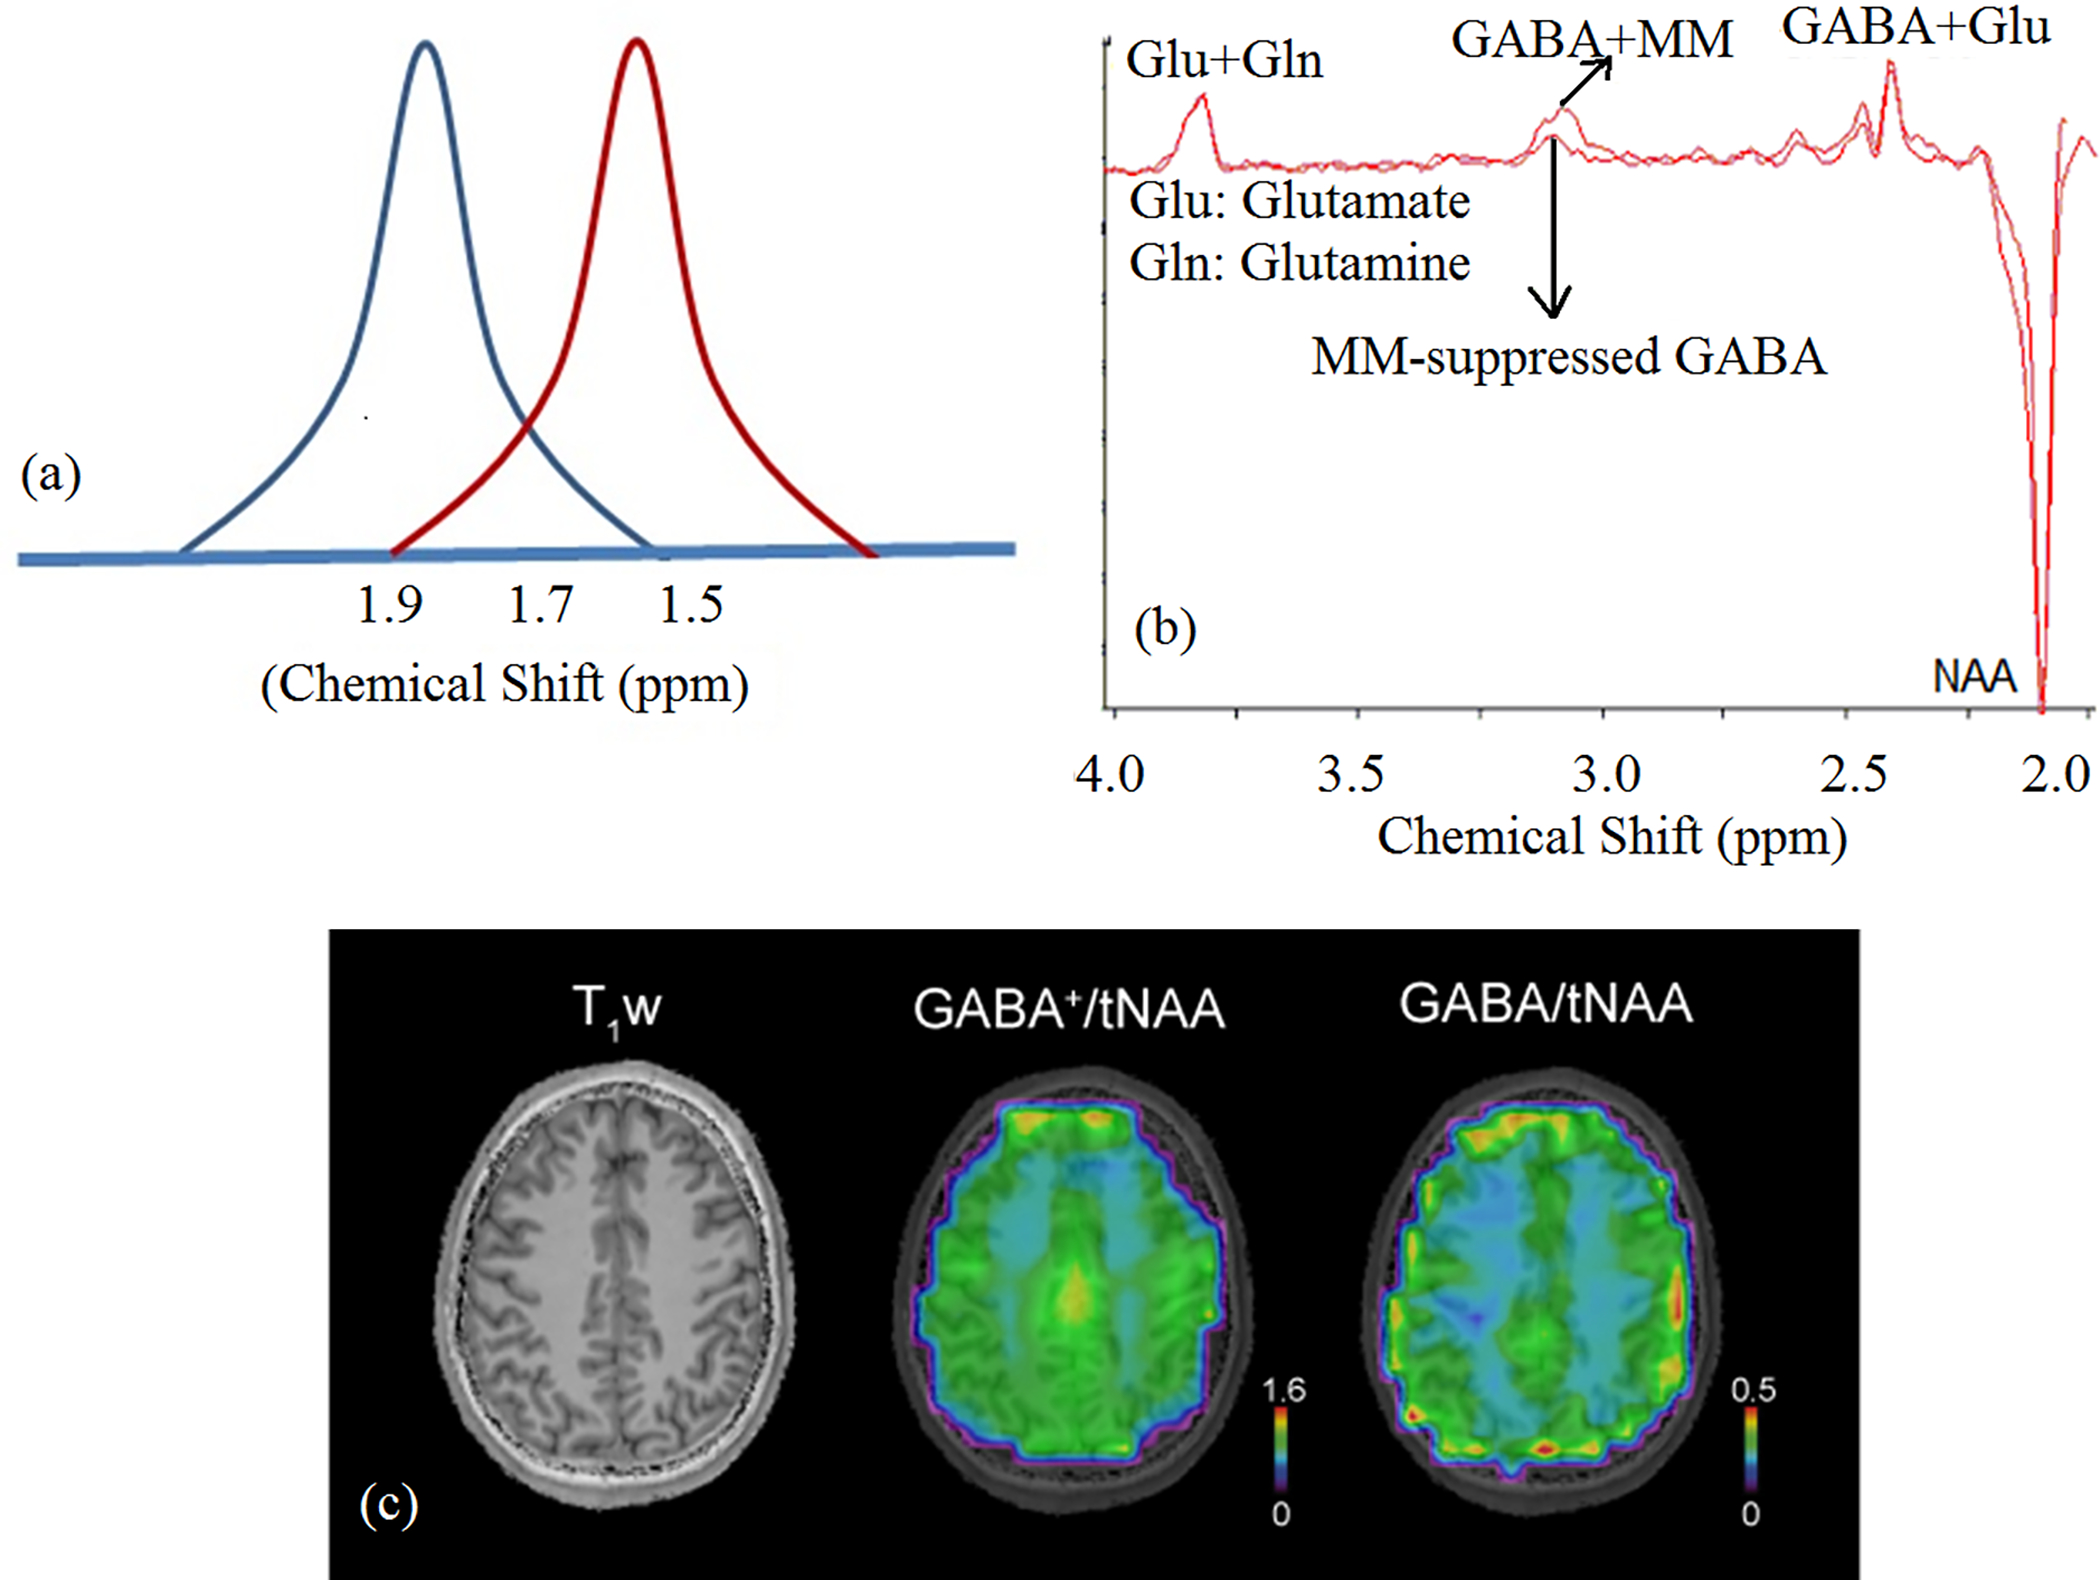
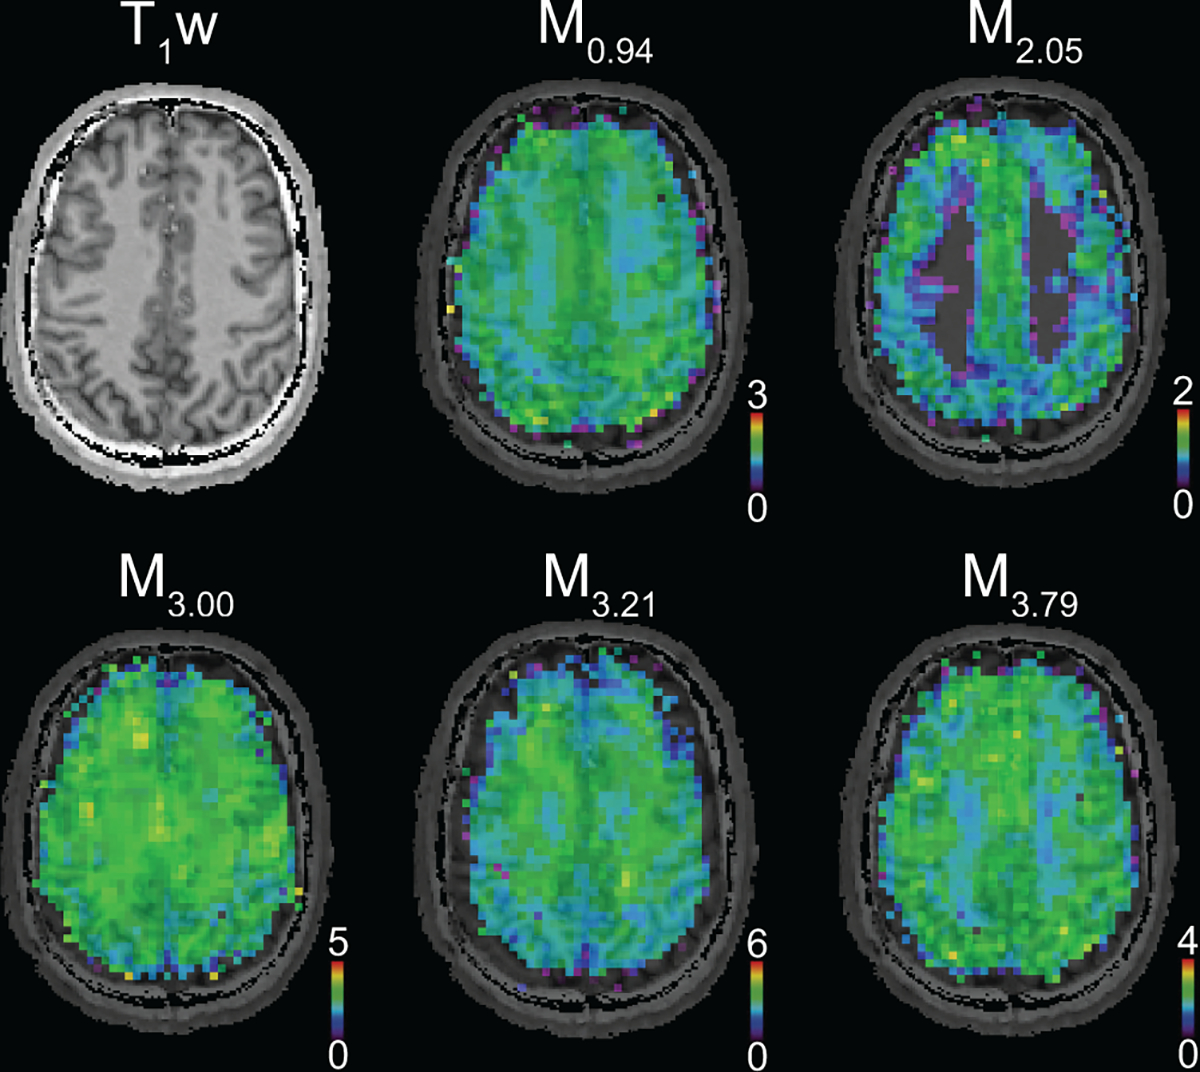
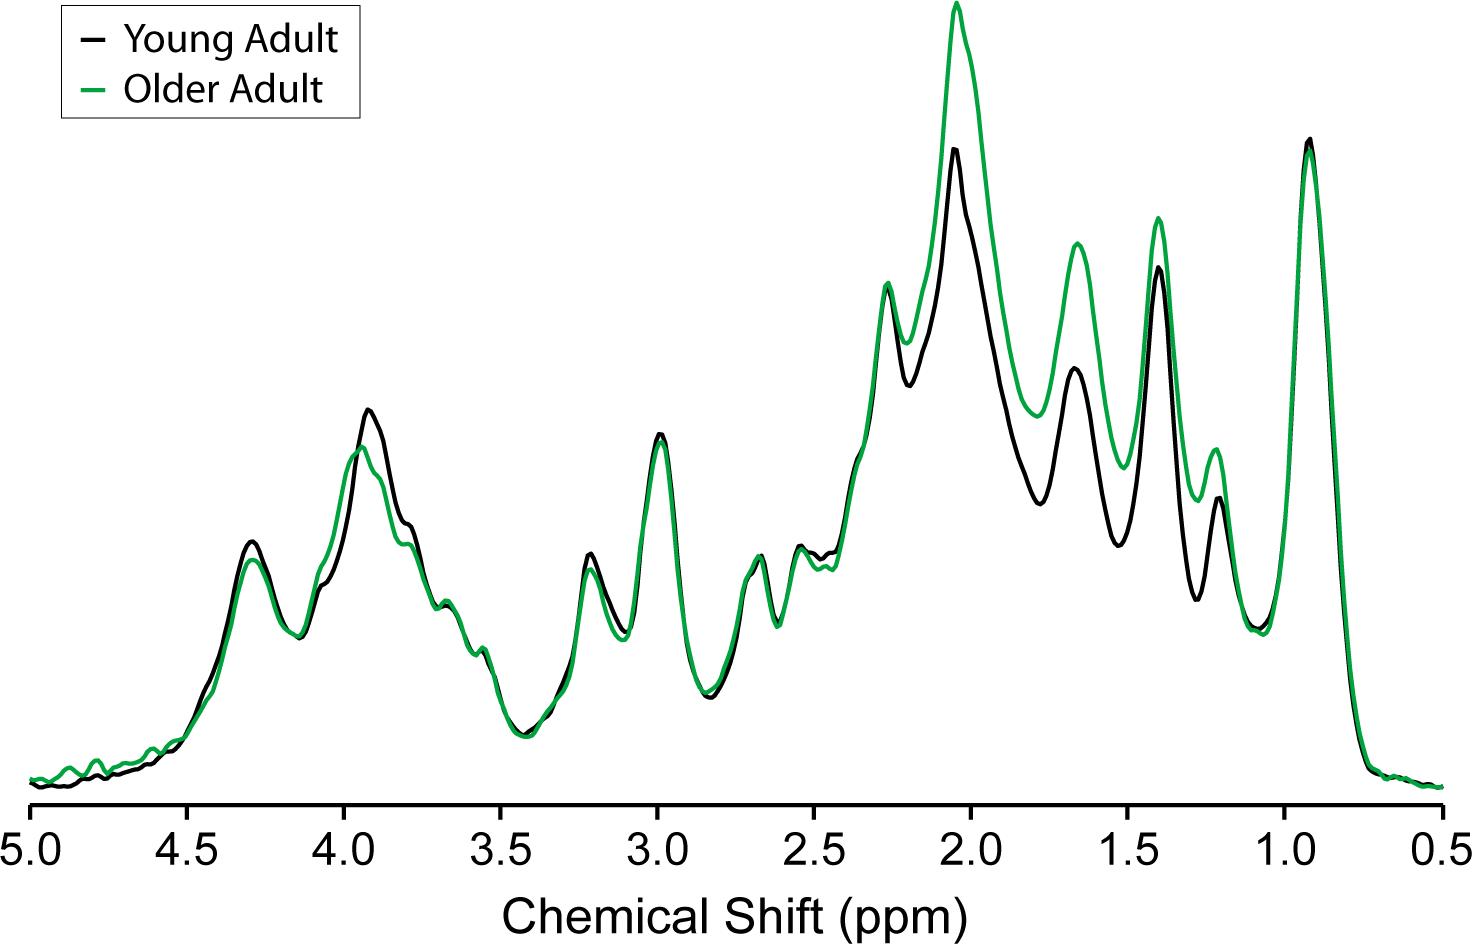
Proton MR spectra of the brain, especially those measured at short and intermediate echo times, contain signals from mobile macromolecules (MM). A description of the main MM is provided in this consensus paper. These broad peaks of MM underlie the narrower peaks of metabolites and often complicate their quantification but they also may have potential importance as biomarkers in specific diseases. Thus, separation of broad MM signals from low molecular weight metabolites enables accurate determination of metabolite concentrations and is of primary interest in many studies. Other studies attempt to understand the origin of the MM spectrum, to decompose it into individual spectral regions or peaks and to use the components of the MM spectrum as markers of various physiological or pathological conditions in biomedical research or clinical practice. The aim of this consensus paper is to provide an overview and some recommendations on how to handle the MM signals in different types of studies together with a list of open issues in the field, which are all summarized at the end of the paper.

Keywords: brain macromolecules; fitting; metabolite quantification; mobile lipids; parameterization; proton magnetic resonance spectroscopy; quantification; spectral analysis.


Figures

Figure 1:
Figure 1:
B0 dependence of MM acquired in vivo using 1H MRS. (A) Dependence of M0.94 signal linewidth on B0 with linewidth expressed in Hz; (B) Dependence of M0.94 signal linewidth on B0 with linewidth expressed in ppm. Lines calculated for parameters T2 = 32 ms and Δν* = 4.73 Hz/T. Experimental values were assessed using spectra from the CMRR database, spectra provided by co-authors of this paper and spectra from papers,,,,. Blue symbols: human MM spectra, red symbols: animal MM spectra. (C) MM spectra acquired in vivo from the brain of different species at 9.4 T and from human and rat brain at different B0 showing noticeable increased spectroscopic resolution Spectra are from the following centres: CIBM-EPFL (Centre d’Imagerie Biomedicale, Ecole Polytechnique Federale de Lausanne, Lausanne, Switzerland), CMRR (Center for Magnetic Resonance Research, University of Minnesota, Minneapolis, MN, USA), Max Planck Institute for Biological Cybernetics (Tuebingen, Germany). Spectra are available online here: https://forum.mrshub.org/t/data-submission-mm-consensus-data-collection/92
Figure 2:
Figure 2:
B0 dependence of metabolite (ME) and macromolecule T1 (A) and T2 (B) relaxation. The indicated metabolite ranges include T1 and T2 values for NAA methyl, total creatine methyl and choline methyl signals published in rat,, and human brain, whereas the indicated MM ranges include T1 and T2 values for the M0.94 (M1) to M1.70 (M4) signals published in rat brain,. Note the logarithmic vertical scale.
Figure 3:
Figure 3:
Signal suppression and recovery for (A-C) metabolite-nulled (labelled as ME) and (D-F) MM-nulled MR spectroscopy using (A, D) single inversion recovery (IR, TR=2s) and (B, E) double IR (TR=5s) acquisition strategies as a function of B0 and T1 relaxation time constant published for rat brain. The black and white lines indicate the metabolite and/or MM T1 relaxation ranges. Note the logarithmic vertical scale for all color maps. (C, F) B0 dependence of the optimal inversion recovery times for (C) metabolite-nulled and (F) MM-nulled MRS. The inversion times are optimized to provide the best signal suppression over the T1 ranges indicated in (A, B, D and E). Optimal inversion times for single (TI) and double IR (TI1/TI2) are shown in blue and red, respectively. The Matlab code used to generate these data can be found in Appendix 2.
Figure 4:
Figure 4:
A) A series of IR spectra from rat brain in vivo with TI ranging from 420 to 1000 ms revealing the evolution of metabolite intensities as a function of TI (all the spectra were acquired with TE/TR=2.8/2500 ms at 9.4 T using the SPECIAL sequence in a voxel of 3×3×3mm centered in the hippocampus); B) Spectra acquired with a selected TI (750 ms) and TE of 2.8 ms (taken from A) as well as with TE of 40 ms (5x magnified, TE=40 ms spectrum from 2.2–3.8 ppm is shown on the top); C) Original spectra acquired at TI of 750 ms and TE of 2.8 ms (shown in black), estimated fits of the residual metabolites using AMARES (shown in red), and the residue obtained after subtraction of the estimated metabolite signals from the original spectrum (shown in blue). All spectra were acquired in vivo in the rat brain at 9.4 T.
Figure 5:
Figure 5:
TE dependence of MM. Spectra measured in the human brain in vivo at 4 T at different TEs using (A) LASER sequence and (B) inversion-recovery LASER sequence (occipital lobe, volume-of-interest = 27 mL, TR = 2 s, TI = 0.67 s, 64 averages per TE). Adapted from with permission. (C) Spectra measured in the rat brain in vivo at 9.4 T at different TEs using SPECIAL sequence (hippocampus+cortex, volume-of-interest = 27 μL, TR = 4 s, 240 averages per TE).
Figure 6.
Figure 6.
A) Schematic representation of MM coediting. Gaussian pulse (blue) set at 1.9 ppm partially excites 1.7 ppm MM resonance to result in MM coediting. In symmetric pulsing, the ON and OFF resonance pulses are set at 1.9 (blue) and 1.5 ppm (red) respectively, resulting in MM-suppressed GABA signal. B) Single-subject MM-coedited GABA (GABA+MM) and MM-suppressed GABA spectra using symmetric pulsing with MEGA-LASER sequence at 7 T. (Adapted from reference with permission); C) T1-weighted MRI, metabolic maps of GABA+/tNAA (i.e. GABA+MM3.00) and GABA/tNAA (7 T, nominal voxel volume ~1.4 ml, GABA measured using IR MM-nulling). The GM/WM contrast increased 2.15-fold in GABA/NAA compared to GABA+/NAA, as also shown in a previous study using MQ GABA editing. This may be attributed to a reduced dilution effect of MM contribution that has less contrast between GM and WM than GABA and to an elevated abundance of the underlying MM component (M3.00) in WM, but further investigation is needed. (Note: tNAA measured with EDIT-OFF IR-ON was used for normalization in both cases). MM-suppressed MEGA-edited GABA measurement has shown similar GM/WM difference of GABA as MQ GABA editing.
Figure 7:
Figure 7:
A) T1-weighted MRI and metabolic maps of MM components obtained from a healthy human brain using simultaneous quantification of metabolites and MM from FID-MRSI data. (acquired at 7 T, nominal voxel volume ~0.32 ml). MM components show regional differences in healthy brain and their signal intensities are typically higher in GM than in WM.
Figure 8:
Figure 8:
Age-associated MM differences. Average metabolite-nulled macromolecular spectra measured from four young adults (26 ± 4 years) and three older adults (73 ± 3 years) normalized to water reference and taking into consideration GM, WM and cerebrospinal fluid content, as well as T2 of water in different compartments. Clear age-associated differences in MM pattern are apparent, as the spectra overlap completely at 0.9 ppm, but diverge at several other chemical shifts. A content difference is also apparent, as the spectra are normalized, and the MM spectrum for young adults lies below the MM spectrum for older adults to a greater extent in the 1–2.3 ppm range than it lies above the MM spectrum for older adults in the 3–4.5 ppm range. Adapted from reference with permission. 7 T, single inversion recovery technique combined with STEAM, TR = 2 s, TE = 8 ms, TM = 32 ms, TI = 0.68 s, 8-mL volume of interest in the occipital cortex, 1664 averages for the young adults, 960 averages for the older adults.

References

    1. Kunz N, Cudalbu C, Mlynarik V, Hüppi PS, Sizonenko SV., Gruetter R. Diffusion-weighted spectroscopy: A novel approach to determine macromolecule resonances in short-echo time 1H-MRS. Magn Reson Med. 2010;64(4):939–946. - PubMed
    1. Graaf RA de Brown PB, Mcintyre S Nixon TW, Behar KL Rothman DL. High Magnetic Field Water and Metabolite Proton T 1 and T 2 Relaxation in Rat Brain In Vivo. Magn Reson Med. 2006;56(2):386–94. - PubMed
    1. Behar KL, Ogino T. Assignment of resonances in the 1H spectrum of rat brain by two-dimensional shift correlated and J-resolved NMR spectroscopy. Magn Reson Med. 1991;17(2):285–303. - PubMed
    1. Behar KL, Ogino T. Characterization of macromolecule resonances in the 1H NMR spectrum of rat brain. Magn Reson Med. 1993;30(1):38–44. - PubMed
    1. Arus C, Yen-Chung C, Barany M. Proton magnetic resonance spectra of excised rat brain. Assignments of resonances. Physiol Chem Phys Med NMR. 1985;17(1):23–33. - PubMed

Publication types

LinkOut - more resources