. 2020 Nov 25:9:e62518.
doi: 10.7554/eLife.62518.

Structure of bacterial phospholipid transporter MlaFEDB with substrate bound

Affiliations

Structure of bacterial phospholipid transporter MlaFEDB with substrate bound

Nicolas Coudray et al. Elife. .

Abstract

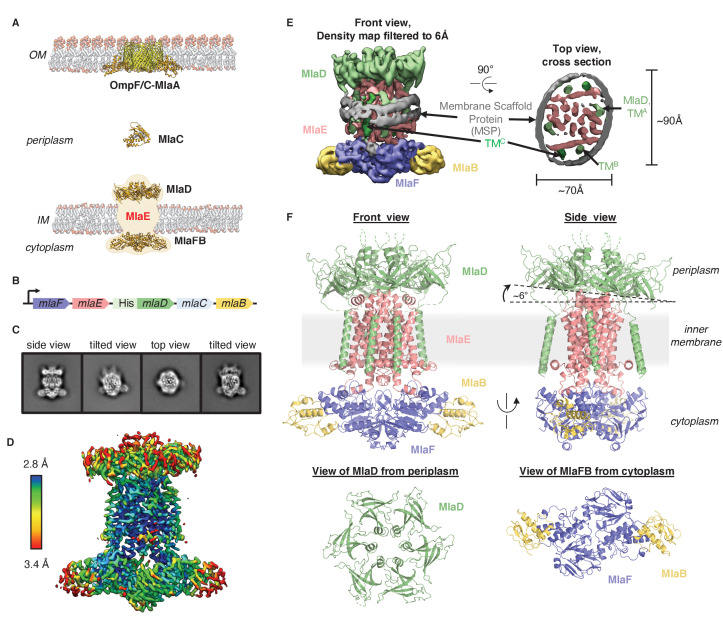
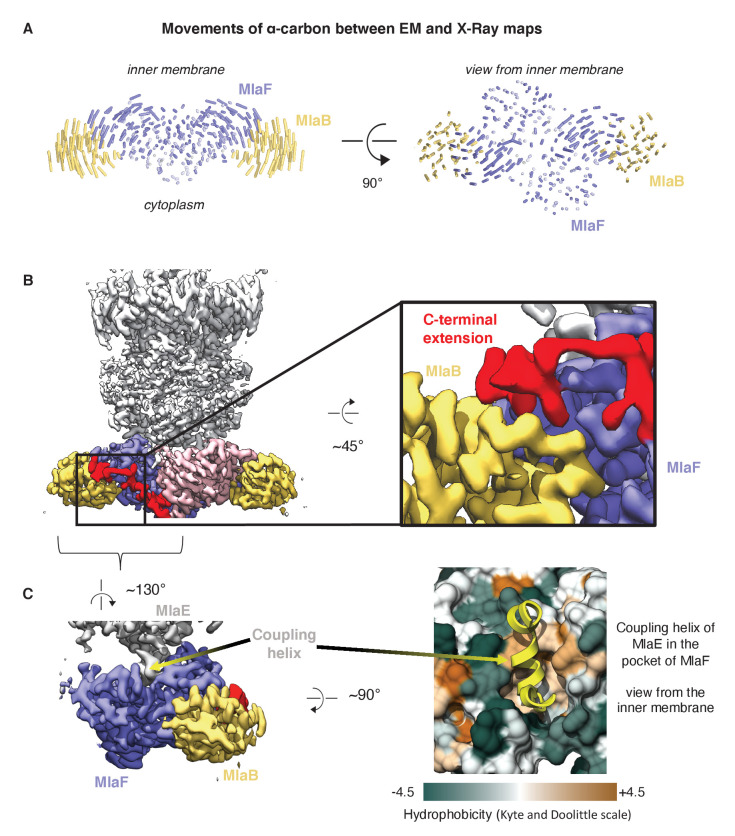
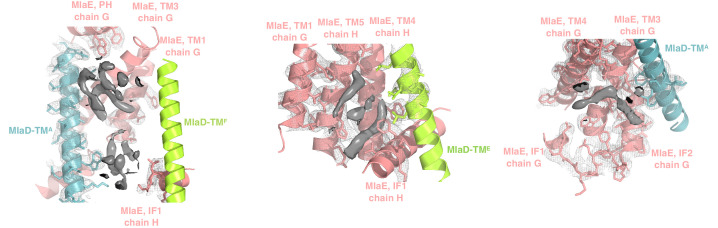
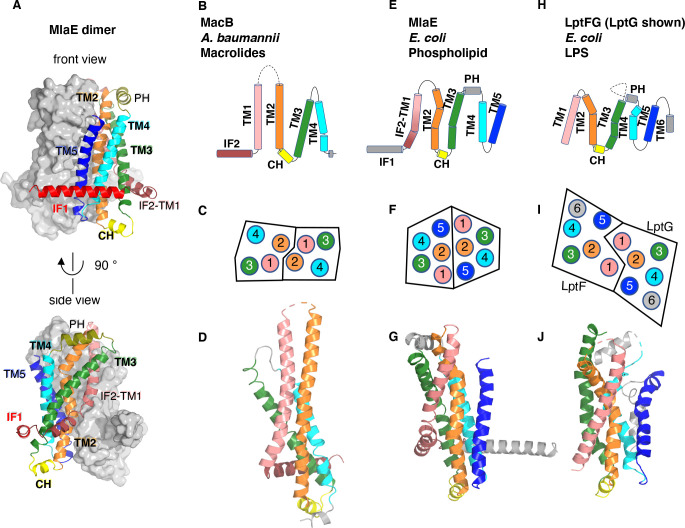
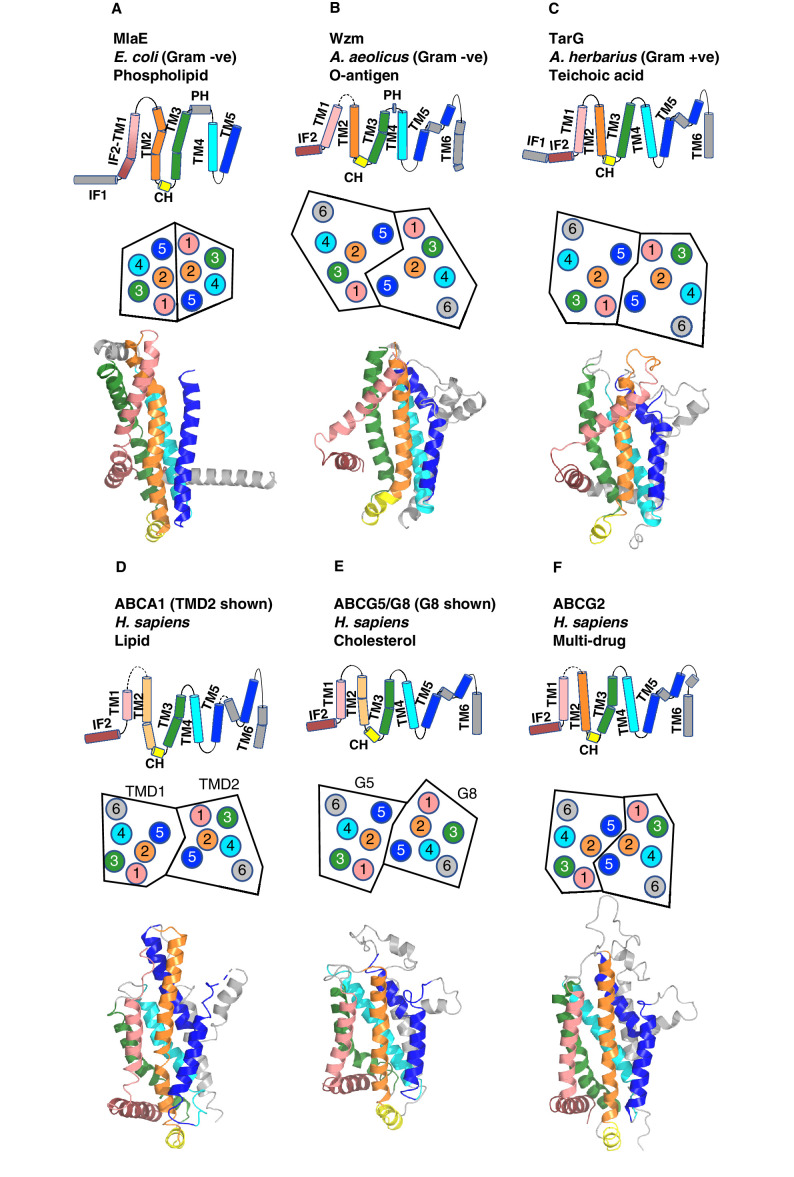
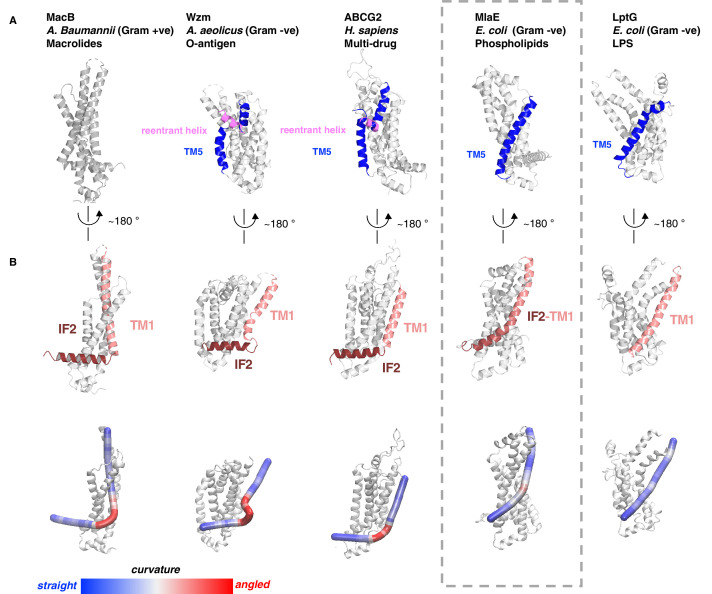
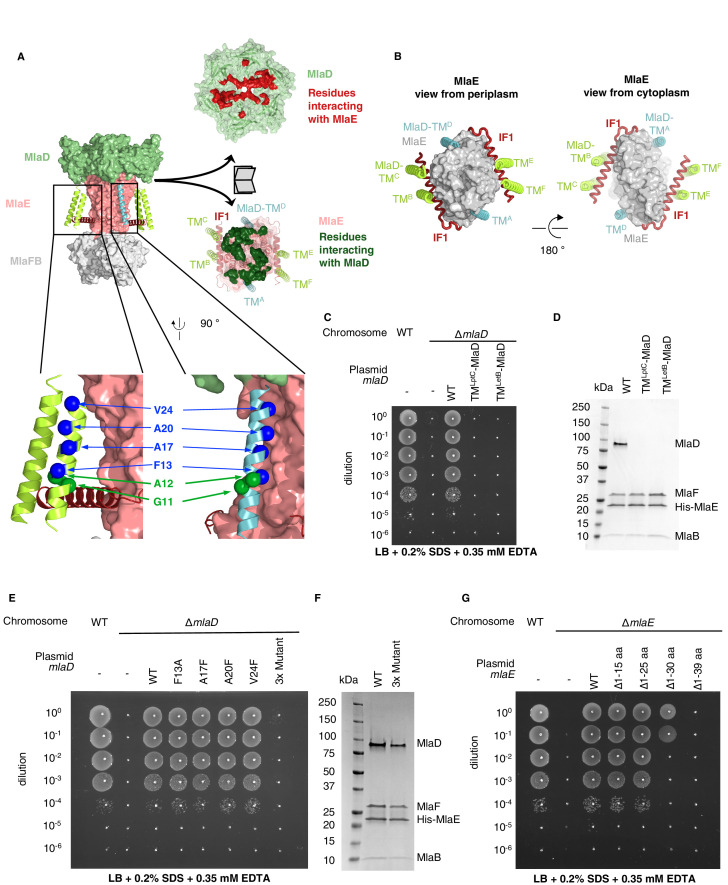
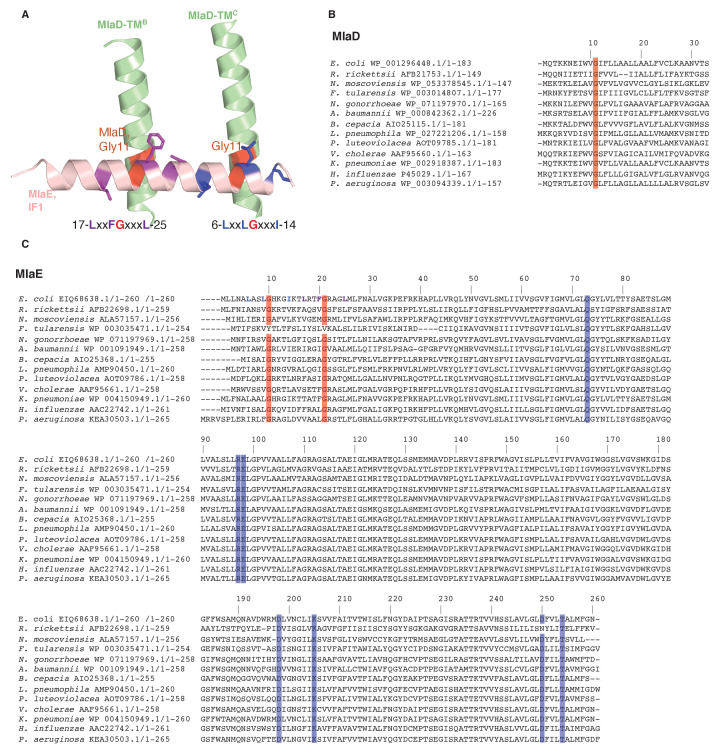
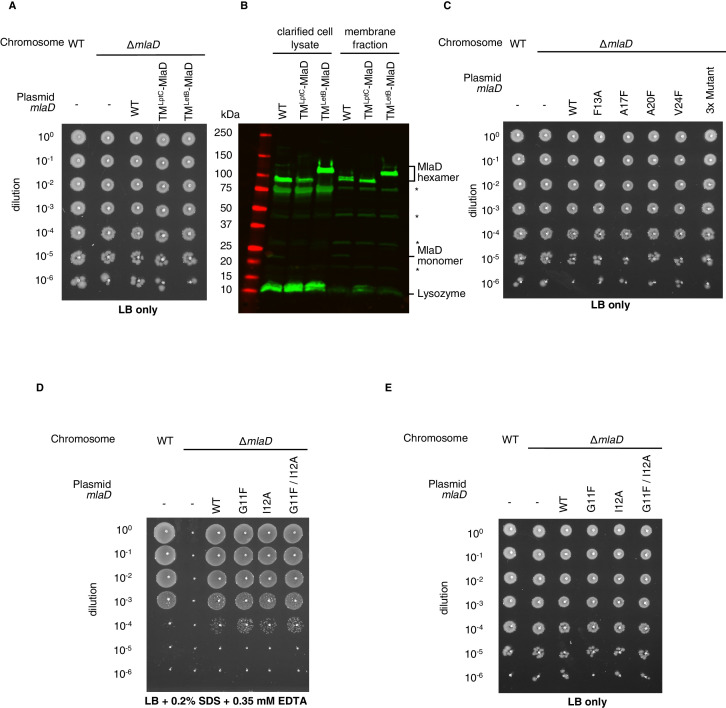
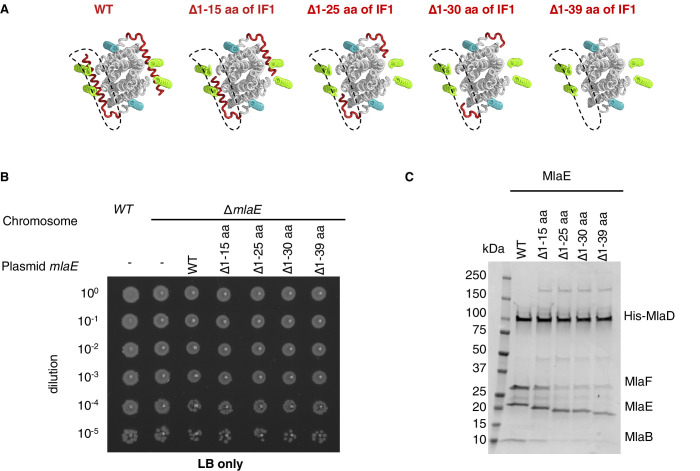
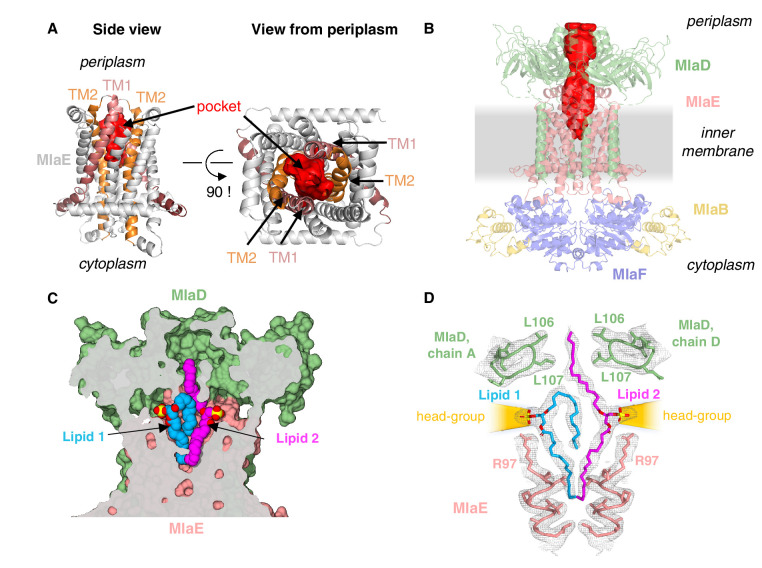
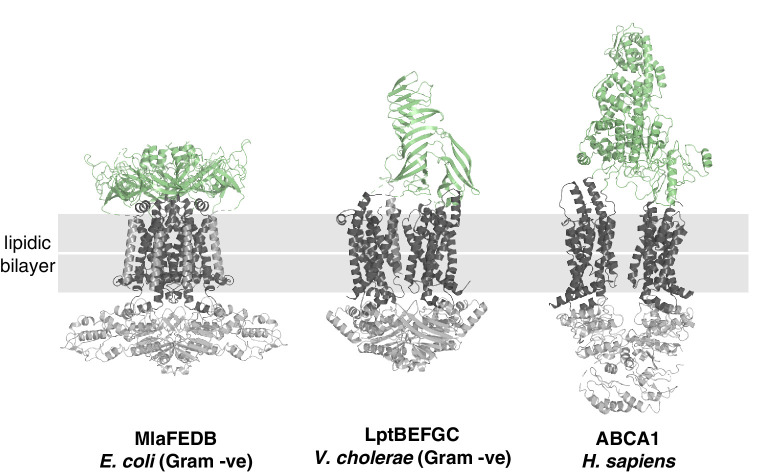
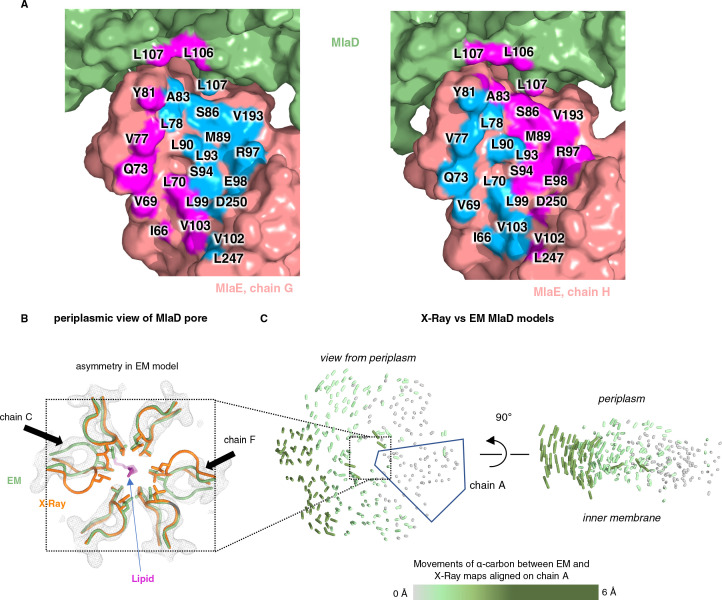
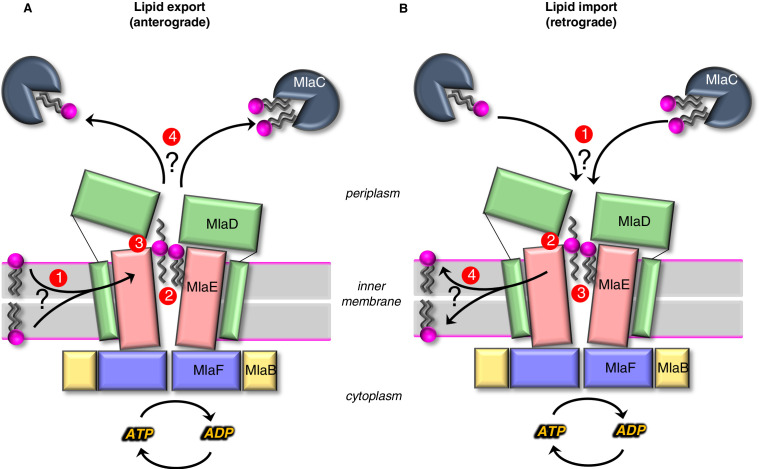
In double-membraned bacteria, phospholipid transport across the cell envelope is critical to maintain the outer membrane barrier, which plays a key role in virulence and antibiotic resistance. An MCE transport system called Mla has been implicated in phospholipid trafficking and outer membrane integrity, and includes an ABC transporter, MlaFEDB. The transmembrane subunit, MlaE, has minimal sequence similarity to other transporters, and the structure of the entire inner-membrane MlaFEDB complex remains unknown. Here, we report the cryo-EM structure of MlaFEDB at 3.05 Å resolution, revealing distant relationships to the LPS and MacAB transporters, as well as the eukaryotic ABCA/ABCG families. A continuous transport pathway extends from the MlaE substrate-binding site, through the channel of MlaD, and into the periplasm. Unexpectedly, two phospholipids are bound to MlaFEDB, suggesting that multiple lipid substrates may be transported each cycle. Our structure provides mechanistic insight into substrate recognition and transport by MlaFEDB.

Keywords: E. coli; bacterial outer membrane; cryo-EM; lipid transport; mla pathway; molecular biophysics; structural biology.


Conflict of interest statement

NC, GI, MM, MS, GB, DE No competing interests declared

Figures

Figure 1.
Figure 1.. Cryo-EM structure of the MlaFEDB complex.
(A) Schematic of the Mla pathway (adapted from Kolich et al., 2020). The OmpC/F-MlaA complex (PDB 5NUP), periplasmic shuttle protein MlaC (PDB 5UWA), and MlaFEDB complex (PDB 5UW2 and 6XGY, EMDB-8610) are shown. (B) Schematic of the MlaFEDCB operon with N-terminal His-tag on MlaD, as reported previously (Ekiert et al., 2017). (C) 2D class averages from single-particle cryo-EM analysis of MlaFEDB in nanodiscs. (D) Final EM density map of MlaFEDB, colored by local resolution (EMD-22116). (E) Density map of MlaFEDB filtered to 6 Å, showing membrane scaffold protein (MSP) belts surrounding the edge of the lipid nanodisc. MlaF, slate blue; MlaE, pink; MlaD, green; MlaB, yellow; MSP, gray. The packing of the six TM helices from the MlaD subunits around the periphery of the MlaE core is apparent in the Top View. (F) Overview of the MlaF2E2D6B2 model (PDB 6XBD); colors as in E. Regions of disorder in MlaD linkers and C-termini are indicated by green dashed lines. The MlaD ring is tilted relative to MlaFEB, resulting in a complex that is asymmetric overall.
Figure 1—figure supplement 1.
Figure 1—figure supplement 1.. Cryo-EM data processing workflow.
In column 2, an intermediate map is shown with the mask used during reconstructions in RELION, and in column 3, the map is shown with the ‘mask_refine’ automatically computed by cryoSPARC.
Figure 1—figure supplement 2.
Figure 1—figure supplement 2.. Cryo-EM data and analysis.
(A) Representative micrograph. (B) Representative 2D classes. (C) Viewing direction distribution of the final model from cryoSPARC. (D) Gold-standard FSC curve.
Figure 1—figure supplement 3.
Figure 1—figure supplement 3.. Representative density for MlaFEDB complex.
(A) Representative densities from the final map into which the model was built. (B) Density map filtered to 6 Å showing unmodeled density between TMC of MlaD (and TMF on the other side) and MlaF. This density is not well defined and may correspond to the His-Tag from MlaD, or an unknown ligand.
Figure 1—figure supplement 4.
Figure 1—figure supplement 4.. Comparison of MlaFB from X-ray and Cryo-EM structures.
(A) The EM (this study, PDB 6XBD) and X-ray ([Kolich et al., 2020] PDB: 6XGY) models were aligned on the MlaF dimer, and to illustrate differences, lines between alpha-carbons are shown using a modified version of the ColorByRMSD pymol script. (B) Cryo-EM density map of MlaFEDB. The C-terminal extension (red) of one MlaF monomer (pink) wraps around the other MlaF monomer (slate blue), placing a small helix at the MlaF/MlaB interface, consistent with the X-ray structure of MlaFB alone (Kolich et al., 2020). (C) Interaction between MlaF and the coupling helix of MlaE in the cryo-EM structure.
Figure 1—figure supplement 5.
Figure 1—figure supplement 5.. Extra densities in the transmembrane region.
Elongated densities around the TM region and in the cleft formed by IF1 are shown in solid gray, which could potentially be either phospholipids or other molecules. Due to the ambiguous nature of the densities, we have not modeled any coordinates in these regions.
Figure 2.
Figure 2.. Topology and fold of MlaE.
(A) MlaE dimer, with one protomer represented as surface, and the other as cartoon. (B–J) comparison of MlaE (PDB 6XBD) with the related transmembrane domains of ABC transporters, MacB and LptFG (PDB 5GKO and 6MHZ). (B, E, H) Topology diagrams. CH, coupling helix; PH, periplasmic helix; IF, interfacial helix (also called connecting helix in ABCG transporters); TM, transmembrane helix. (C, F, I) Schematics representing helices at the dimer interface, viewed from the periplasm (each circle represents a helix). (D, G, J) Cartoon view of monomer. See Figure 2—figure supplement 1 for comparisons with additional related transporters.
Figure 2—figure supplement 1.
Figure 2—figure supplement 1.. Comparison of MlaE to other ABC transporters.
(A) MlaE, this paper, PDB 6XBD; (B) O-antigen transporter, PDB 6OIH; (C) TarG, PDB 6JBH; (D) ABCA1, PDB 5XJY, TMD2 shown; (E) ABCG5/G8, PDB 5DO7, G8 shown; (F) ABCG2, PDB 6HBU. Topology diagrams (first row); schematics representing helices at the dimer interface, viewed from the periplasm (each circle represents a helix) (second row); and cartoon views of monomers (third row) are shown.
Figure 2—figure supplement 2.
Figure 2—figure supplement 2.. Structural variation in MlaE TMD compared to other ABC transporters.
(A) TM5 helices (blue) are either a single continuous helix (MlaE, PDB 6XBD; LptG, PDB 6MHZ), a reentrant helix insertion (pink) (Wzm, PDB 6OIH; ABCG2, PDB 6HBU), or no helix (MacB, PDB 5GKO). (B) IF2 (brown) and TM1 (salmon) helices adopt a range of conformations, from IF2 being parallel to the membrane interface and forming a sharp angle with TM1 (left) to one continuous smooth helix for LptG (right). Top row, cartoon representation; bottom row, curvature color coded using Bendix (Dahl et al., 2012).
Figure 3.
Figure 3.. TM helices of MlaD are important for interaction with MlaE.
(A) Structure of MlaFEDB complex, highlighting interacting regions between MlaE and MlaD. MlaD-TMA/D (cyan helices) interact with the core domain of MlaE (pink surface); MlaD-TMB/C/E/F (green helices) interact mostly with IF1 (red helices). The periplasmic end of the MlaE dimer interacts with the MlaD ring (shown in ‘open book’ representation, right). MlaD residues that interact with MlaE are shown in red, and MlaE residues that interact with MlaD are shown in green, as determined using COCOMAPS (Vangone et al., 2011). Below, a zoom of the positions on the TM helices of MlaD mutated to test interactions either with IF1 (green spheres) or the TM helices of MlaE (blue spheres) (related to panel E), (F) and (Figure 3—figure supplement 2C-E). (B) Periplasmic and cytoplasmic views highlighting the interaction between helices of MlaE and MlaD. Helices colored as in (A). (C) Genetic complementation of mlaD knockout with MlaD TM chimeras. 10-fold serial dilutions of the indicated cultures spotted on LB plates containing SDS+EDTA at the concentrations indicated, and incubated overnight. The mlaD knockout does not grow in the presence of SDS+EDTA, but can be rescued by the expression of WT MlaD from a plasmid. MlaD chimeras containing LptC or LetB TM helices fail to complement. Corresponding controls plated on LB only can be found in Figure 3—figure supplement 2A. (D) SDS-PAGE of recombinantly expressed and purified complexes formed in the presence of WT MlaD or MlaD chimeras containing LptC or LetB TM helices. (E) Genetic complementation of mlaD knockout with MlaD TM mutants. The assay is performed as in (C). F13A, A17F, A20F, V24F mutants complement, while a triple mutant (A17F/A20F/V24F; ‘3x Mutant’) fails to complement. Corresponding controls plated on LB only can be found in Figure 3—figure supplement 2C. (F) SDS-PAGE of recombinantly expressed and purified complexes formed in the presence of WT MlaD or the MlaD 3x Mutant. (G) Genetic complementation of mlaE knockout with MlaE IF1 truncation mutants. The assay is performed as in (C). Small deletions of the N-terminus of MlaE IF1 are tolerated, while larger deletions impair or completely abolish growth. Corresponding controls plated on LB only can be found in Figure 3—figure supplement 2D.
Figure 3—figure supplement 1.
Figure 3—figure supplement 1.. Sequence conservation in MlaD and MlaE.
(A) Conserved motifs are depicted at the interface between MlaE IF1 and the TM helices of MlaD. (B) Sequence alignment of MlaD (TM helix only) and (C) MlaE from 13 diverse bacterial species. Red, conserved glycine residues that are part of the interaction between IF1 and the TM helices of MlaD. Blue, the conserved residues that are part of the salt bridge and polar interactions around R97. Residue numbers correspond to E. coli sequences. Sequence alignments were done with MUSCLE (Edgar, 2004) implemented within Phenix.
Figure 3—figure supplement 2.
Figure 3—figure supplement 2.. Extended data for MlaD mutants.
(A) Tenfold serial dilutions of the indicated cultures spotted on LB agar and incubated overnight (control for data in Figure 3C). (B) Western blot using an anti-MlaD antibody against wild-type and mutant forms of MlaD, showing expression levels in the cell lysate and membrane fraction after overexpression. Bands for MlaD monomer and hexamer are annotated, in addition to a band corresponding to lysozyme (used in the purification protocol). Asterisk denotes non-specific bands, also observed in an mlaD knockout strain. (C) Tenfold serial dilutions of the indicated cultures spotted on LB agar and incubated overnight (control for data in Figure 3E). (D) Genetic complementation of mlaD knockout with MlaD TM mutants. 10-fold serial dilutions of the indicated cultures spotted on LB plates containing SDS+EDTA at the concentrations indicated, and incubated overnight. The mlaD knockout does not grow in the presence of SDS+EDTA, but can be rescued by the expression of WT MlaD from a plasmid. All MlaD mutants complement. (E) Controls corresponding to (D), plated on LB only.
Figure 3—figure supplement 3.
Figure 3—figure supplement 3.. Extended data for MlaE mutants.
(A) Illustration of the IF1 truncation mutants used in genetic complementation assays (related to Figure 3G). (B) 10-fold serial dilutions of the indicated cultures spotted on LB agar and incubated overnight (control for data in Figure 3G). (C) SDS-PAGE of recombinantly expressed and co-purified MlaFEDB complexes with truncations of MlaE IF1 (as in (A)), purified by pulling down His-MlaD.
Figure 4.
Figure 4.. Lipids are bound in an outward-open pocket formed by MlaE and MlaD.
(A) Side view (left) and view from periplasm (right) of MlaE dimer highlighting the outward-open pocket formed by TM1 (salmon helices) and TM2 (orange helices). The boundary of the substrate-binding pocket was estimated using CASTp (Tian et al., 2018), and is displayed as a red surface. (B) Side view of MlaFEDB complex, showing the continuous hydrophobic channel running from the substrate-binding pocket in MlaE to the periplasmic space, through the pore of MlaD (red, tunnel boundary estimated with HOLLOW [Ho and Gruswitz, 2008]). (C) Side view cross-section of the hydrophobic channel between MlaE and MlaD showing two bound phospholipids in blue and magenta. (D) Lipids modeled with surrounding structural elements and key residues highlighted. EM density map is shown as mesh, at the same contour level for lipids and surrounding regions. The lateral channels that could accommodate lipid head groups are indicated by orange cones.
Figure 4—figure supplement 1.
Figure 4—figure supplement 1.. Structural diversity of extracytoplasmic lipid transport domains.
Extracytoplasmic lipid transport domains (green) from ABC transporters. MlaFEDB, PDB 6XBD; LptBEFGC, PDB 6MJP; ABCA1, PDB 5XJY.
Figure 4—figure supplement 2.
Figure 4—figure supplement 2.. Asymmetry of lipid interactions and asymmetry of MlaD in the MlaFEDB complex.
(A) MlaE protomers (salmon) and nearby MlaD subunits (green) shown as a surface, with residues within 4.5 Å of lipid 1 colored blue and residues within 4.5 Å of lipid 2 colored magenta. (B) X-ray (orange, PDB 5UW2) and EM (green, PDB 6XBD) structures aligned on the whole hexamer, highlighting differences in the conformations of the pore lining loops of MlaD between the symmetric crystal structure and the asymmetric EM structure. (C) The EM and X-ray MlaD structures were aligned on chain A and, to illustrate the tilt and break in symmetry, lines were drawn between alpha-carbons using a modified version of the ColorByRMSD pymol script.
Figure 4—figure supplement 3.
Figure 4—figure supplement 3.. Point mutations in MlaE.
(A) Center, MlaE dimer (gray ribbons) with sites of mutations indicated by spheres (lime), and the two bound lipids (magenta and blue sticks). Left, zoomed in view of the salt bridges formed by residues Arg97, Glu98, Lys205, and Asp250 (lime sticks), part of a larger polar interaction network including Gln73, Asp198, and Thr254 (black sticks). Right, zoomed in view of interactions between Tyr81 (lime) and bound lipids (blue and magenta). (B) Tenfold serial dilutions of the indicated cultures spotted on LB plates containing SDS and EDTA at the concentrations indicated and incubated overnight. The mlaE knockout grows poorly in the presence of SDS+EDTA, but can be rescued by the expression of WT MlaE or MlaE mutants. (C) Same as in (B), but plated on LB only.
Figure 4—figure supplement 4.
Figure 4—figure supplement 4.. MlaC structures in which either one or two lipids are bound.
E. coli MlaC (PDB 5UWA) and P. putida MlaC (PDB 5UWB) are shown in cartoon representation and with a cross-section through the surface. Lipids are shown as yellow or magenta spheres.
Figure 4—figure supplement 5.
Figure 4—figure supplement 5.. Comparison of lipid modeling into MlaFEDB map EMDB-30355 (Chi et al., 2020).
(A) The density map EMD-30355 deposited by Chi et al., 2020 shown with the corresponding model (PDB 7CGE). (B) Model from this work (PDB 6XBD) rigid-body docked into the same density map (EMD-30355).
Figure 5.
Figure 5.. In vivo photocross-linking of substrates in MlaFEDB.
(A) MlaE dimer (gray cartoon) showing sites of BPA cross-linker incorporation (spheres). Orange, residues in the lipid-binding pocket; red, residue buried within the MlaE core, designed as a negative control; green, residue facing the membrane environment, designed as a positive control. Bound lipids are shown in magenta and blue sticks. (B) SDS-PAGE of purified WT MlaFEDB and BPA mutants, either cross-linked or uncross-linked, and visualized by Coomassie staining (protein) or phosphorimaging (32P signal). Band corresponding to the MlaE monomer is shown here, and full gels are shown in Figure 5—figure supplement 1.
Figure 5—figure supplement 1.
Figure 5—figure supplement 1.. Uncropped gels of the in vivo photocross-linking assay shown in Figure 5.
Figure 5—figure supplement 2.
Figure 5—figure supplement 2.. Western blot against MlaE, showing positions of MlaE monomer and cross-linked MlaE dimer.
Anti-His western blot against uncross-linked and cross-linked MlaE WT, and Tyr81BPA and Trp149BPA mutants.
Figure 6.
Figure 6.. Models for lipid transport by MlaFEDB.
(A) Lipid export model: (1) Lipids are extracted from the IM and transferred to the outward-open pocket by an unknown mechanism. (2) Lipids are reoriented, from ‘tails-down’ to ‘extended’ or ‘tails-up’ configuration. (3) Conformational changes in MlaE coupled to the ATP hydrolysis cycle likely push lipids out of the MlaE pocket and into MlaD pore. (4) Lipids are transferred to MlaC to be shuttled across periplasm to the outer membrane MlaA-OmpC/F complex. MlaC may accommodate one or two phospholipids, or a single larger lipid. (B) Lipid import model: (1) Lipids from MlaC are transferred to MlaD, likely dependent on ATP-driven conformational changes in MlaD and MlaE. (2) Lipids travel through the continuous channel from MlaD and are transferred to the outward-open pocket of MlaE. (3) Phospholipids are reoriented ‘tails-down’, as they are transported between MlaD and MlaE. (4) Lipids are inserted into the inner membrane.

References

    1. Abellón-Ruiz J, Kaptan SS, Baslé A, Claudi B, Bumann D, Kleinekathöfer U, van den Berg B. Structural basis for maintenance of bacterial outer membrane lipid asymmetry. Nature Microbiology. 2017;2:1616–1623. doi: 10.1038/s41564-017-0046-x. - DOI - PubMed
    1. Aller SG, Yu J, Ward A, Weng Y, Chittaboina S, Zhuo R, Harrell PM, Trinh YT, Zhang Q, Urbatsch IL, Chang G. Structure of P-glycoprotein reveals a molecular basis for poly-specific drug binding. Science. 2009;323:1718–1722. doi: 10.1126/science.1168750. - DOI - PMC - PubMed
    1. Asarnow D, Palovcak E, Cheng Y. UCSF Pyem. v0.5Zenodo. 2019 doi: 10.5281/zenodo.3576630. - DOI
    1. Baba T, Ara T, Hasegawa M, Takai Y, Okumura Y, Baba M, Datsenko KA, Tomita M, Wanner BL, Mori H. Construction of Escherichia coli K-12 in-frame, single-gene knockout mutants: the keio collection. Molecular Systems Biology. 2006;2:50. doi: 10.1038/msb4100050. - DOI - PMC - PubMed
    1. Bayburt TH, Grinkova YV, Sligar SG. Self-Assembly of discoidal phospholipid bilayer nanoparticles with membrane scaffold proteins. Nano Letters. 2002;2:853–856. doi: 10.1021/nl025623k. - DOI

Publication types

MeSH terms

Substances

LinkOut - more resources