. 2020 Nov 25:9:e62611.
doi: 10.7554/eLife.62611.

Structural and mechanistic basis of the EMC-dependent biogenesis of distinct transmembrane clients

Affiliations

Structural and mechanistic basis of the EMC-dependent biogenesis of distinct transmembrane clients

Lakshmi E Miller-Vedam et al. Elife. .

Abstract

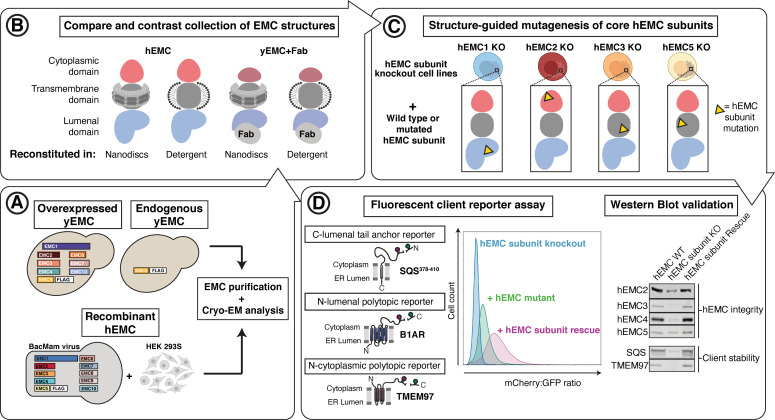
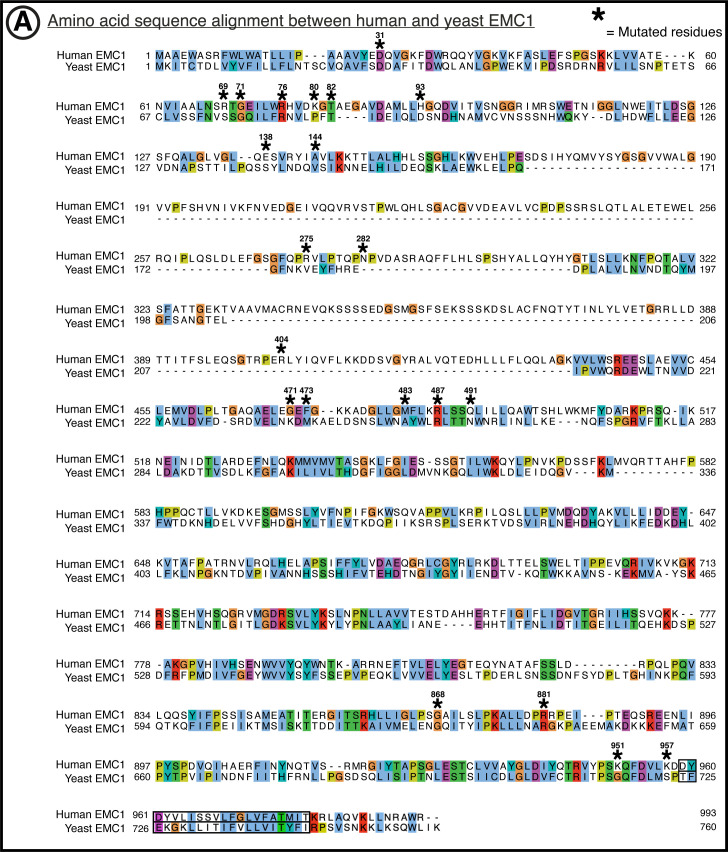
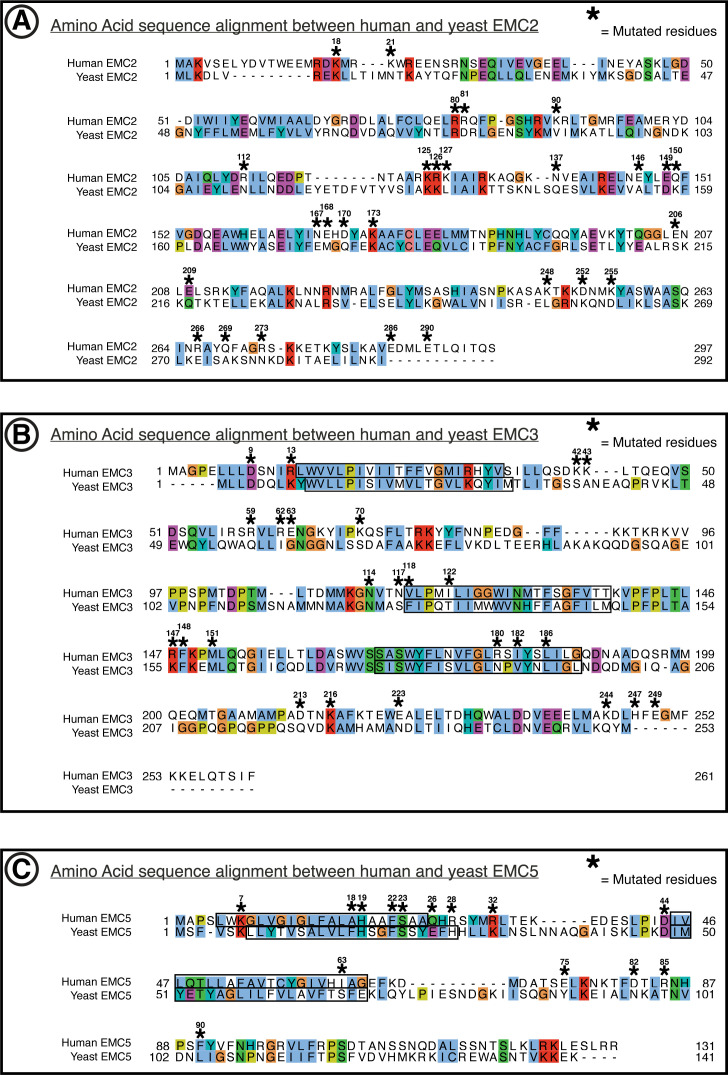
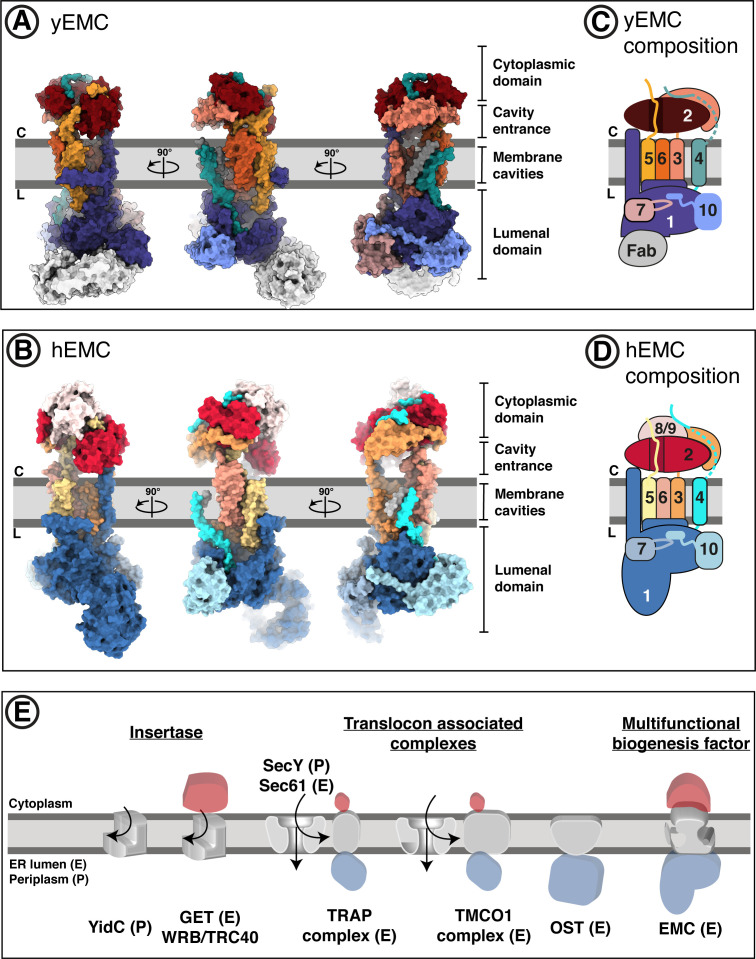
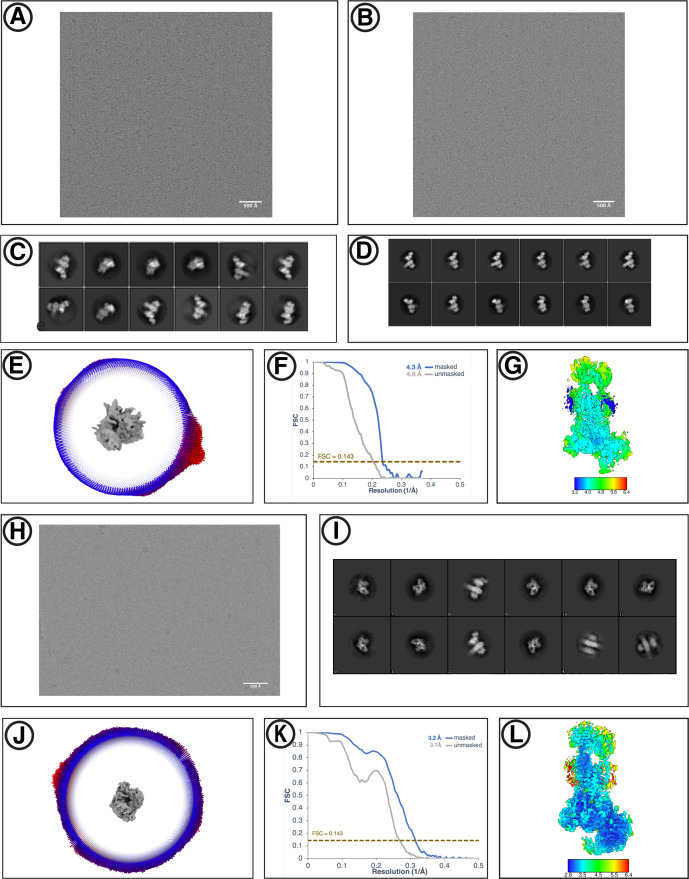
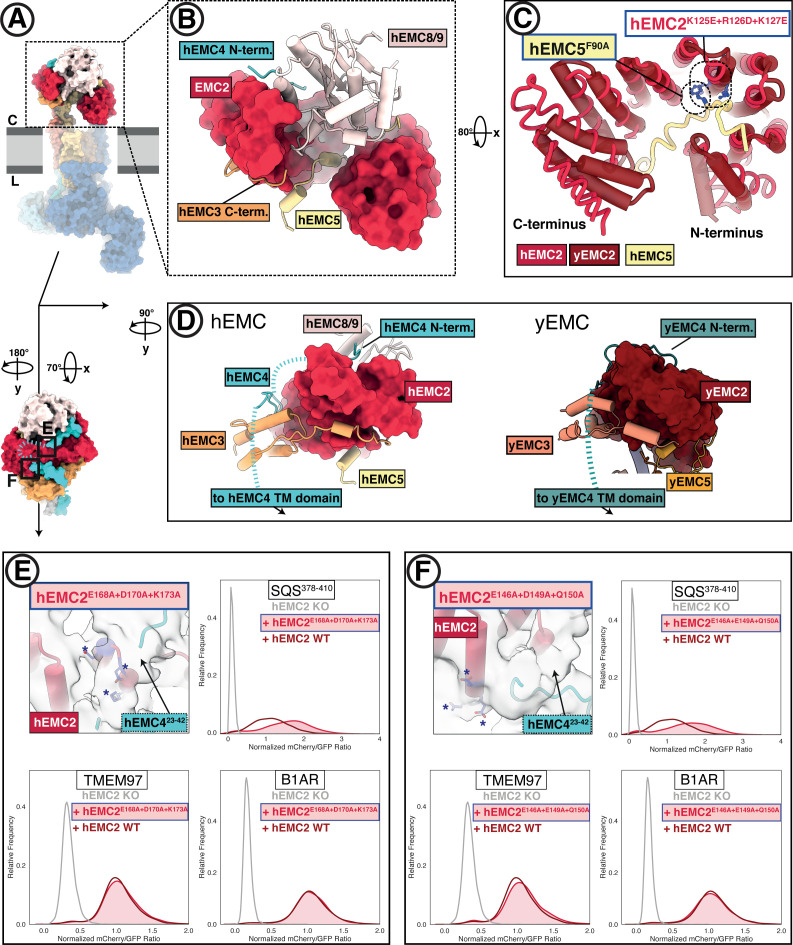
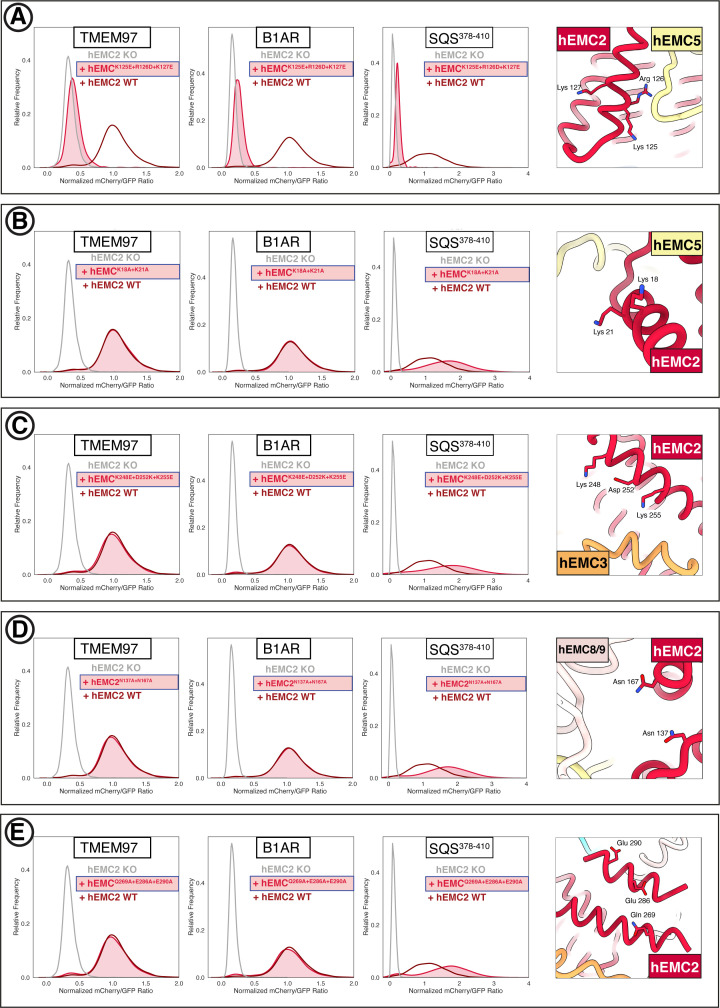
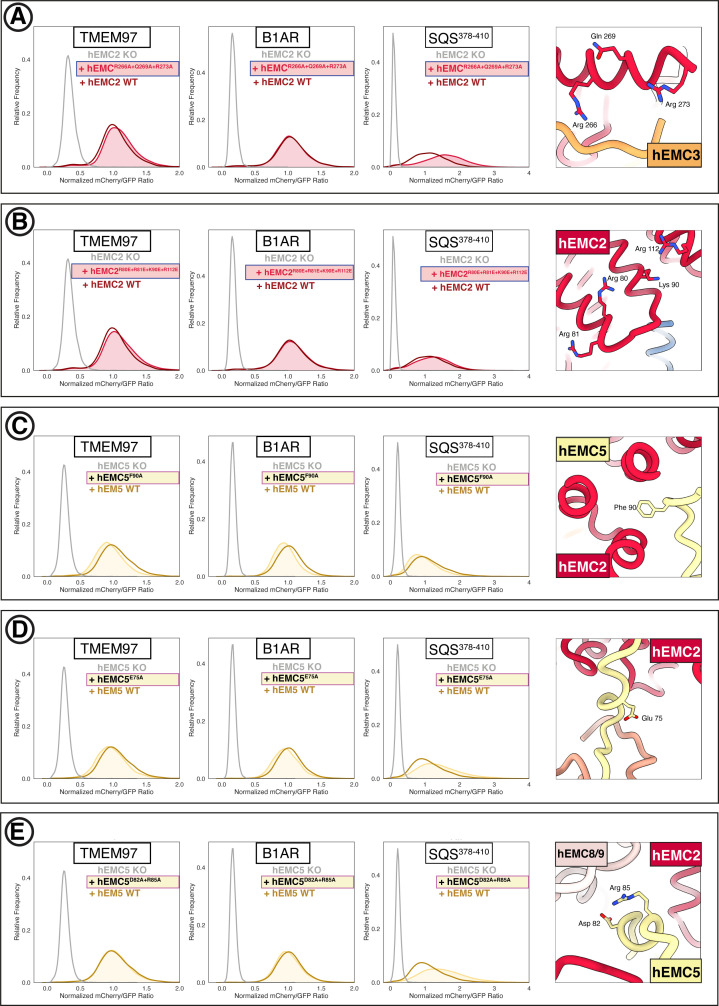
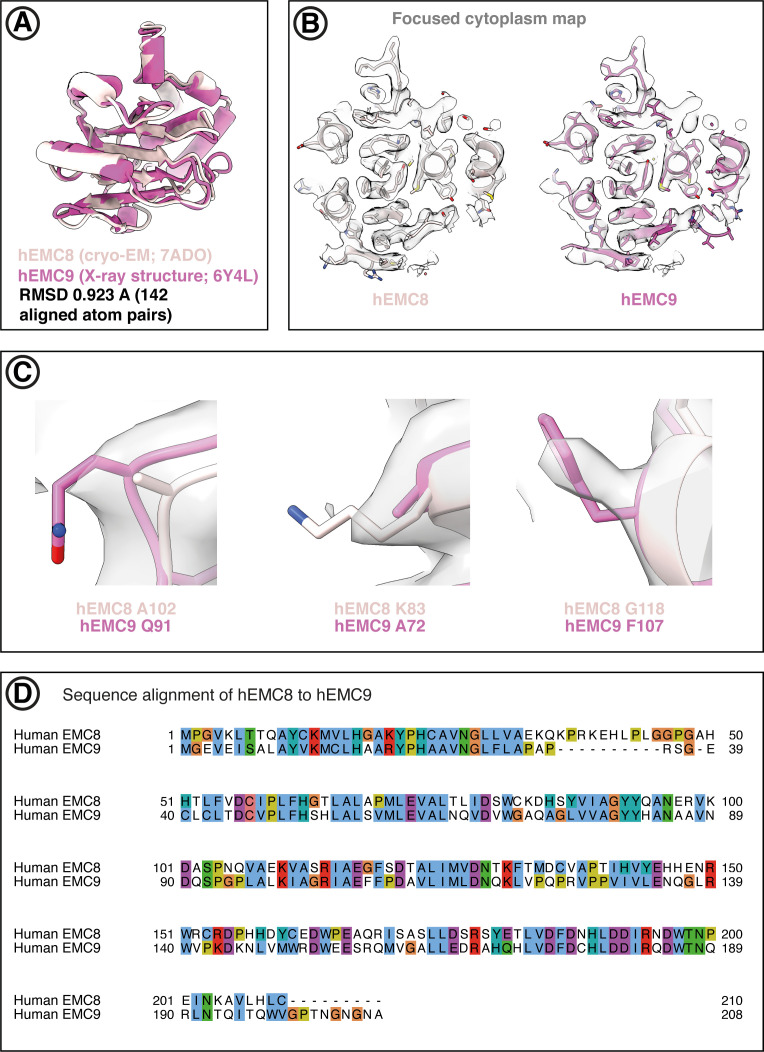
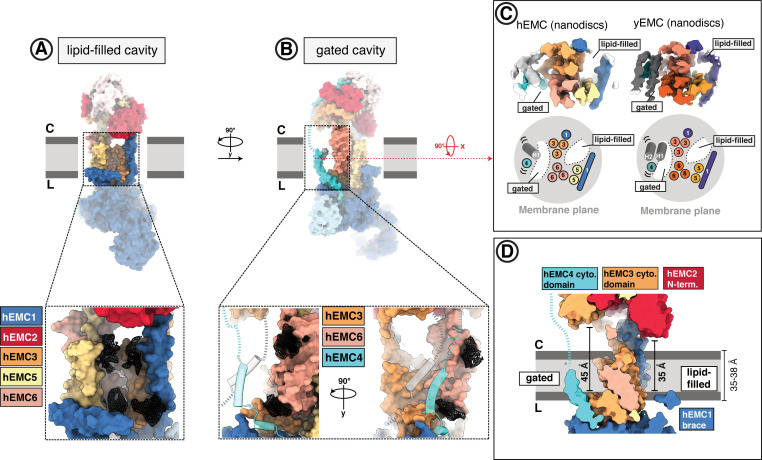
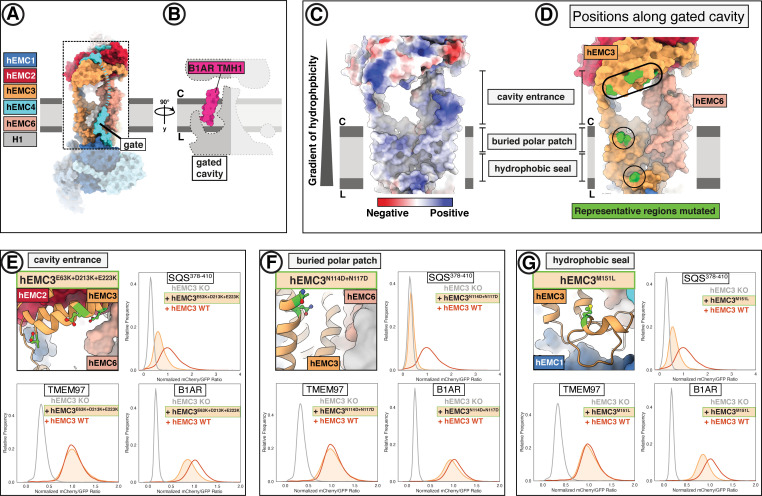
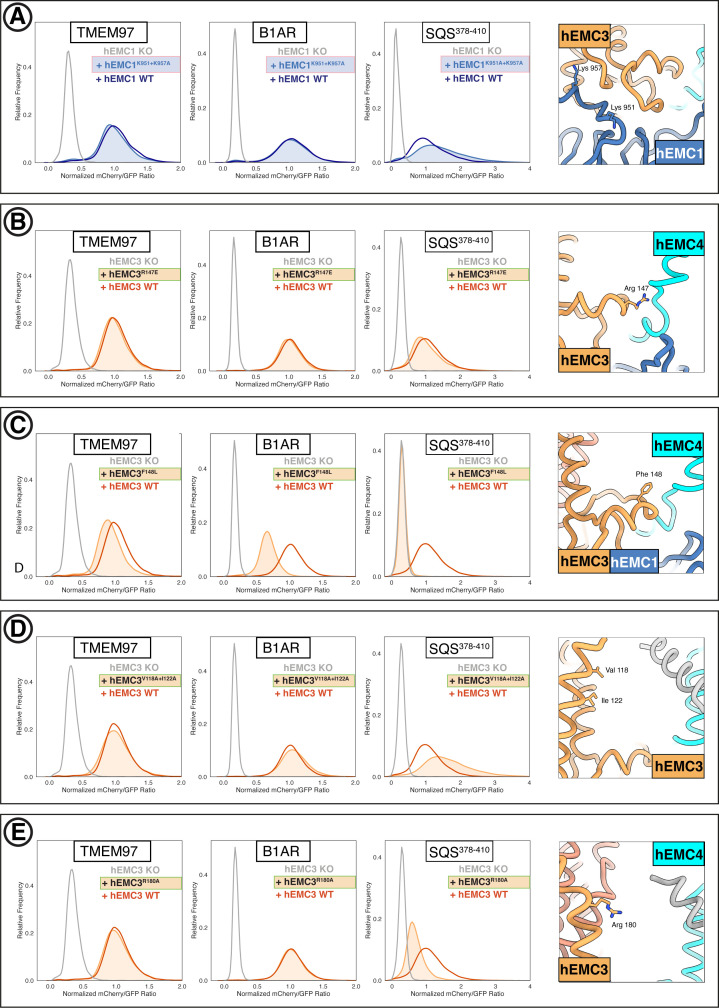
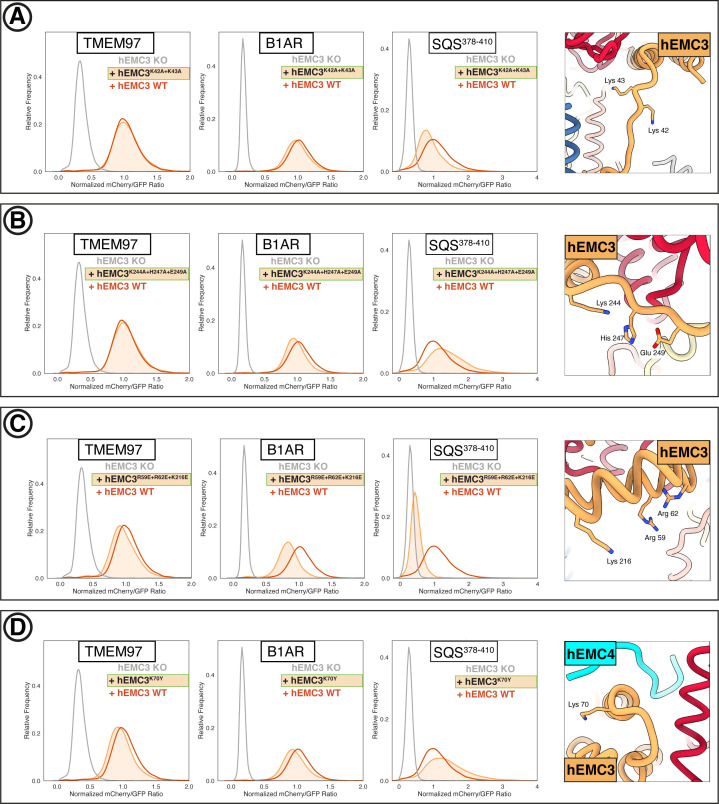
Membrane protein biogenesis in the endoplasmic reticulum (ER) is complex and failure-prone. The ER membrane protein complex (EMC), comprising eight conserved subunits, has emerged as a central player in this process. Yet, we have limited understanding of how EMC enables insertion and integrity of diverse clients, from tail-anchored to polytopic transmembrane proteins. Here, yeast and human EMC cryo-EM structures reveal conserved intricate assemblies and human-specific features associated with pathologies. Structure-based functional studies distinguish between two separable EMC activities, as an insertase regulating tail-anchored protein levels and a broader role in polytopic membrane protein biogenesis. These depend on mechanistically coupled yet spatially distinct regions including two lipid-accessible membrane cavities which confer client-specific regulation, and a non-insertase EMC function mediated by the EMC lumenal domain. Our studies illuminate the structural and mechanistic basis of EMC's multifunctionality and point to its role in differentially regulating the biogenesis of distinct client protein classes.

Keywords: EMC; S. cerevisiae; cell biology; chaperone holdase; electron microscopy; endoplasmic reticulum; human; insertase; membrane protein biogenesis; molecular biophysics; structural biology.

Plain language summary

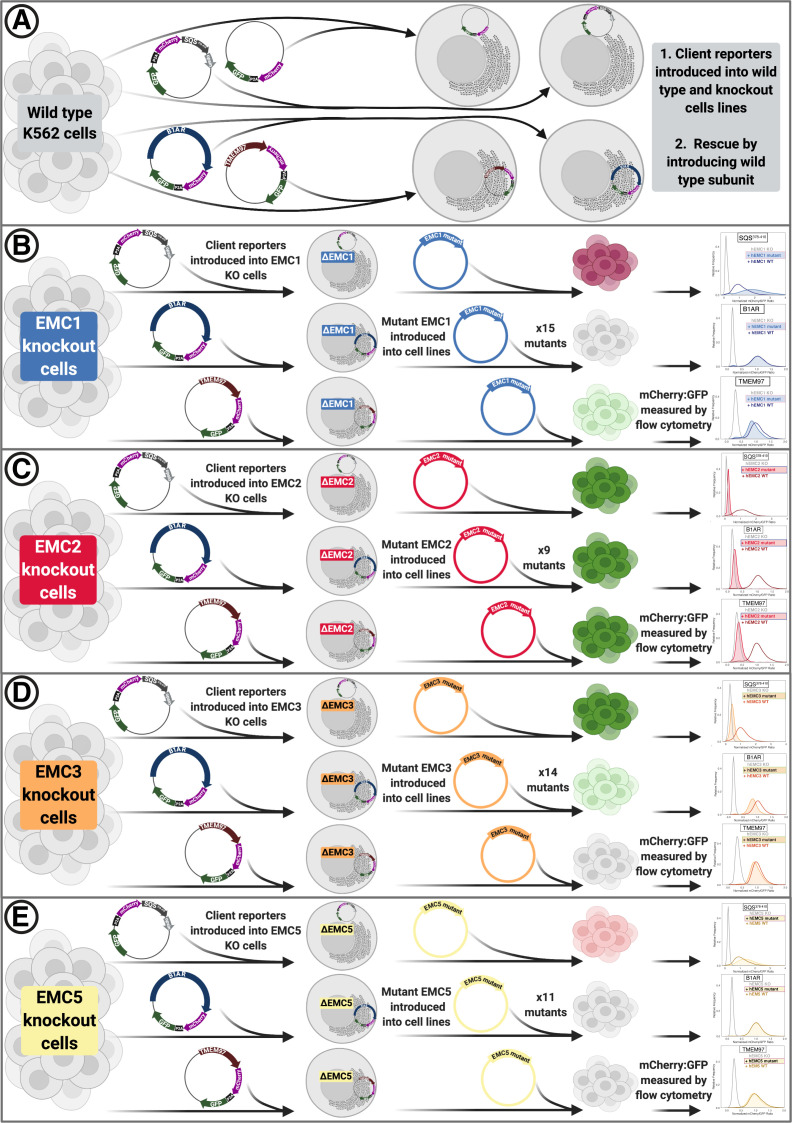
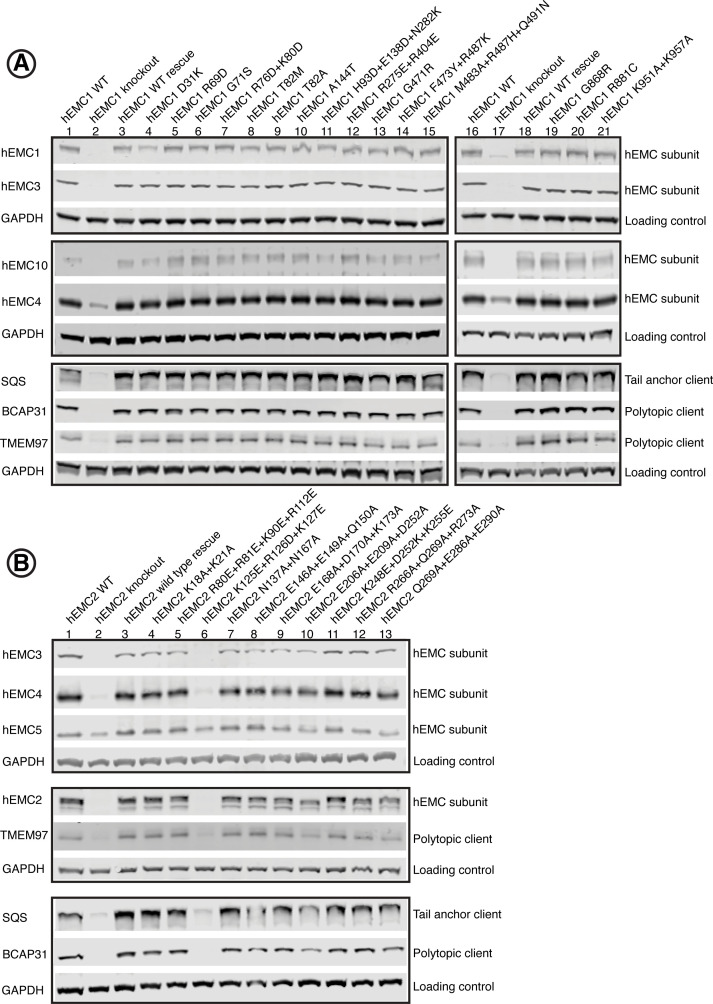
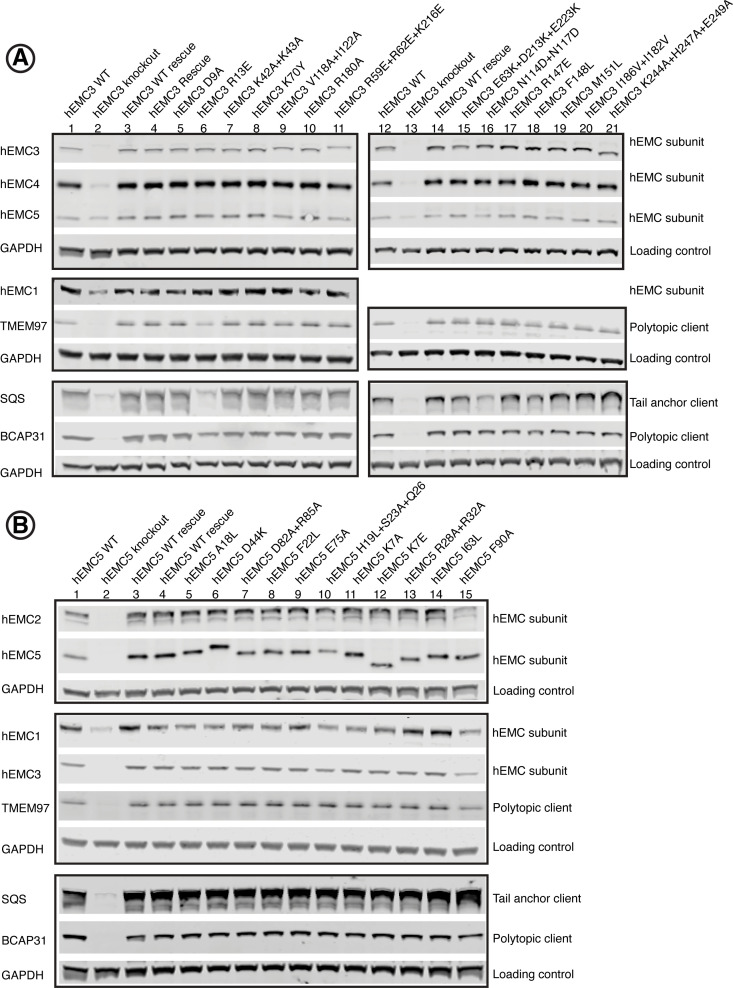
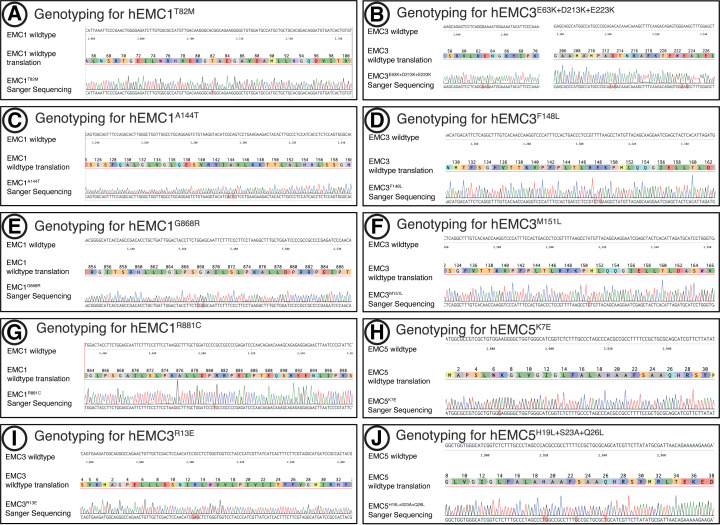
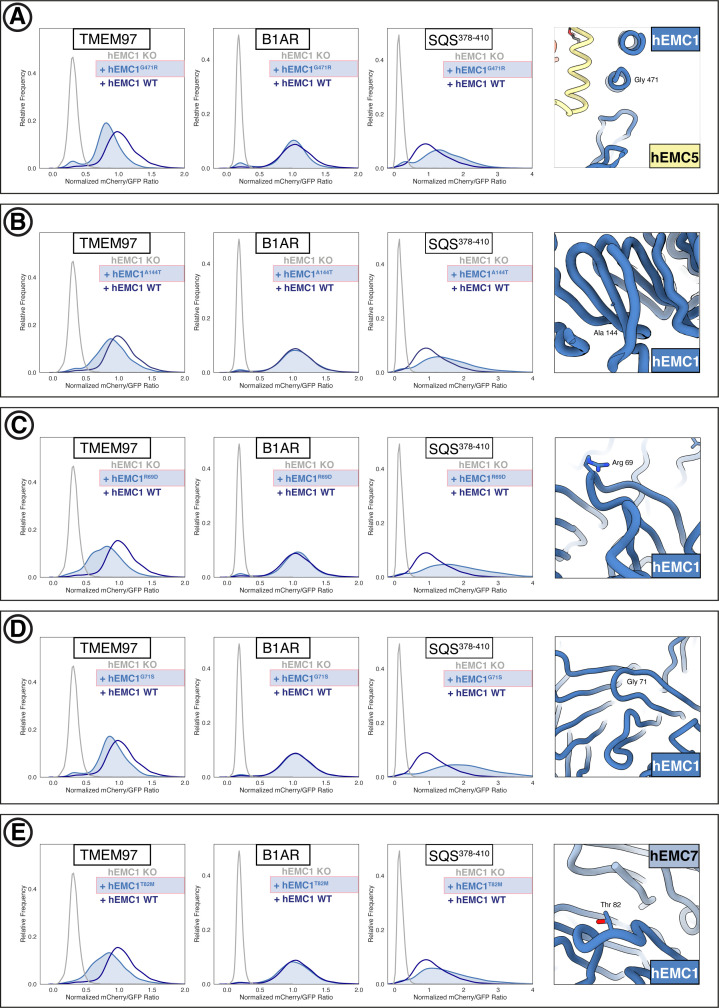
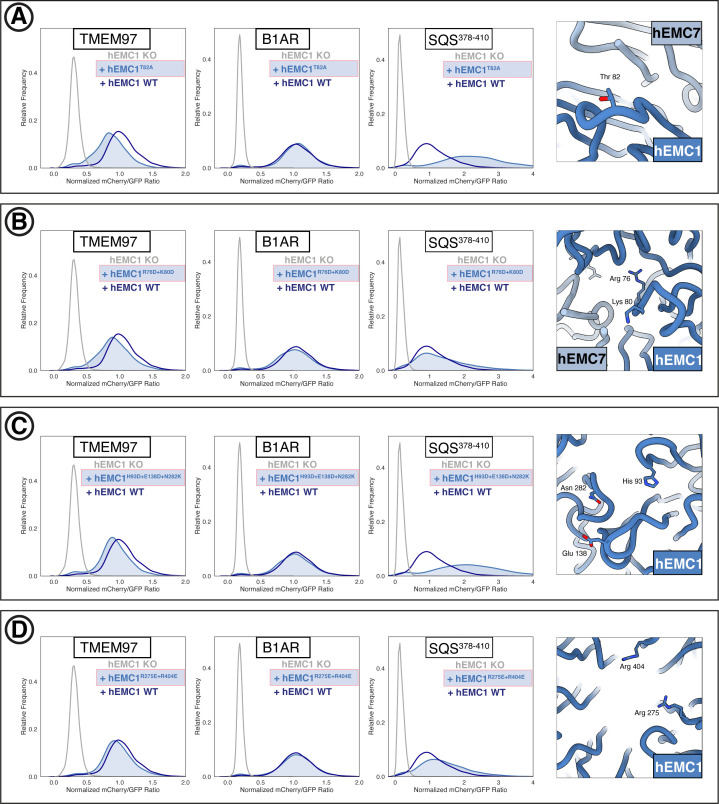
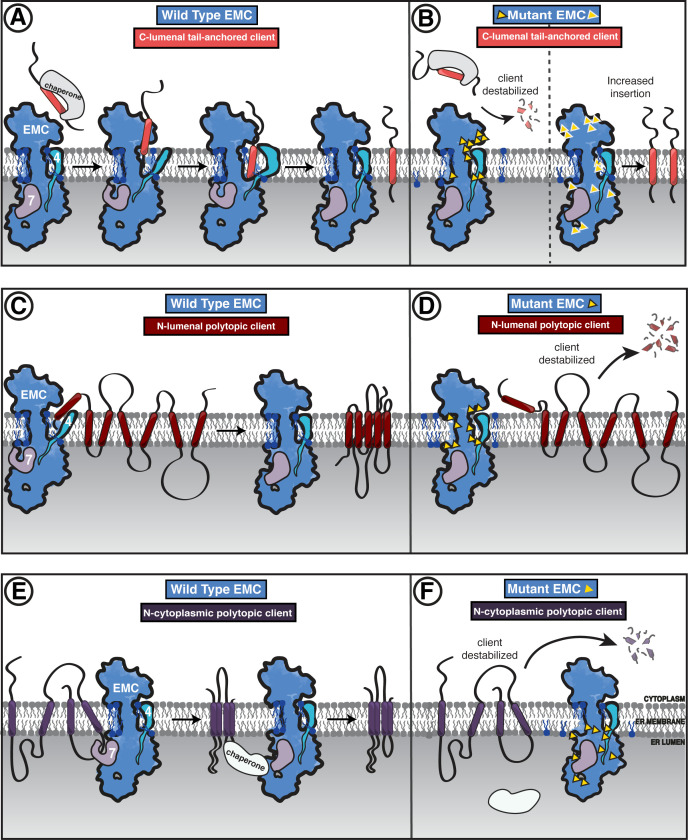
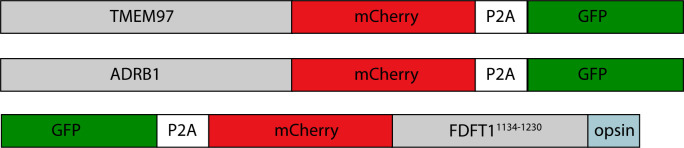
Cells are surrounded and contained by a plasma membrane consisting of a double layer of fats and proteins. These proteins monitor and facilitate the movement of food, oxygen and messages in and out of the cell, and help neighboring cells communicate. Membrane proteins are manufactured in a cell compartment called the endoplasmic reticulum. Cellular machines called ribosomes visit this compartment’s membrane to manufacture proteins that need to be secreted or embedded into the cell’s membranes. As these proteins are made, they are pulled into the endoplasmic reticulum so they can be folded correctly and inserted in the membrane. A cellular machine in this compartment’s membrane that aids this process is the endoplasmic reticulum membrane protein complex (EMC). Many steps can go wrong during protein assembly, so to control protein quality, the EMC has to accommodate the variety of complex physical features that proteins can have. To explore the activity of the EMC, Miller-Vedam, Bräuning, Popova et al. studied the normal structure of the EMC in both yeast and human cells grown in the lab. These snapshots of the complex in different species had a lot in common, including how the complex was arranged within and around the membrane. Next, Miller-Vedam, Bräuning, Popova et al. generated 50 mutant versions of the EMC in human cells to determine how changing different parts of the complex affected the production of three proteins that rely on the EMC to fold correctly. These proteins were an enzyme called squalene synthase, a signaling protein called the beta adrenergic receptor and sigma intracellular receptor 2, a protein involved in the regulation of cholesterol levels. Mutations in the section of the EMC outside of the endoplasmic reticulum, within the main cellular compartment, negatively impacted the stability of squalene synthase. This section of the EMC provides a platform where proteins can associate before entering the membrane. The part of EMC that spans the membrane contains both a fat-filled cavity and a cavity with a ‘door’ that is either open or closed. Mutations in this section disrupted the insertion of both squalene synthase and the beta adrenergic receptor into the membrane, a role performed by the cavity with the door. The specific role of the fat-filled cavity is still not fully understood, but a mutation affecting this cavity disrupts the correct production of all three proteins studied. The largest section of the complex, which sits inside the endoplasmic reticulum, protected proteins as they folded, ensuring they were not destroyed for being folded incorrectly before they were fully formed. Mutations in this part of the EMC negatively impacted the stability of sigma intracellular receptor 2 without negatively affecting the other proteins. This molecular dissection of the activity of the EMC provides insights into how membrane proteins are manufactured, stabilized, coordinated, and monitored for quality. These findings could contribute towards the development of new treatments for certain congenital diseases. For example, cystic fibrosis, retinitis pigmentosa, and Charcot-Marie-Tooth disease are all thought to be caused by mutations within membrane proteins that require the EMC during their production.


Conflict of interest statement

LM, BB, KP, NS, JB, JP, EB, NS, MS, RS, CC, BS, AF, JW No competing interests declared

Figures

Figure 1.
Figure 1.. Experimental strategy for the dissection of EMC function.
Schematic representation of the combined structural and mutational approach to dissect EMC function. (A) yEMC was purified either by overexpression of all subunits together and affinity pulldown with 3xFlag-tagged yEMC5 or by pulldown of endogenous yEMC proteins using an affinity pulldown with 3xFlag-tagged yEMC5. For hEMC, all subunits were overexpressed together with Flag-tagged EMC5 via a single recombinant BacMam virus. Both yEMC and hEMC were purified by column chromatography and subjected to cryo-EM analysis. (B) The obtained collection of cryo-EM structures of yEMC and hEMC in lipid nanodiscs or detergent micelles were compared to identify similarities and differences. (C) Structure-guided mutagenesis was performed across four core hEMC subunits: hEMC1, hEMC2, hEMC3, and hEMC5 in mammalian K562 cells. (D) Each hEMC subunit knockout (KO) cell line was individually transduced with three different fluorescent client reporters: SQS378-410, full-length B1AR, and full-length TMEM97. Mutant hEMC subunits were then introduced into the corresponding subunit KO cell lines carrying each of the three fluorescent hEMC client reporters. hEMC client stability in each mutant hEMC subunit cell line was assessed by quantifying the mCherry-to-GFP ratio. Western blotting was performed for each mutant-transduced cell line to assess EMC integrity (by immunoblotting for hEMC subunits) as well as client stability (by immunoblotting for hEMC clients) compared against both wild-type (WT) and KO cell lines.
Figure 1—figure supplement 1.
Figure 1—figure supplement 1.. Purification of yEMC.
(A) Size-exclusion chromatography (SEC) purification of overexpressed yEMC+FAb in DDM detergent micelles. (B) SEC purification of endogenous yEMC + FAb in MSP1D1 nanodisc. (C) Coomassie-stained SDS-PAGE analysis of SEC elution fractions from (A). The expected molecular weight of the subunits are as follows: yEMC1 - 87 kDa, yEMC2 - 34 kD, yEMC7 - 27 kD, yEMC10 - 25 kD, yEMC3 - 23 kD, yEMC4 - 21 kD, yEMC5-3xflag - 17 kD, yEMC6 - 12 kD. (D) Coomassie-stained SDS-PAGE analysis of SEC elution fractions from (B).
Figure 1—figure supplement 2.
Figure 1—figure supplement 2.. Purification of recombinant hEMC.
(A) Size-exclusion chromatography (SEC) purification of hEMC in GDN detergent. (B) SEC purification of hEMC reconstituted in MSP1D1 nanodiscs. (C) Coomassie-stained SDS-PAGE analysis of the SEC elution fractions from (A). The expected molecular weight of the subunits are as follows: hEMC1 - 110 kDa, hEMC2 - 35 kD, hEMC3 - 30 kD, hEMC10 - 25 kD, hEMC7 - 24 kD, hEMC8/9 - 24 kD, hEMC4 - 20 kD, hEMC5-flag - 16 kD, hEMC6 - 12 kD. (D) Coomassie-stained SDS-PAGE analysis of the SEC elution fractions from (B). (E) Mass spectrometry analysis of purified hEMC in GDN following SEC. iBAQ values for identified proteins in the sample are sorted in descending order along the X-axis. hEMC subunits form a cluster (red) and their normalized iBAQ values (against EMC5-Flag) are shown in the inset. (F) As in (E) for hEMC in lipid nanodiscs.
Figure 1—figure supplement 3.
Figure 1—figure supplement 3.. Fluorescent reporter cell line generation.
Fluorescent reporter cell lines were created by introducing lentivirus containing the fluorescently-tagged client reporters into five K562 cells lines: (1) wild type, (2) hEMC1 knockout (3) hEMC2 knockout, (4) hEMC3 knockout, and (5) hEMC5 knockout. A construct with mCherry-P2A-GFP was introduced into each cell line (control). This process was repeated individually for three tail anchor membrane proteins with N-terminal tags: one EMC-dependent tail anchor client membrane protein (SQS) and two EMC-independent tail anchor membrane proteins (SEC22B, VAMP2). This process was repeated individually for four polytopic membrane proteins with C-terminal tags: an EMC-dependent polytopic membrane protein client with the N-terminus in the ER lumen (B1AR), an EMC-dependent polytopic membrane protein client with the N-terminus in the cytoplasm (TMEM97), and two EMC-independent polytopic membrane proteins with N-termini in the cytoplasm (TRAM2, JAGN1). (A) Ratio of mCherry to GFP measured by flow cytometry for mCherry-P2A-GFP construct for each of the five cell lines. (B) Same as (A) for GFP-P2A-mCherry-SQS378-410-opsin. (C) Same as (A) for GFP-P2A-mCherry-SEC22B. (D) Same as (A) for GFP-P2A-mCherry-VAMP2. (E) Same as (A) for TMEM97-mCherry-P2A-GFP. (F) Same as (A) for B1AR-mCherry-P2A-GFP. (G) Same as (A) for TRAM2-mCherry-P2A-GFP. (H) Same as (A) for JAGN1-mCherry-P2A-GFP.
Figure 1—figure supplement 4.
Figure 1—figure supplement 4.. Overview of functional assays.
(A) Into each K562 cell line (WT or knockout of respective subunit), fluorescent client reporters were introduced lentivirally. Subsequently, knockout phenotypes were rescued by re-introducing the wild-type hEMC subunit. (B) After introducing client reporters into hEMC1 knockout cell lines cells were sorted to obtain a pure population. Then mutant hEMC subunits were re-introduced lentivirally and selected with puromycin. Upon reaching a pure population, cells lines were subjected to flow cytometry to measure abundance of mCherry and GFP for each client reporter in each mutant background. Cell pellets were collected for subsequent western blot analysis for each mutant in WT and knockout cell line in a cell line with an mCherry-P2A-GFP reporter. (C) Same as (B) for hEMC2. (D) Same as (B) for hEMC3. (E) Same as (B) for hEMC5.
Figure 1—figure supplement 5.
Figure 1—figure supplement 5.. Western blots for EMC1 and EMC2.
Western blots of endogenous human EMC subunits and client proteins functional assay to check for complex stability and endogenous protein levels. For each mutant, abundance of several hEMC subunits as well as several representative client proteins were tested. (A) Western blots for hEMC1 mutant cell lines, blotting for hEMC subunits hEMC1, hEMC3, hEMC4, and hEMC10. In addition, levels of three endogenous client proteins (SQS, BCAP31, and TMEM97) were blotted for. Wild-type cells with the fluorescent reporter displayed in Lanes 1 and 16. hEMC1 knockout cells displayed in Lanes 2 and 17. hEMC1 knockout cells with reintroduction of wild-type hEMC1 shown in Lanes 3 and 18. (B) Western blots for hEMC2 mutant cell lines, blotting for hEMC subunits hEMC2, hEMC3, hEMC4, and hEMC5. In addition, levels of three endogenous client proteins (SQS, BCAP31, and TMEM97) were blotted for. Wild-type cells with the fluorescent reporter displayed in Lane 1. hEMC2 knockout cells displayed in Lane 2. hEMC2 knockout cells with reintroduction of wild-type hEMC2 shown in Lane 3. Mutant hEMC2 E206A+E209A+D252A is in Lane 10, flow cytometry of this mutant is not included. For the remaining mutants, both western blot and flow cytometry were conducted.
Figure 1—figure supplement 6.
Figure 1—figure supplement 6.. Western blots for EMC3 and EMC5.
Human functional assay to check for complex stability. For each mutant, abundance of several EMC subunits as well as several representative client proteins was tested. (A) Western blots for hEMC3 mutant cell lines, blotting for hEMC subunits hEMC1, hEMC3, hEMC4, and hEMC5. In addition, levels of three endogenous client proteins (SQS, BCAP31, and TMEM97) were blotted for. Wild-type cells with the fluorescent reporter displayed in Lanes 1 and 12. hEMC3 knockout cells displayed in Lanes 2 and 13. hEMC3 knockout cells with reintroduction of wild-type hEMC1 shown in Lanes 3 and 14. (B) Western blots for hEMC5 mutant cell lines, blotting for hEMC subunits hEMC1, hEMC2, hEMC3, and hEMC5. In addition, levels of three endogenous client proteins (SQS, BCAP31, and TMEM97) were blotted for. Wild-type cells with the fluorescent reporter displayed in Lane 1. hEMC5 knockout cells displayed in Lane 2. hEMC5 knockout cells with reintroduction of wild-type hEMC5 shown in Lanes 3 and 4.
Figure 1—figure supplement 7.
Figure 1—figure supplement 7.. Amino acid conservation of EMC1.
(A) Yeast (yEMC sequence from uniprot entry for Saccharomyces cerevisiae EMC1, sequence identifier: P25574-1) to human (hEMC sequence from uniprot entry for Homo sapiens EMC1 sequence identifier: Q8N766-1). Sequence alignment of EMC1 by T-Coffee PSI-Coffee homology extension online server. Colored by ClustalX coloring –Blue for hydrophobic (AILMFWV); Red for positive charge (KR); Magenta for negative charge (ED); Green for polar (NQST); Pink for cysteines (C); Orange for glycines (G); Yellow for prolines (P); Cyan for aromatic (HY); No color for any residues other than proline or glycine that are not conserved. Residues represented within hEMC mutagenesis are marked with hEMC amino acid sequence numbering and (*). Transmembrane helices are outlined in black, as annotated in uniprot entries.
Figure 1—figure supplement 8.
Figure 1—figure supplement 8.. Amino acid conservation of EMC2, EMC3, EMC5.
Yeast to human sequence alignments. (A) Alignment of hEMC2 and yEMC2. Computed by t-Coffee PSI-Coffee homology extension online server. Colored by ClustalX coloring – Blue for hydrophobic (AILMFWV); Red for positive charge (KR); Magenta for negative charge (ED); Green for polar (NQST); Pink for cysteines (C); Orange for glycines (G); Yellow for prolines (P); Cyan for aromatic (HY); No color for any residues other than proline or glycine that are not conserved. Residues represented within hEMC mutagenesis experiments are marked with hEMC amino acid sequence numbering and (*). Transmembrane segments are outlined in black, as annotated in uniprot entries. (B) Same as (A) for hEMC3 and yEMC3. (C) Same as (A) for hEMC5 and yEMC5.
Figure 1—figure supplement 9.
Figure 1—figure supplement 9.. Genotyping of 10 mutants.
(A) Sanger sequencing of mutant aligned to wild-type sequence for hEMC1 T82M. (B) Sanger sequencing of mutant aligned to wild-type sequence for hEMC3 E63K+D213K+E223K. (C) Sanger sequencing of mutant aligned to wild-type sequence for hEMC1 A144T. (D) Sanger sequencing of mutant aligned to wild-type sequence for hEMC3 F148L. (E) Sanger sequencing of mutant aligned to wild-type sequence for hEMC1 G868R. (F) Sanger sequencing of mutant aligned to wild-type sequence for hEMC3 M151L. (G) Sanger sequencing of mutant aligned to wild-type sequence for hEMC1 R881C. (H) Sanger sequencing of mutant aligned to wild-type sequence for hEMC5 K7E. (I) Sanger sequencing of mutant aligned to wild-type sequence for hEMC3 R13E. (J) Sanger sequencing of mutant aligned to wild-type sequence for hEMC5 H19L+S23A+Q26L.
Figure 2.
Figure 2.. Overall structures of yeast and human EMC.
(A) Cryo-EM structure of yEMC in nanodiscs. Three orthogonal views of the yEMC cryo-EM structure shown as surface rendering. Gray bars delineate the approximate ER membrane boundaries with the cytoplasmic (C) and lumenal (L) sides indicated. The FAb molecule bound to the yEMC1 lumenal domain is colored in gray. (B) Cryo-EM structure of hEMC in nanodiscs. Labeling as in (A). (C) Subunit composition and color scheme of yEMC used throughout the manuscript. Dotted line indicates a portion of yEMC4 unresolved in the cryo-EM map and left unmodeled. (D) Subunit composition and color scheme of hEMC used throughout the manuscript. (E) Schematic depiction and comparison of the EMC architecture to known transmembrane protein biogenesis factors in the ER and the bacterial plasma membrane. Cytoplasmic, transmembrane and lumenal domains are depicted as cartoons colored red, gray and blue, respectively. E, eukaryotic; P, prokaryotic.
Figure 2—figure supplement 1.
Figure 2—figure supplement 1.. Cryo-EM reconstruction of yEMC.
(A) Representative motion-corrected micrograph for yEMC-FabE in DDM. Scale-bar = 500 Å. (B) Representative motion-corrected micrograph for yEMC-FabH in DDM. Scale-bar = 500 Å. (C–D) Gallery of 2D classes for the final consensus particle set of yEMC in DDM. (E) Angular distribution of the final consensus particle set of yEMC in DDM. (F) Gold-standard Fourier shell correlation (FSC) of the consensus yEMC DDM map. The FSC at 0.143 is indicated by a gold line. (G) A slice through the consensus yEMC DDM map colored by local resolution. (H) Representative motion-corrected micrograph for yEMC in nanodiscs. Scale-bar = 500 Å. (I) Gallery of 2D classes of yEMC in nanodiscs. (J) Angular distribution of the final consensus particle set of yEMC in nanodiscs. (K) Gold-standard Fourier shell correlation (FSC) of the consensus yEMC nanodisc map. The FSC at 0.143 is indicated by a gold line. (L) A slice through the consensus yEMC nanodisc map colored by local resolution.
Figure 2—figure supplement 2.
Figure 2—figure supplement 2.. Cryo-EM reconstruction of hEMC.
(A) Representative motion-corrected micrograph for hEMC in nanodiscs. Scale-bar = 500 Å. (B) Gallery of 2D classes for the final consensus particle set of hEMC in nanodiscs. (C) Angular distribution of the final consensus particle set of hEMC in nanodiscs. (D) Gold-standard Fourier shell correlation (FSC) of the consensus hEMC nanodisc map. The FSC at 0.143 is indicated by a blue line. (E) A slice through the consensus hEMC nanodisc map colored by local resolution. (F–J) As for (a – e) but for hEMC in detergent.
Figure 2—figure supplement 3.
Figure 2—figure supplement 3.. Cryo-EM data processing workflow for yEMC.
(A) Schematic of cryoEM data processing workflow for yEMC+Fab in b-DDM detergent micelles. (B) Schematic of cryoEM data processing workflow for yEMC+Fab in lipid nanodiscs.
Figure 2—figure supplement 4.
Figure 2—figure supplement 4.. Cryo-EM data processing workflow for hEMC.
(A) Schematic of cryoEM data processing workflow for hEMC in GDN detergent micelles. (B) Schematic of cryoEM data processing workflow for hEMC in lipid nanodiscs.
Figure 2—figure supplement 5.
Figure 2—figure supplement 5.. yEMC cryo-EM map validation.
(A) Final model-to-map FSC curve shown for yEMC in nanodiscs (left) and detergent (right). (B) Consensus yEMC nanodisc density shown superposed on the final yEMC nanodisc model. Three cytoplasmic subunit interfaces are depicted. (C) As in (B), for transmembrane subunit interfaces. (D) As in (B), for lumenal subunit interfaces.
Figure 2—figure supplement 6.
Figure 2—figure supplement 6.. hEMC cryo-EM map validation.
(A) Final model-to-map FSC curves shown for hEMC in nanodiscs (left) and detergent (right). (B) Consensus hEMC nanodisc density shown superposed on the final hEMC nanodisc model. Three cytoplasmic subunit interfaces are depicted. Cyan dashed lines correspond to an unresolved cytoplasmic loop of EMC4. (C) As in (B), for transmembrane subunit interfaces. (D) As in (B), for lumenal subunit interfaces. The right most panel depicts the sub-classified hEMC nanodisc map featuring stronger EMC7 lumenal density.
Figure 2—figure supplement 7.
Figure 2—figure supplement 7.. Subunit-subunit correspondence between yEMC and hEMC.
(A–D) EMC models from both human (A,C) and yeast (B,D) in lipid nanodiscs are colored with the same subunit color code, shown in the middle. Both cartoon ribbons and surface rendering are shown in two different views.
Figure 2—figure supplement 8.
Figure 2—figure supplement 8.. Comparison between individual yEMC and hEMC subunits.
(A–H) Each panel shows a side-by-side comparison of homologous yeast and human EMC subunits, colored from N- (blue) to C-terminus (red). Schematics above each panel depict domain organization for each subunit. TM = transmembrane helix. C = cytoplasmic. L = ER lumenal.
Figure 2—figure supplement 9.
Figure 2—figure supplement 9.. Pairwise superposition of EMC structures in the PDB.
Pairwise superpositions between hEMC and yEMC from this work and recently published EMC structures. Alignments were performed with the matchmaker command in ChimeraX, in each case aligning on the conserved core subunits EMC3 and EMC5. RMSD values for alignments between pruned atom pairs are shown. (A) Alignment on hEMC in nanodiscs (this work). (B) Alignment on yEMC in nanodiscs (this work).
Figure 3.
Figure 3.. The EMC cytoplasmic domain contains conserved functional interfaces and may engage C-tail-anchored clients directly.
(A) Position of the hEMC cytoplasmic domain relative to the membrane and the rest of the complex. Shown is the surface rendered hEMC structure reconstituted in nanodiscs. (B) EMC2 nucleates a protein-protein interaction hub in the cytoplasm. Zoomed-in view of the cytoplasmic domain from (A). EMC2 is shown as surface rendering while interacting EMC subunits are shown as cartoon cylinders. (C) EMC2 forms a TPR domain which binds EMC5. Overlaid are hEMC2 (red) and yEMC2 (dark red), illustrating the more tightly wound yEMC2 TPR solenoid. Two mutants, one in EMC5 and three in EMC2, are colored in blue, and show destabilizing phenotypes for EMC integrity. (D) A cytoplasmic cap structure involving EMC4 is conserved in yEMC and hEMC. Shown is a side-by-side comparison between the cytoplasmic domains of hEMC (left) and yEMC (right), highlighting the similar path EMC4 takes from the cytoplasmic domain toward the transmembrane domain. While an interaction surface between EMC8/9 and the EMC4 N-terminus is absent in yeast, yEMC4 binds at the top of the EMC2 TPR domain and assumes as similar position across the EMC3 cytoplasmic domain at the cytoplasm-membrane interface. (E) Fluorescent client reporter stability assay for TMEM97 (N-cytoplasmic polytopic client), B1AR (N-lumenal polytopic client) and SQS378-410 (C- lumenal tail-anchored client) in EMC2 KO cells expressing mutant hEMC2E168A+D170A+K173A (shaded) or WT hEMC2 rescue (unshaded). Shown is the model of hEMC in nanodiscs superposed with the unsharpened cryo-EM map, where the weaker density for EMC4 (23–42) becomes apparent. Mutated residues are colored blue and marked with asterisks for clarity. (F) Fluorescent client reporter stability assay, as in E, for the hEMC2E146A+E149A+Q150A mutant.
Figure 3—figure supplement 1.
Figure 3—figure supplement 1.. Flow cytometry for mutations in the EMC cytoplasmic domain.
(A) Mutant hEMC2K125E+R126D+K127E with TMEM97-mCherry, B1AR-mCherry, and mCherry-SQS378-410 cell lines. Image of hEMC ND model displaying the residues mutated. (B) Mutant hEMC2K18A+K21A with TMEM97-mCherry, B1AR-mCherry, and mCherry- SQS378-410 cell lines. Snapshot of hEMC ND model displaying the residues mutated. (C) Mutant hEMC2K248E+D252K+K255E with TMEM97-mCherry, B1AR-mCherry, and mCherry-SQScterm cell lines. Snapshot of hEMC ND model displaying the residues mutated. (D) Mutant hEMC2N137A+N167A with TMEM97-mCherry, B1AR-mCherry, and mCherry- SQS378-410 cell lines. Snapshot of hEMC ND model displaying the residues mutated. (E) Mutant hEMC2Q269A+E286A+E290A with TMEM97-mCherry, B1AR-mCherry, and mCherry- SQS378-410 cell lines. Snapshot of hEMC ND model displaying the residues mutated.
Figure 3—figure supplement 2.
Figure 3—figure supplement 2.. Additional flow cytometry for mutations in the EMC cytoplasmic domain.
(A) Mutant hEMC2R266A+Q269A+R273A with TMEM97-mCherry, B1AR-mCherry, and mCherry- SQS378-410 cell lines. Snapshot of hEMC ND model displaying the residues mutated. (B) Mutant hEMC2R80E+R81E+K90E+R112E with TMEM97-mCherry, B1AR-mCherry, and mCherry- SQS378-410 cell lines. Snapshot of hEMC ND model displaying the residues mutated. (C) Mutant hEMC5F90A with TMEM97-mCherry, B1AR-mCherry, and mCherry-SQScterm cell lines. Snapshot of hEMC ND model displaying the residues mutated. (D) Mutant hEMC5E75A with TMEM97-mCherry, B1AR-mCherry, and mCherry- SQS378-410 cell lines. Snapshot of hEMC ND model displaying the residues mutated. (E) Mutant hEMC5D82A+R85A with TMEM97-mCherry, B1AR-mCherry, and mCherry- SQS378-410 cell lines. Snapshot of hEMC ND model displaying the residues mutated.
Figure 3—figure supplement 3.
Figure 3—figure supplement 3.. Both EMC8 and EMC9 can be fitted into the hEMC cryo-EM maps.
(A) Superposition of hEMC8 (cryo-EM model, this work) and hEMC9 (X-ray model, PDB code 6Y4L) reveals strong structural homology between the two paralogous hEMC subunits. (B) Central slide through the models of hEMC8 (cryo-EM) and hEMC9 (X-ray) fitted into the hEMC nanodisc cytoplasmic focused map. (C) Representative non-conserved residues in hEMC8 and hEMC9 showing evidence of side-chain density superposition. The hEMC nanodisc cytoplasmic focused map is depicted. (D) Tcoffee sequence alignment between hEMC8 and hEMC9, displayed in Jalview and ClustalX coloring.
Figure 4.
Figure 4.. The EMC houses two transmembrane cavities with conserved core structures and distinct accessibilities.
(A) Location and composition of the lipid-filled cavity. A zoom-in view on the cavity is shown below, which is composed of EMC1, EMC3, EMC5, and EMC6. Resolved lipid densities from the cryo-EM map of hEMC in POPC nanodiscs are shown as black mesh zoned within 3 Å of modeled POPC molecules. (B) Location and composition of the gated cavity. Two orthogonal zoom-in views of the cavity are shown below, which is composed of EMC3 and EMC6. A transmembrane gate opposite the cavity wall is depicted as transparent cartoon cylinders and has contributions from the C-terminal EMC4 transmembrane helix along with up to two additional, unassigned helices. Resolved lipid densities are shown as in (A). (C) The dual-cavity architecture of the EMC transmembrane domain is conserved between yEMC and hEMC. Unsharpened cryo-EM maps of hEMC and yEMC in nanodiscs (top) are shown along with corresponding schematic representations of the spatial organization of all transmembrane helices (bottom). The gate helices of the gated cavity represent the region of highest conformational heterogeneity across our collection of EMC structures. (D) The two EMC transmembrane cavities feature distinct accessibilities. Shown is a central slice through the surface rendered hEMC nanodisc structure with the two membrane cavities on opposite sides. Measuring from the lumenal to the cytoplasmic side, gated and lipid-filled cavities measure 45 Å and 35 Å across, respectively. This suggests that the gated cavity has accessibility from the cytoplasm while the lipid-filled cavity does not.
Figure 5.
Figure 5.. EMC houses an insertase module centered on EMC3 in the gated membrane cavity.
(A) A transmembrane gate anchored in the cytosol and the lumen is a structural hallmark of the EMC gated cavity. Shown is a surface rendering of the hEMC model in lipid nanodiscs with an unresolved EMC4 connection between the cytoplasm and the membrane depicted as a dashed line. An unassigned helix of the gate is shown in gray (H1). (B) The gated cavity in the hEMC nanodisc structure has sufficient space to accommodate a client transmembrane helix. The space-filling model of the first transmembrane helix of B1AR (B1AR TMH1) is shown placed inside an outline of the EMC gated cavity. (C) A hydrophobic gradient characterizes the surface of the EMC gated cavity from the cytoplasmic to the lumenal side. Gate helices have been omitted for clarity. The surface of the hEMC nanodisc structure is colored by electrostatic surface potential ranging from −15 (red) to +15 (blue) kcal/(mol·e). (D) Distinct EMC3 regions along the gated cavity hydrophobic gradient targeted for mutagenesis. Mutated residues are colored in lime. (E) Fluorescent client reporter stability assay for the EMC3 cavity entrance mutant, hEMC3E63K+D213K+E223K. (F) As in (E) for the EMC3 buried polar patch mutant, hEMC3N114D+N117D. (G) As in (E) for the EMC3 hydrophobic seal mutant, hEMC3M151L.
Figure 5—figure supplement 1.
Figure 5—figure supplement 1.. Flow cytometry of gated cavity mutants.
(A) Mutant hEMC1K951A+K957A with TMEM97-mCherry, B1AR-mCherry, and mCherry- SQS378-410 cell lines. Snapshot of hEMC ND model displaying the residues mutated. (B) Mutant hEMC3R147E with TMEM97-mCherry, B1AR-mCherry, and mCherry- SQS378-410 cell lines. Snapshot of hEMC ND model displaying the residues mutated. (C) Mutant hEMC3F148L with TMEM97-mCherry, B1AR-mCherry, and mCherry-SQScterm cell lines. Snapshot of hEMC ND model displaying the residues mutated. (D) Mutant hEMC3V118A+I122A with TMEM97-mCherry, B1AR-mCherry, and mCherry- SQS378-410 cell lines. Snapshot of hEMC ND model displaying the residues mutated. (E) Mutant hEMC3R180A with TMEM97-mCherry, B1AR-mCherry, and mCherry- SQS378-410 cell lines. Snapshot of hEMC ND model displaying the residues mutated.
Figure 5—figure supplement 2.
Figure 5—figure supplement 2.. Additional flow cytometry of gated cavity mutants.
(A) Mutant hEMC3K42A+K43A with TMEM97-mCherry, B1AR-mCherry, and mCherry- SQS378-410 cell lines. Snapshot of hEMC ND model displaying the residues mutated. (B) Mutant hEMC3K244A+H247A+E249A with TMEM97-mCherry, B1AR-mCherry, and mCherry- SQS378-410 cell lines. Snapshot of hEMC ND model displaying the residues mutated. (C) Mutant hEMC3R59E+R62E+K216E with TMEM97-mCherry, B1AR-mCherry, and mCherry- SQS378-410 cell lines. Snapshot of hEMC ND model displaying the residues mutated. (D) Mutant hEMC3K70Y with TMEM97-mCherry, B1AR-mCherry, and mCherry-SQScterm cell lines. Snapshot of hEMC ND model displaying the residues mutated.
Figure 5—figure supplement 3.
Figure 5—figure supplement 3.. Comparison of EMC3 to YidC-family members.
Structure and sequence comparison between EMC3 and YidC-family proteins. (A) Side-by-side structure view of human EMC3, yeast EMC3, E. coli YidC, and M. jannaschii YidC-like protein. hEMC3 and yEMC are displayed within the context of the EMC complex. EMC3 and YidC subunits are colored from the N-terminus (blue) to the C-terminus (red). (B) Amino acid sequence alignment between human EMC3, yeast EMC3, E. coli YidC, and M. jannaschii YidC-like protein. Alignment from T-Coffee online server. Conserved residues colored in shades of blue to indicate degree of conservation.
Figure 5—figure supplement 4.
Figure 5—figure supplement 4.. Resolved lipid densities in hEMC and yEMC nanodisc maps.
(A) Resolved lipids in the hEMC gated cavity. Left: The hEMC model is shown as surface rendering, colored by molecular lipophilicity potential (mint = hydrophilic, gold = hydrophobic). Black mesh corresponds to the hEMC consensus nanodisc map zoned within 3 Å of the modeled POPC molecules. Enlarged views of lipid densities are shown, although the second lipid on the lumenal side of the cavity is shown with the corresponding zoned Sidesplitter hEMC nanodisc map. Since this particular lipid molecule shows only weak features in the consensus map, it is left unmodeled in the hEMC nanodisc model. Right: The yEMC model is shown as surface rendering, colored by molecular lipophilicity potential. One POPC lipid is modeled at the lumenal side of the yEMC gated cavity and shown is an enlarged view from the yEMC consensus nanodisc map zoned within 3 Å of a modeled POPC molecule. (B) Same view as in (a), with the hEMC model molecular surface colored according to amino acid conservation. (C) As for (A) but for the hEMC lipid-filled cavity. (D) Same view as in (C), with the hEMC model molecular surface colored according to amino acid conservation.
Figure 5—figure supplement 5.
Figure 5—figure supplement 5.. Comparison of gate conformations.
(A) Comparison of gate helix conformations across hEMC and yEMC structures. In each panel, the model of hEMC in nanodiscs is shown as ribbons (color-coded as elsewhere in the manuscript). Cryo-EM maps were aligned on their transmembrane cores and gate helices segmented, with the EMC4 transmembrane helix colored cyan and unassigned gate helices colored gray. (B) Comparison of gate helix densities in cryo-EM maps of hEMC (O'Donnell et al., 2020) and yEMC (Bai et al., 2020), the latter of which was smoothed by Gaussian filtering for clarity. Panels are in same view as (A), with the hEMC model from this work shown as colored ribbons. (C) Topology diagrams of EMC4, EMC7, and EMC10. Based on resolved N- and C-terminal domains of EMC4 in our hEMC structure, EMC4 can possess either one or two transmembrane domains, the latter scenario proposed by Bai et al., 2020 and O'Donnell et al., 2020. The resolved EMC7 and EMC10 N-terminal lumenal domains in our yEMC and hEMC structures orient their C-terminal, predicted transmembrane helices, toward the membrane. (D) Unsharpened maps of the gate helix densities from yEMC in nanodiscs. The assigned C-terminal EMC4 transmembrane helix is colored cyan, whereas two unassigned helices are colored gray. (E) Predicted transmembrane helices for EMC4, EMC7, and EMC10 were extracted from full-sequence prediction models generated with Robetta (robetta.bakerlab.org). (F) Predicted transmembrane helices for EMC7 and EMC10 were docked into the unassigned gate helix densities. (G) Predicted transmembrane helices for EMC4 were docked into the unassigned gate helix densities.
Figure 6.
Figure 6.. A lipid-filled cavity in the EMC transmembrane domain stabilizes disparate client proteins.
(A) An EMC1 amphipathic brace helix delineates the boundary of the lipid-filled transmembrane cavity and packs against EMC5. Shown is a surface rendering of the hEMC model in nanodiscs. EMC4, EMC5, EMC6, and EMC1 subunits all contribute to the cavity lining. (B) The lipid-filled cavity in the hEMC nanodisc is occupied by several lipid molecules. Cartoon outlines of the gated cavity illustrate that the cavity could in principle allow for occupancy of a client helix (B1AR TMH1), possibly by lipid displacement or movement of the EMC1 brace helix. (C) The lipid-filled cavity has a uniform hydrophobic lining. Shown is an electrostatic surface rendering of the hEMC nanodisc structure colored as in Figure 5C. The cytoplasm-membrane interface contains positively charged residues and the lumenal interface contains negatively charged residues. Modeled phospholipid molecules are displayed in black. (D) Lipid-proximal and brace interface residues targeted for mutagenesis. Selected regions targeted for mutagenesis are colored in magenta and include brace interface mutations both in EMC1 and EMC5, as well as a lipid-proximal residue in EMC3. (E) Fluorescent client reporter stability assay for the hEMC3R13E mutant, which is in close proximity to a modeled POPC molecule. (F) As in (E) for the hEMC5H19L+S23A+Q26L mutant, which sits at the interface to the EMC1 amphipathic brace helix. (G) As in (E) for the hEMC1F473Y+R487K mutant, which sits at the interface to the EMC5 transmembrane helices.
Figure 6—figure supplement 1.
Figure 6—figure supplement 1.. Flow cytometry of lipid-filled cavity mutants.
(A) Mutant hEMC5K7E with TMEM97-mCherry, B1AR-mCherry, and mCherry- SQS378-410 cell lines. Snapshot of hEMC ND model displaying the residues mutated. (B) Mutant hEMC5K7A with TMEM97-mCherry, B1AR-mCherry, and mCherry- SQS378-410 cell lines. Snapshot of hEMC ND model displaying the residues mutated. (C) Mutant hEMC3I182V+I186V with TMEM97-mCherry, B1AR-mCherry, and mCherry- SQS378-410 cell lines. Snapshot of hEMC ND model displaying the residues mutated. (D) Mutant hEMC5I63L with TMEM97-mCherry, B1AR-mCherry, and mCherry- SQS378-410 cell lines. Snapshot of hEMC ND model displaying the residues mutated. (E) Mutant hEMC5A18L with TMEM97-mCherry, B1AR-mCherry, and mCherry- SQS378-410 cell lines. Snapshot of hEMC ND model displaying the residues mutated.
Figure 6—figure supplement 2.
Figure 6—figure supplement 2.. Additional flow cytometry of lipid-filled cavity mutants.
(A) Mutant hEMC5F22L with TMEM97-mCherry, B1AR-mCherry, and mCherry- SQS378-410 cell lines. Snapshot of hEMC ND model displaying the residues mutated. (B) Mutant hEMC1M483A+R487H+Q491N with TMEM97-mCherry, B1AR-mCherry, and mCherry- SQS378-410 cell lines. Snapshot of hEMC ND model displaying the residues mutated. (C) Mutant hEMC5D44K with TMEM97-mCherry, B1AR-mCherry, and mCherry- SQS378-410 cell lines. Snapshot of hEMC ND model displaying the residues mutated. (D) Mutant hEMC5R28A+R32A with TMEM97-mCherry, B1AR-mCherry, and mCherry- SQS378-410 cell lines. Snapshot of hEMC ND model displaying the residues mutated. (E) Mutant hEMC3D9A with TMEM97-mCherry, B1AR-mCherry, and mCherry- SQS378-410 cell lines. Snapshot of hEMC ND model displaying the residues mutated.
Figure 7.
Figure 7.. The large EMC lumenal domain is the site for several annotated disease mutations.
(A) Two views of the hEMC nanodisc structure. Two beta propellers are present in EMC1, one proximal to the membrane and one distal. (B) EMC1 is the largest EMC subunit and differs in size between yeast and human. Shown are human EMC1 (nanodisc), an overlay of human and yeast EMC1 (both nanodisc), and yeast EMC1 (nanodisc). (C) The hEMC1R881C mutant sits near the EMC4 lumenal gate anchor. Left: Location of the mutation (colored pink). Right: Fluorescent client R881C reporter stability assay for hEMC1. (D) As in (C) for for the hEMC1G868R mutant. (E) As in (C) for the hEMC1D31K mutant.
Figure 7—figure supplement 1.
Figure 7—figure supplement 1.. Conformational heterogeneity of the hEMC lumenal domain between detergent and nanodisc maps.
(A) Superposition of hEMC in detergent (green) and nanodiscs (color-coded). Models were aligned on hEMC2 (cytoplasm) and hEMC5 (transmembrane), revealing a rotation of the lumenal domain. (B) Enlarged view on the superposition around the area of the hEMC1 brace and the membrane proximal beta-propeller. A helix leading toward the amphipathic brace is resolved in the nanodisc map and disordered in the detergent map. In the nanodisc structure, several proximal propeller loops approach and form stabilizing interactions with the leading helix (dashed circle). (C) Enlarged view on the superposition around the area of the lumenal hydrophobic seal of the gated cavity. The loop stabilized by hEMC1R881 (corresponding to the disease mutant R881C) is well resolved in the hEMC nanodisc map and more disordered in the detergent map. The loops of the hEMC3 hydrophobic seal shift concomitantly with the lumenal rotation between detergent and nanodisc structures. (D) Structural alignment of hEMC1 from the detergent (green) and nanodisc (blue) models. While the beta-propellers align extremely well, a clear rotation of the hEMC1 brace and the hEMC1 transmembrane helix can be observed.
Figure 7—figure supplement 2.
Figure 7—figure supplement 2.. Flow cytometry of lumenal domain mutants.
(A) Mutant hEMC1G471R with TMEM97-mCherry, B1AR-mCherry, and mCherry- SQS378-410 cell lines. Snapshot of hEMC ND model displaying the residues mutated. (B) Mutant hEMC1A144T with TMEM97-mCherry, B1AR-mCherry, and mCherry- SQS378-410 cell lines. Snapshot of hEMC ND model displaying the residues mutated. (C) Mutant hEMC1R69D with TMEM97-mCherry, B1AR-mCherry, and mCherry- SQS378-410 cell lines. Snapshot of hEMC ND model displaying the residues mutated. (D) Mutant hEMC1G71S with TMEM97-mCherry, B1AR-mCherry, and mCherry- SQS378-410 cell lines. Snapshot of hEMC ND model displaying the residues mutated. (E) Mutant hEMC1T82M with TMEM97-mCherry, B1AR-mCherry, and mCherry- SQS378-410 cell lines. Snapshot of hEMC ND model displaying the residues mutated.
Figure 7—figure supplement 3.
Figure 7—figure supplement 3.. Additional flow cytometry of lumenal domain mutants.
(A) Mutant hEMC1T82A with TMEM97-mCherry, B1AR-mCherry, and mCherry- SQS378-410 cell lines. Snapshot of hEMC ND model displaying the residues mutated. (B) Mutant hEMC1R76D+K80D with TMEM97-mCherry, B1AR-mCherry, and mCherry- SQS378-410 cell lines. Snapshot of hEMC ND model displaying the residues mutated. (C) Mutant hEMC1H93D+E138D+N282K with TMEM97-mCherry, B1AR-mCherry, and mCherry- SQS378-410 cell lines. Snapshot of hEMC ND model displaying the residues mutated. (D) Mutant hEMC1R275E+R404E with TMEM97-mCherry, B1AR-mCherry, and mCherry- SQS378-410 cell lines. Snapshot of hEMC ND model displaying the residues mutated.
Figure 8.
Figure 8.. Model of coordinated EMC functions.
(A) Model of EMC insertase function for a C-lumenal tail-anchored client. Cytosolic factors bring post-translationally localized clients to the ER. Then the client engages the EMC cytoplasmic domain. The polar roof modulates entry into the gated cavity. A hydrophobic slide facilitates the client helix fully entering the cavity. A lateral movement of the gate releases the client helix into the membrane and the EMC gate closes. (B) Our mutagenesis data provide the following insights into EMC regions of functional importance for each of the three client types we tested. Mutants are depicted by yellow triangles. Tail-anchored client (coral) abundance was depleted upon mutagenesis of the cytoplasmic domain entrance to the gated cavity, polar and charged residues at the cytoplasm-membrane boundary, residues along the length of the gated cavity, in the hydrophobic seal to the lumen, and lipid interacting residues in both cavities (left). We also observed a subset of mutants that resulted in higher levels of the C-lumenal tail-anchored client (right) that are positioned in the cytoplasmic domain cap, throughout the ER lumenal domain, and one mutation at the center of the gated cavity. (C) The EMC facilitates biogenesis of N-lumenal polytopic client protein B1AR (dark red). (D) Regions important for B1AR stability primarily map to the transmembrane region of the EMC structure, with depletion observed for lipid proximal residues on both sides of the cavity, the polar entrance roof of the gated cavity, and the EMC1 brace helix. (E) The EMC facilitates biogenesis of N-cytoplasmic polytopic client protein TMEM97 (dark purple). (F) Regions important for TMEM97 stability were primarily located in the lumenal domain spanning both propellers, in EMC1. In addition to these lumenal regions, there was a depletion of TMEM97 at the lipid-interacting positions at the lumenal interface of both membrane cavities of the EMC. Figure - Figure Supplement legends.
Scheme 1.
Scheme 1.. Client reporters.
Scheme 2.
Scheme 2.. hEMC subunit mutation construct design.

Similar articles

Cited by

References

    1. Abu-Safieh L, Alrashed M, Anazi S, Alkuraya H, Khan AO, Al-Owain M, Al-Zahrani J, Al-Abdi L, Hashem M, Al-Tarimi S, Sebai MA, Shamia A, Ray-Zack MD, Nassan M, Al-Hassnan ZN, Rahbeeni Z, Waheeb S, Alkharashi A, Abboud E, Al-Hazzaa SA, Alkuraya FS. Autozygome-guided exome sequencing in retinal dystrophy patients reveals pathogenetic mutations and novel candidate disease genes. Genome Research. 2013;23:236–247. doi: 10.1101/gr.144105.112. - DOI - PMC - PubMed
    1. Adams PD, Afonine PV, Bunkóczi G, Chen VB, Echols N, Headd JJ, Hung LW, Jain S, Kapral GJ, Grosse Kunstleve RW, McCoy AJ, Moriarty NW, Oeffner RD, Read RJ, Richardson DC, Richardson JS, Terwilliger TC, Zwart PH. The Phenix software for automated determination of macromolecular structures. Methods. 2011;55:94–106. doi: 10.1016/j.ymeth.2011.07.005. - DOI - PMC - PubMed
    1. Afonine PV, Poon BK, Read RJ, Sobolev OV, Terwilliger TC, Urzhumtsev A, Adams PD. Real-space refinement in PHENIX for cryo-EM and crystallography. Acta Crystallographica. Section D, Structural Biology. 2018;74:531–544. doi: 10.1107/S2059798318006551. - DOI - PMC - PubMed
    1. Amberger JS, Bocchini CA, Scott AF, Hamosh A. OMIM.org: leveraging knowledge across phenotype-gene relationships. Nucleic Acids Research. 2019;47:D1038–D1043. doi: 10.1093/nar/gky1151. - DOI - PMC - PubMed
    1. Anghel SA, McGilvray PT, Hegde RS, Keenan RJ. Identification of Oxa1 homologs operating in the eukaryotic endoplasmic reticulum. Cell Reports. 2017;21:3708–3716. doi: 10.1016/j.celrep.2017.12.006. - DOI - PMC - PubMed

Publication types

MeSH terms

Substances