Review
. 2021 Feb;29(1):13-39.
doi: 10.1016/j.mric.2020.09.002.

High-resolution Structural Magnetic Resonance Imaging and Quantitative Susceptibility Mapping

Affiliations
Review

High-resolution Structural Magnetic Resonance Imaging and Quantitative Susceptibility Mapping

Vivek Yedavalli et al. Magn Reson Imaging Clin N Am. 2021 Feb.

Abstract

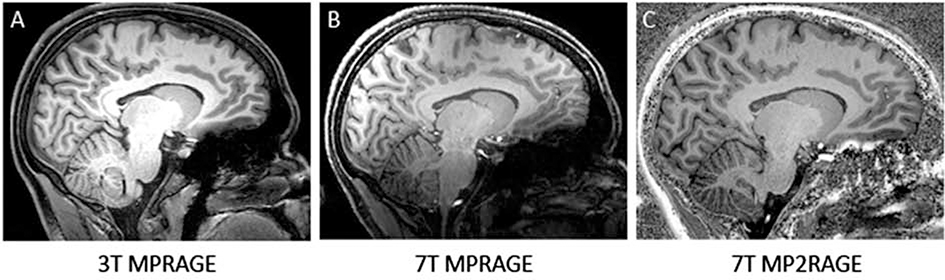
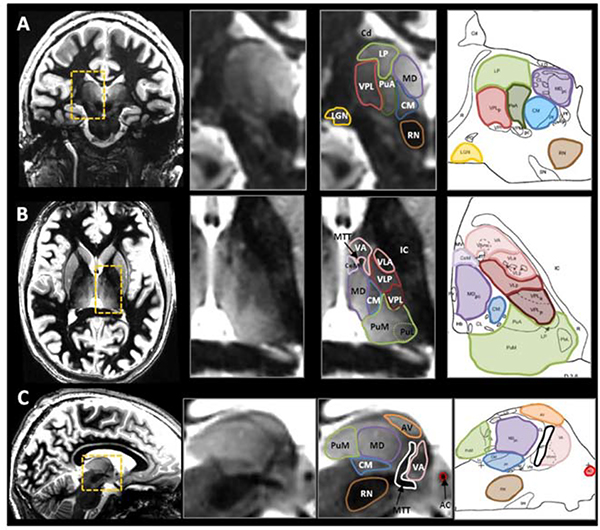
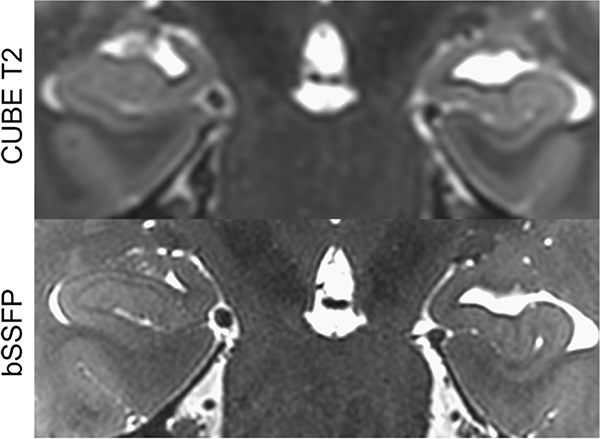
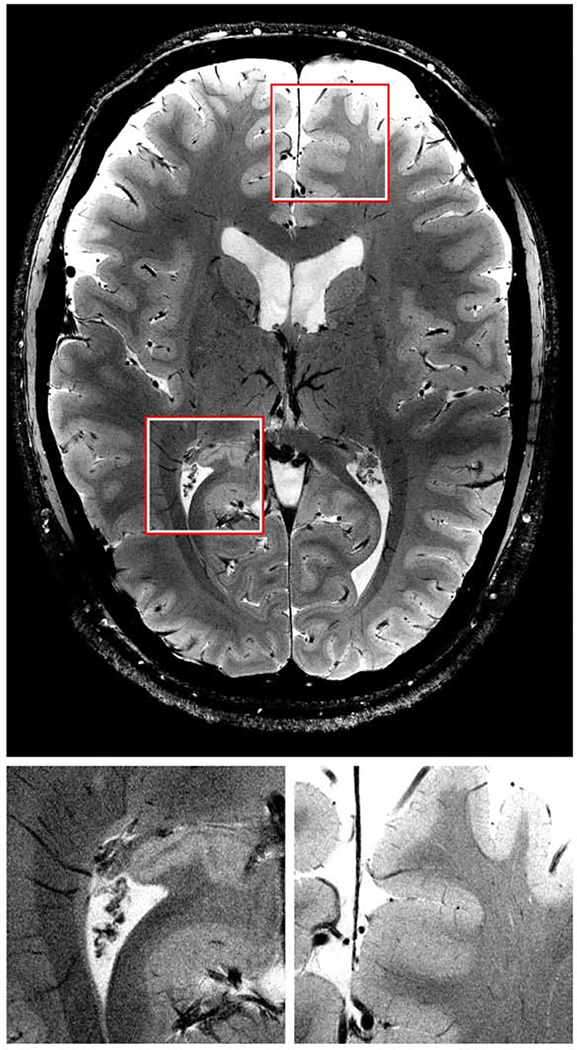
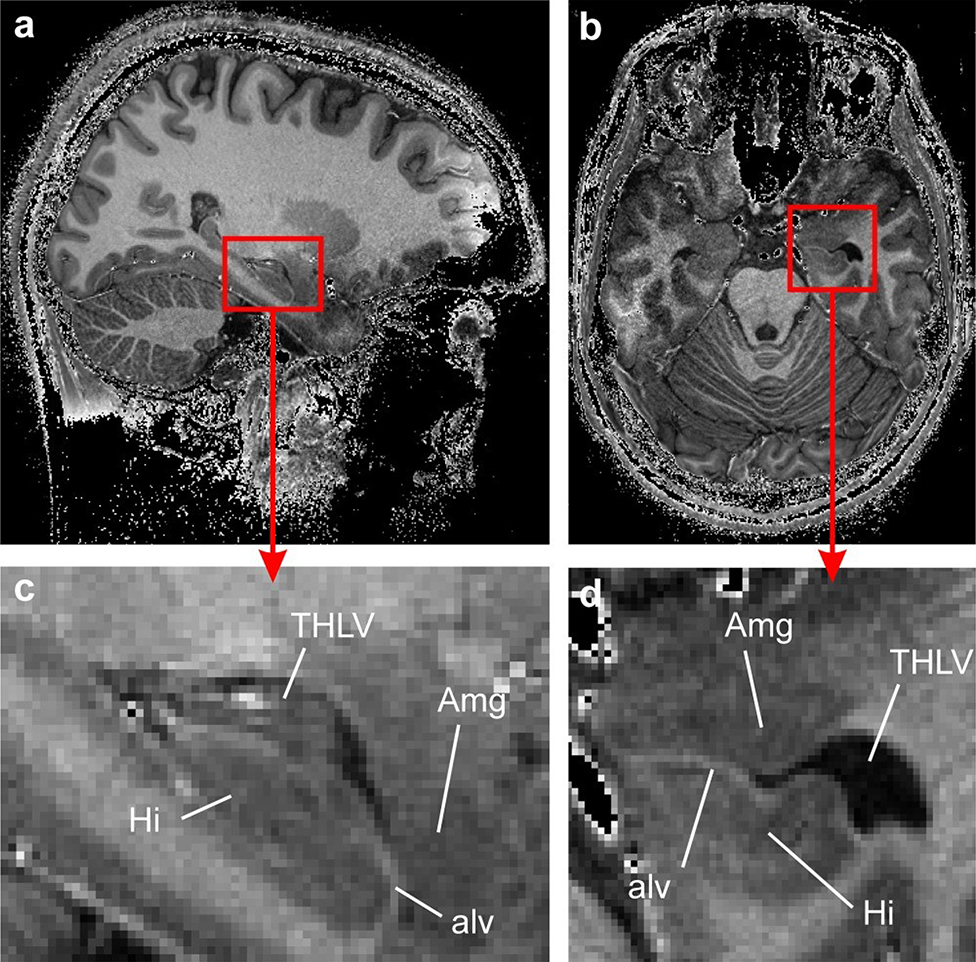
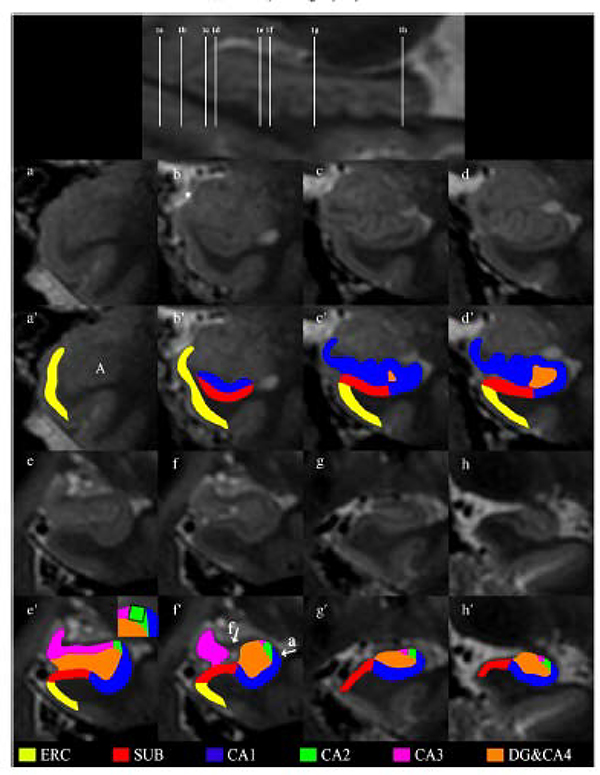
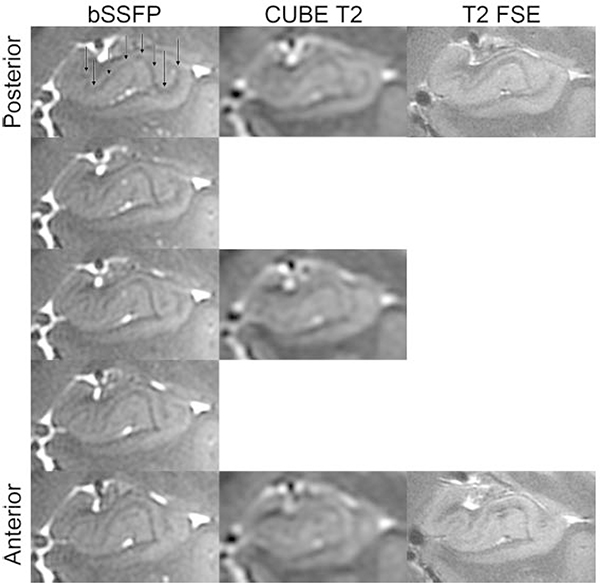
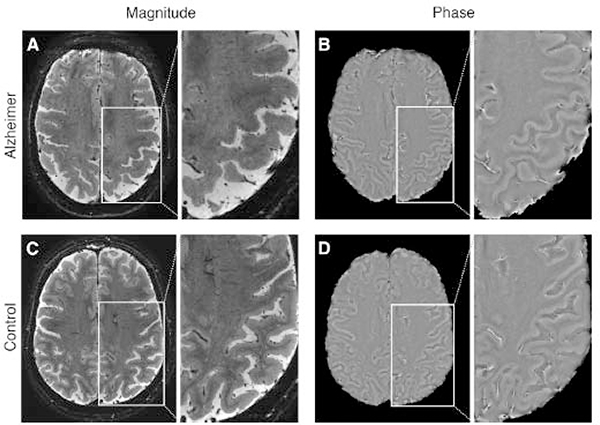
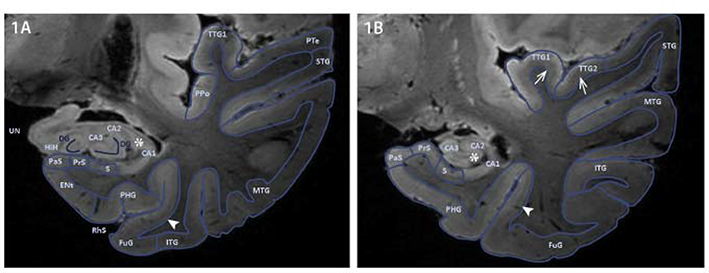
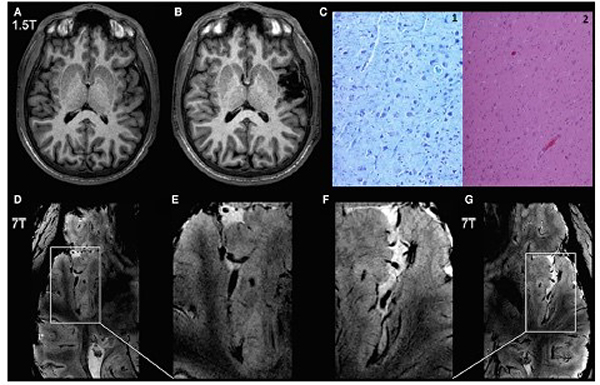
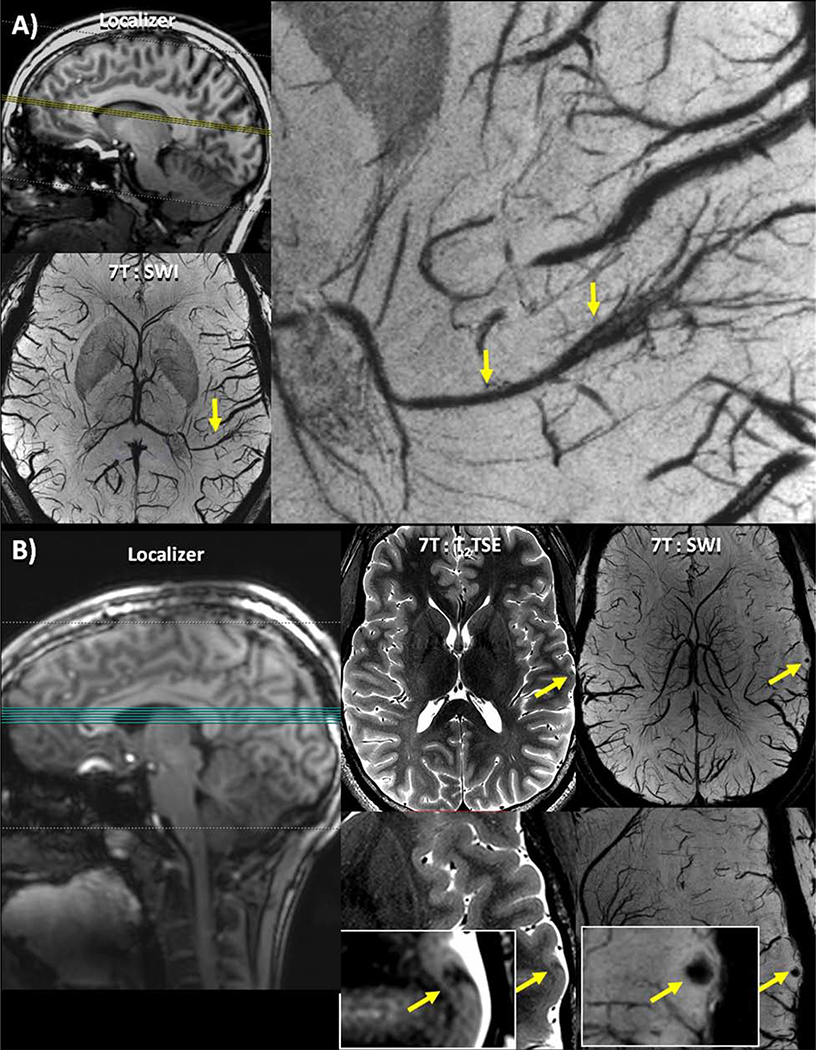
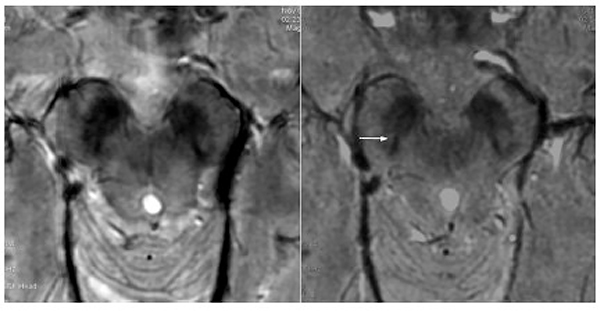
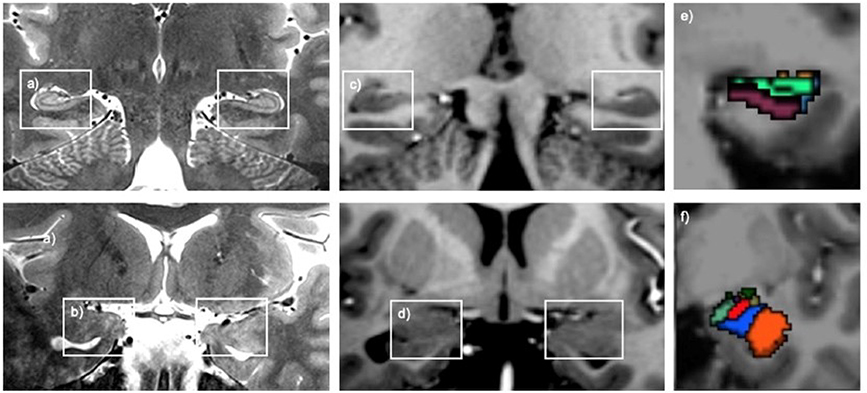
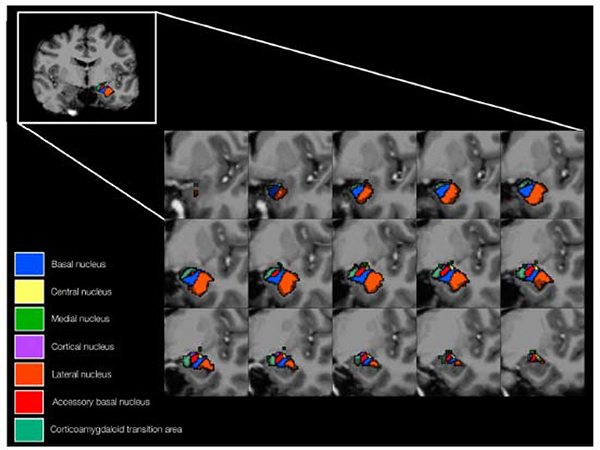
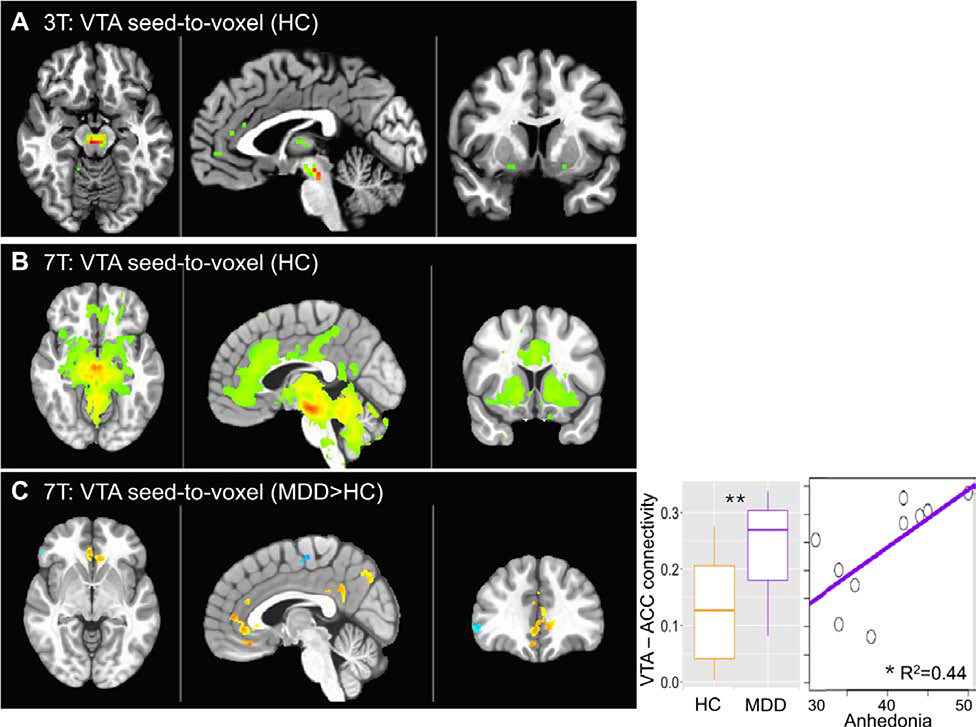
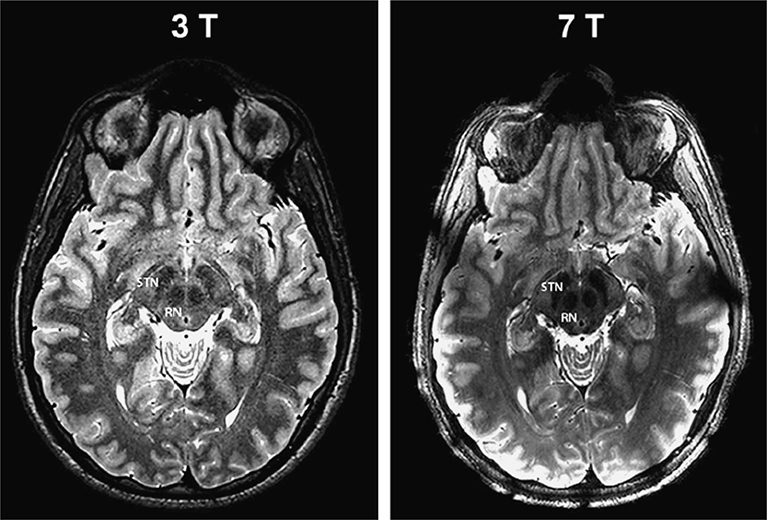
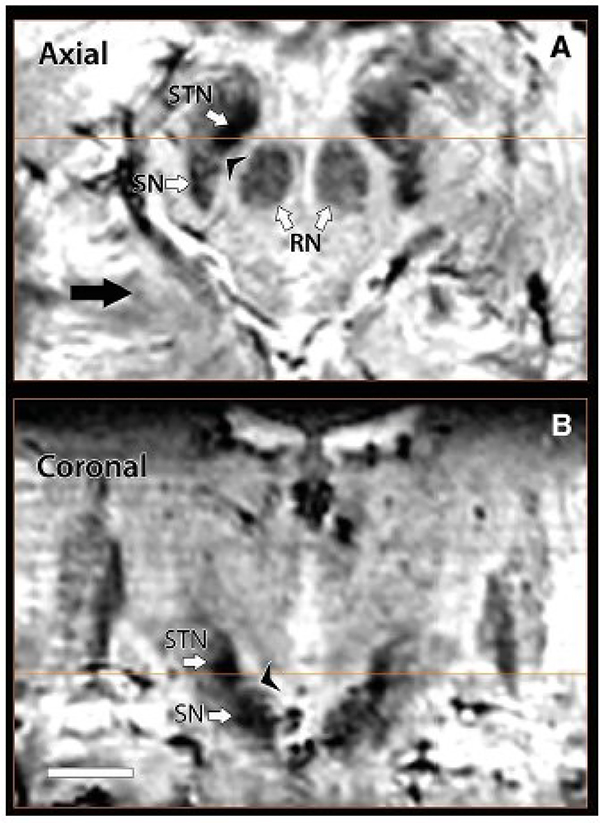
High-resolution 7-T imaging and quantitative susceptibility mapping produce greater anatomic detail compared with conventional strengths because of improvements in signal/noise ratio and contrast. The exquisite anatomic details of deep structures, including delineation of microscopic architecture using advanced techniques such as quantitative susceptibility mapping, allows improved detection of abnormal findings thought to be imperceptible on clinical strengths. This article reviews caveats and techniques for translating sequences commonly used on 1.5 or 3 T to high-resolution 7-T imaging. It discusses for several broad disease categories how high-resolution 7-T imaging can advance the understanding of various diseases, improve diagnosis, and guide management.

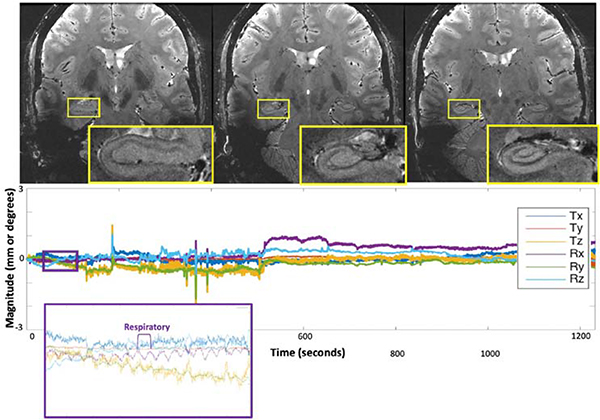
Keywords: High-resolution 7 T; Hippocampus; Midbrain; Motion correction; Neurodegenerative diseases; Neuropsychiatric diseases; Quantitative susceptibility mapping.


Conflict of interest statement

Disclosures V. Yedavalli, P. DiGiacomo, E. Tong: no disclosures. M. Zeineh received research funding from GE Healthcare.

Figures

Figure 1:
Figure 1:. An example of magnitude and phase imaging contrast at 7T providing clear visualization of deep grey structures.
Magnitude (left) and phase (right) images of the pre-central gyrus (PreCG), medullary veins (MV), caudate (C), putamen (Pu), anterior and posterior limbs of the internal capsule (aIC/pIC), thalamus (Th), globus pallidus pars interna/pars externa (GPpi/GPpe), red nucleus (RN), substantia nigra (SN), pons (P), periaqueductal grey matter (PaG) and cerebellum (Ce). From Hammond KE, Lupo JM, Xu D, et al. Development of a robust method for generating 7T multichannel phase images of the brain with application to normal volunteers and patients with neurological diseases. Neuroimage. 2008 Feb 15; 39(4): 1682–1692; with permission.
Figure 2:
Figure 2:. Images from the 2D SMS gradient-echo (top row) and 3D gradient-echo imaging (bottom row) demonstrating improved lesion detection in the 2D magnitude images and comparable detection in R2*, phase, and QSM images a patient with multiple sclerosis.
Overall MS lesions (with typical example highlighted with arrows) are visualized almost equally on the R2* (red arrows), phase (yellow arrows) and QSM (green arrows) images. On the magnitude images, two lesions (orange arrows) have similar visibility while the other two (orange arrowhead) are better visualized on the 2D image. In addition, the 2D magnitude image shows a sharper edge between gray and white matter. From Bian W, Kerr AB, Tranvinh E, Parivash E, et al. MR susceptibility contrast imaging using a 2D simultaneous multi-slice gradient-echo sequence at 7T. PLoS One. 2019; 14(7); with permission.
Figure 3:
Figure 3:. High resolution susceptibility imaging compared to myelin stain.
The susceptibility map clearly reveals: a — head of the caudate nucleus (Cd), b — anterior limb of internal capsule (Cp.i.a), c — putamen (Put), d — external capsule (Cp.e), e — anterior commissure (Cm.a), f — external globus pallidus (P.l), g — lamina pallidi medialis (La.p.m), h — pallidum mediale externum (P.m.e), i — lamina pallidi incompleta (La.p.i), j — pallidum mediale internum (P.m.i), k — posterior limb of internal capsule (Cp.i.p), l — subthalamic nucleus (Sth), and m — red nucleus (Ru). From Deistung A, Schäfer A, Schweser F, et al. Toward in vivo histology: a comparison of quantitative susceptibility mapping (QSM) with magnitude-, phase-, and R2*-imaging at ultra-high magnetic field strength. Neuroimage. 2013 Jan 15;65:299–314; with permission.
Figure 4:
Figure 4:. High-resolution QSM and QSM-based venograms at 7T.
(Left) Intra-subject comparison (subject 3) of (A and C) motion-corrected and (B and D) uncorrected QSM, (A and B) without and (C and D) with intentional motion. For small-scale motion, corrected and uncorrected QSM showed no apparent motion artifacts. For large-scale motion, uncorrected maps were degraded; this effect was reduced with motion correction leading to minor residual artifacts. (Right) Intra-subject comparison (subject 3) of (A and C) motion-corrected and (B and D) uncorrected QSM-based venograms, (A and B) without and (C and D) with intentional motion. For small-scale motion, corrected and uncorrected QSM showed no apparent motion artifacts. Without correction, large-scale motion degraded vessel depiction considerably; this effect was largely prevented by motion correction leading to minor residual artifacts. From Mattern H, Sciarra A, Lüsebrink F, et al. Prospective motion correction improves high-resolution quantitative susceptibility mapping at 7T. Magn Reson Med. 2019 Mar;81(3):1605–1619; with permission.
Figure 5:
Figure 5:. Example of WM and cortical MS lesions at 7T, with clear visualization using QSM.
MR images of representative WM and cortical lesions from patients 4 (A) and 5 (B). A whole section of the T2-MPFLAIR image is displayed on the left column with a zoomed-in region (blue/red square) for all image contrasts. Two WM lesions (blue arrows) and 3 cortical lesions (red arrows) are shown. WM and cortical lesions are hyper- and hypointense relative to their adjacent parenchyma on QSM images, respectively, while both types of lesions show an identical contrast on all other images. CSFnMPRAGE indicates CSF-nulled T1-weighted MPRAGE; WMnMPRAGE, WM-nulled MPRAGE. From Bian W, Tranvinh E, Tourdias T, et al. In Vivo 7T MR quantitative susceptibility mapping reveals opposite susceptibility contrast between cortical and white matter lesions in multiple sclerosis. Am J Neuroradiol. 2016;37(10):1808–1815; with permission.
Figure 6:
Figure 6:. Relative homogeneity of bSSFP compared to FSE and CUBE.
From Zeineh M, Parekh M, Zaharchuk G, et al. Ultrahigh-resolution imaging of the human brain with phase-cycled balanced steady-state free precession at 7 T. Invest Radiol. 2014;49(5):278–289; with permission.
Figure 7:
Figure 7:. Substructures of hippocampus and atrophy specific to AD.
7 T hippocampal microstructural imaging. (A–P) Serial oblique coronal slices, zoomed to the right hippocampus, are illustrated for one of the patients enrolled in this study. Slices are arranged anterior to posterior, using the same scale represented by the bar in panel (A). (Q) Higher magnification view of panel (I), illustrating how subfields are demarcated. Areas containing dense collections of neuronal cell bodies (e.g., CA1-SP) appear bright on this T2-weighted image, whereas neuropil areas (e.g., CA1-SRLM), which contain dense axons, dendrites, myelin, and synapses, appear relatively hypointense. DG, dentate gyrus; CA1–3, cornu ammonis subfields 1–3; SP, stratum pyramidale; SRLM, stratum radiatum/stratum lacunosum-moleculare; sub, subiculum. (R) Higher magnification of the parahippocampal gyrus from panel (E), illustrating how the entorhinal cortex (ERC) is demarcated. From Bian W, Kerr AB, Tranvinh E, et al. MR susceptibility contrast imaging using a 2D simultaneous multi-slice gradient-echo sequence at 7T. PLoS One. 2019; 14(7); with permission.
Figure 8:
Figure 8:. 3T MPRAGE, 7T MPRAGE, and 7T MP2RAGE acquired on a single subject. 7T MPRAGE exhibits a strong bias field, giving low signal intensities in temporal and basal regions. 7T MP2RAGE sequence accounts for this bias field and delivers good contrast properties between gray and white matter more homogeneously throughout the brain, though still with some regions of inhomogeneity inferiorly.
From Seiger R, Hahn A, Hummer A, et al. Voxel-based morphometry at ultra-high fields: A comparison of 7T and 3T MRI data. Neuroimage. 2015 Jun; 113: 207–216; with permission.
Figure 9:
Figure 9:. Representative examples of white-matter nulled (WMnMPRAGE) scans in coronal, axial, and sagittal places (each orientation shown in a different volunteer) and presented with the corresponding histological plates (Morel et al., 1997).
Several nuclei can be identified with the enhanced intrinsic contrast between adjacent structures, particularly with the hypointense bands that isolate structures that are close in signal intensity. For example, see the thin boundaries around the pulvinar anterior (PuA, green) in coronal (A), around the ventral anterior nucleus (VA, pink) in axial (B), and around the anterior ventral nucleus (AV, orange) in sagittal (C). From Tourdias T, Saranathan M, Levesque IR, et al. Visualization of intra-thalamic nuclei with optimized white-matter-nulled MPRAGE at 7T. Neuroimage. 2014;84:534–545; with permission.
Figure 10:
Figure 10:. Improved imaging of the hippocampus using bSSFP compared to CUBE T2.
Hippocampal heads in a healthy volunteer in time-matched Cube T2 (top) and bSSFP (bottom). The left-right asymmetry is caused by a slight head rotation. From Zeineh M, Parekh M, Zaharchuk G, et al. Ultrahigh-resolution imaging of the human brain with phase-cycled balanced steady-state free precession at 7 T. Invest Radiol. 2014;49(5):278–289; with permission.
Figure 11:
Figure 11:. Single slice high resolution GRE scan enabled by motion correction.
At a resolution of 0.12 × 0.12 × 0.6 mm structures of one to two pixel in width are identifiable and clearly defined. Magnifications of the marked regions are shown below. From Stucht D, Danishad KA, Schulze P, et al. Highest Resolution In Vivo Human Brain MRI Using Prospective Motion Correction. PLoS One. 2015;10(7); with permission.
Figure 12:
Figure 12:. High resolution imaging of hippocampus enabled by prospective motion correction.
Results of the 20-min ultrahigh-resolution 2D GRE sequence, demonstrating exquisite quality imaging of the hippocampus and the remainder of the visualized brain. The plots below each image display the translational and rotational motion across time, with the vertical axis showing mm and degrees of displacement or rotation, respectively, and the horizontal showing time in seconds. Each direction of motion was normalized to the subject’s initial position for this scan to visualize only net motion during the acquisition. The purple and orange insets show detection of physiologic respiratory motion, respectively, in addition to rigid-head motion. From DiGiacomo P, Maclaren J, Aksoy M, et al. A within-coil optical prospective motion-correction system for brain imaging at 7T. Magn Reson Med. 2020 Sep;84(3):1661–1671; with permission.
Figure 13:
Figure 13:. Highlighting the increased anatomic detail of the anteromedial temporal lobe on 7T MPRAGE (divided by a short-TE GRE for better signal homogeneity) compared to 3T
The amygdala (Amg) and the hippocampus (Hi) in the mediotemporal lobe of S1. (a) T1-weighted in vivo MRI in the sagittal plane. The amygdalo-hippocampal area, marked by a red square, is magnified in (c). The corresponding axial view is displayed in (b) and the magnified AHB area is shown in (d). The border between the amygdala and the hippocampus formed by the temporal horn of the lateral ventricle (THLV) and the alveus (alv) can be clearly seen. From Derix J, Yang S, Lüsebrink F, et al. Visualization of the amygdalo–hippocampal border and its structural variability by 7T and 3T magnetic resonance imaging. Human Brain Mapping. 2014 March 12; 35(9): p. 4316–4329; with permission.
Figure 14:
Figure 14:. Highlighted subfields of the hippocampal formation at 7T 3D T2W FSE.
The upper figure shows a sagittal view with references to all the coronal images. Coronal images of the hippocampal formation are shown in 1a–1h in an anterior-to-posterior direction from 1a to 1h. The head is displayed in Figs. 1b–f, the body in Fig. 1g and the tail in Fig. 1h. The asterisk in 1b indicates the sulcus semiannularis. The segmentation of the hippocampal formation is shown in 1a’–1h’. The zoom-in in picture 1e’ shows the construction of the border between CA2 and CA3 by drawing a virtual square. The arrows in 1f’ point to the alveus and fimbria which were excluded from segmentation. These hypointense structures are also visible on 1e’, 1g’ and 1h’. From Wisse L E M, Gerritsen L, Zwanenburg JJM, et al. Subfields of the hippocampal formation at 7T MRI: In vivo volumetric assessment. Neuroimage. 2012;61(4):1043–1049; with permission.
Figure 15:
Figure 15:. Comparison of the left hippocampal head on bSSFP with the SLRM highlighted (black arrows). CUBE T2 and T2 FSE images also displayed in native space without interpolation.
From Zeineh M, Parekh M, Zaharchuk G, et al. Ultrahigh-resolution imaging of the human brain with phase-cycled balanced steady-state free precession at 7 T. Invest Radiol. 2014;49(5):278–289; with permission.
Figure 16:
Figure 16:. Axial 2D GRE images show a patient with AD (A, B) and a one normal control patient (C, D). A and C represent magnitude images. B and D represent phase images. The phase images show the enhanced contrast between gray and white matter in the AD patient when compared to the control subject, as indicated by the larger cortical phase shift.
From van Rooden S, Versluis MJ, Liem MJ, et al. Cortical phase changes in Alzheimer’s disease at 7T MRI: a novel imaging marker. Alzheimers Dement. 2014 Jan;10(1):e19–26; with permission.
Figure 17:
Figure 17:. Contours of the anterior and mid hippocampus on coronal plane on 7T T1W ex vivo imaging.
Control brain segmented for the areas of interest in two coronal planes displaying the hippocampus anterior and mid; MTL subregions were segmented based on contours of the sulci and gyri and signal intensity of cortical lamination on MRI. Contrast appears similar to T2-weighted images because of formalin fixation. Hyperintense band of CA3, CA2 and CA1 (Asterix, 1AB). Thin band of Baillarger (Arrowhead, 1AB). Broad band of Baillarger (Open arrows, 1B). Abbreviations: Anterior Transverse Temporal Gyrus (TTG1), Cornu Ammonis 1/2/3 (CA1/2/3) (Substructures of the Hippocampus), Dentate Gyrus (DG), Entorhinal cortex (Ent), Fascia Dentata (FD), Fusiform Gyrus (FuG), Hippocampal Head (HiH), Inferior Temporal Gyrus (ITG), Middle Temporal Gyrus (MTG), Parahippocampal Gyrus (PHG), Parasubiculum (PaS), Planum Polare (PPo), Planum Temporale (Pte), Posterior Transverse Temporal Gyrus, (TTG2), Presubiculum (PrS), Rhinal Sulcus (RhS), Subiculum (S), Superior Temporal Gyrus (STG) and Uncus (UN). From Kenkhuis B, Jonkman LE, Bulk M, et al. 7T MRI allows detection of disturbed cortical lamination of the medial temporal lobe in patients with Alzheimer’s disease. Neuroimage Clin. 2019;21:101665; with permission.
Figure 18:
Figure 18:. 1.5 and 7T evaluation for a patient with intractable epilepsy. 1.5T preoperative 3D SPGR (A); 1.5T postoperative 3D SPGR (B;) histopathology (C); 7T 2D GRE, right hemisphere (D); magnification of panel D (E); 7T axial 3D GRE (F); Magnification of panel F (G).
A, D, and E reveal no structural abnormalities. B is a postoperative MRI showing the extent of resection. C is histologic section (C1: Kluver 200×; C2: Hematoxylin and eosin 100×) demonstrating cortical laminar disruption and dysmorphic neurons, consistent with FCD IIa. Of note, D, and its magnified image E show normal distinction between white and gray matter in the right superior temporal gyrus and the insula. Conversely, G, and its magnified image F show blurring of the gray–white matter junction in the anterior part of the left superior temporal gyrus and in the insular gyri. From De Ciantis A, Barba C, Tassi L, et al. 7T MRI in focal epilepsy with unrevealing conventional field strength imaging. Epilepsia. 2016 Mar;57(3):445–54; with permission.
Figure 19:
Figure 19:. Lesions identified on SWI. (A) Patient 17 –clockwise from top left: Localizer image showing the location of the axial slices; an enlarged view of a DVA associated with the suspected seizure onset zone identified on the SWI; full axial slice of 7T SWI minimum intensity projection showing a DVA.(B) Patient 10 –left to right: Localizer image showing the location of the axial slices; T2 TSE slice (full slice above, enlarged image below) showing a cortical thickness defect indicated by a yellow arrow, initially identified on SWI; SWI slice (full slice above, enlarged image below) showing a punctate focus of susceptibility indicated by a yellow arrow co-localized with a cortical thickness defect.
From Feldman RE, Delman BN, Pawha PS, et al. 7T MRI in epilepsy patients with previously normal clinical MRI exams compared against healthy controls. PLoS One. 2019;14(3); with permission.
Figure 20:
Figure 20:
SWAN-targeted axial image of the midbrain in a healthy subject evaluated at 3T (right column) and at 7T (left column). The trilaminar organization of the SN at level II (upper row) and the nigrosome formation at level I (lower row) are clearly shown with 3T and 7T magnets. Levels I and II of image acquisition are represented by white and gray lines in the scout image. On 7T images, we overlaid a diagram of the trilaminar structure of the SN derived by anatomic atlases.41 The diagnostic accuracy is elevated for both high- and ultra-high-field strength magnets. cp indicates cerebral peduncle; PBN, parabrachial nucleus; RRF, retrorubral field; scp, superior cerebellar peduncle; SNcv, substantia nigra pars compacta ventralis; SNcd, substantia nigra pars compacta dorsalis; SNr, substantia nigra pars reticularis; VTA, ventral tegmental area; R, red nucleus. From Cosottini M, Frosini D, Pesaresi I, et al. Comparison of 3T and 7T susceptibility-weighted angiography of the substantia nigra in diagnosing Parkinson disease. AJNR Am J Neuroradiol. 2015 Mar;36(3):461–6; with permission.
Figure 21:
Figure 21:. Midbrain nuclei segmentation. Coronal images of the STN, SN, and RN on GRE (top), QSM (middle), and FLAIR (bottom).
From Poston KL, Ua Cruadhlaoich MAI, Santoso LF, et al. Substantia Nigra Volume Dissociates Bradykinesia and Rigidity from Tremor in Parkinson’s Disease: A 7 Tesla Imaging Study. J Parkinsons Dis. 2020;10(2):591–604; with permission.
Figure 22:
Figure 22:. A, Sample segmented section in the midbrain in both GRASE and FEE scans at the level of the mammillary bodies. B, Segmented SN traced in red in the midbrain. C, Segmented structures (SN is red; VTA, blue; and RN, green) overlaid on the anatomic FFE image.
From Eapen M, Zald DH, Gatenby JC, et al. Using high-resolution MR imaging at 7T to evaluate the anatomy of the midbrain dopaminergic system. Am J Neuroradiol. 2011;32(4):688–694; with permission.
Figure 23:
Figure 23:. Top - Axial SWAN images in a normal healthy patient at the midbrain at 7T (left) and 3T (right) shows visualization of the nigrosome complex on 7T but is lost at 3T (false positive). Bottom – Axial SWAN images in a PD patient at 7T (left) and 3T (right) showing loss of the nigrosome formation on 7T while the hyperintense band (white arrow) was erroneously interpreted as nigrosome (false negative).
From Cosottini M, Frosini D, Pesaresi I, et al. Comparison of 3T and 7T susceptibility-weighted angiography of the substantia nigra in diagnosing Parkinson disease. AJNR Am J Neuroradiol. 2015 Mar;36(3):461–6; with permission.
Figure 24:
Figure 24:. Top - T2W coronal images of the hippocampal head and amygdala (A and B) with corresponding T1W coronal images (C and D). Segmented hippocampal and amygdala nuclei (E and F). Bottom – Anatomic representation of the segmented amygdala nuclei.
From Brown SG, Rutland JW, Verma G, et al. Structural MRI at 7T reveals amygdala nuclei and hippocampal subfield volumetric association with Major Depressive Disorder symptom severity. Sci Rep. 2019;9(1):1–10; with permission.
Figure 25:
Figure 25:. Connectivity of the VTA with whole brain is shown for 3T (a) and 7T (b) in healthy controls (HC) (voxelwise p < 0.001 for illustration).
c VTA-to-whole brain functional connectivity comparison between patients with major depressive disorder (MDD) and HC (p < 0.01 voxelwise, Cluster > 200). Seed-to-seed VTA-ACC connectivity is plotted for MDD and HC and against anhedonia in the MDD group. From Morris LS, Kundu P, Costi S, et al. Ultra-high field MRI reveals mood-related circuit disturbances in depression: a comparison between 3-Tesla and 7-Tesla. Transl Psychiatry. 2019;9(1):94; with permission.
Figure 26:
Figure 26:. 3T (left) and 7T (right) T2W evaluation at the level of the STN showing more anatomic distinction on 7T.
From Abasch A, Yacoub E, Ugurbil K, et al. An assessment of current brain targets for deep brain stimulation surgery with susceptibility-weighted imaging at 7 tesla. Neurosurgery. 2010;67(6):1745–1756; with permission.
Figure 27:
Figure 27:. Axial (top) and coronal (bottom) SWI images on 7T demonstrating distinction boundaries between the STN and SN.
From Abasch A, Yacoub E, Ugurbil K, et al. An assessment of current brain targets for deep brain stimulation surgery with susceptibility-weighted imaging at 7 tesla. Neurosurgery. 2010;67(6):1745–1756; with permission.
Figure 28:
Figure 28:. Illustration of tremor patients. Both were treated with the left thalamus with left Vim radiosurgery for right sided refractory tremor.
From Najdenovska E, Tuleasca C, Jorge J, et al. Comparison of MRI-based automated segmentation methods and functional neurosurgery targeting with direct visualization of the Ventro-intermediate thalamic nucleus at 7T. Sci Rep. 2019;9(1):1119; with permission.
Figure 29:
Figure 29:. Coronal co-registered 7T MP2RAGE (top), down sampled 7T MP2RAGE (middle), and 3T T1W (bottom) of the habenula with segmentation (blue and red outlines represent 7T and 3T segmentation respectively).This shows subtle overestimation on 3T compared to 7T. The black arrows show 3T overestimation of the fascicula retroflexus.
From Kim JW, Naidich TP, Joseph J, et al. Reproducibility of myelin content-based human habenula segmentation at 3 Tesla. Hum Brain Mapp. 2018;39(7):3058–3071; with permission.
None
None
None

Similar articles

Cited by

References

    1. Kerchner GA. Ultra-high field 7T MRI: A new tool for studying Alzheimers Disease. J Alzheimer’s Dis. 2011;26(SUPPL. 3):91–95. doi:10.3233/JAD-2011-0023 - DOI - PubMed
    1. Cosottini M, Frosini D, Pesaresi I, et al. Comparison of 3T and 7T susceptibility-weighted angiography of the substantia nigra in diagnosing Parkinson disease. Am J Neuroradiol. 2015;36(3):461–466. doi:10.3174/ajnr.A4158 - DOI - PMC - PubMed
    1. Wisse LEM, Gerritsen L, Zwanenburg JJM, et al. Subfields of the hippocampal formation at 7 T MRI: in vivo volumetric assessment. Neuroimage. 2012;61(4):1043–1049. doi:10.1016/j.neuroimage.2012.03.023 - DOI - PubMed
    1. Hammond KE, Metcalf M, Carvajal L, et al. Quantitative in vivo magnetic resonance imaging of multiple sclerosis at 7 Tesla with sensitivity to iron. Ann Neurol. 2008;64(6):707–713. doi:10.1002/ana.21582 - DOI - PubMed
    1. Abosch A, Yacoub E, Ugurbil K, Harel N. An Assessment of Current Brain Targets for Deep Brain Stimulation Surgery With Susceptibility-Weighted Imaging at 7 Tesla. Neurosurgery. 2010;67(6):1745–1756. doi:10.1227/NEU.0b013e3181f74105 - DOI - PMC - PubMed

MeSH terms