Review
. 2021 Feb;29(1):e1-e19.
doi: 10.1016/j.mric.2020.10.001.

Progress in Imaging the Human Torso at the Ultrahigh Fields of 7 and 10.5 T

Affiliations
Review

Progress in Imaging the Human Torso at the Ultrahigh Fields of 7 and 10.5 T

Kamil Uğurbil et al. Magn Reson Imaging Clin N Am. 2021 Feb.

Abstract

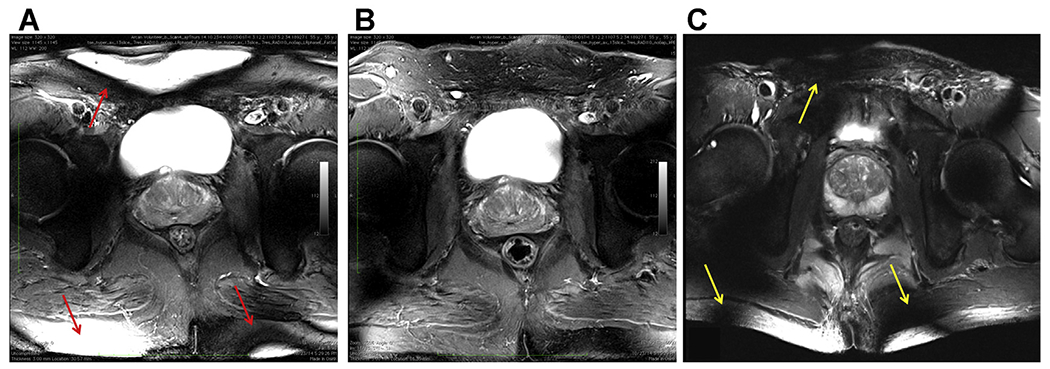
Especially after the launch of 7 T, the ultrahigh magnetic field (UHF) imaging community achieved critically important strides in our understanding of the physics of radiofrequency interactions in the human body, which in turn has led to solutions for the challenges posed by such UHFs. As a result, the originally obtained poor image quality has progressed to the high-quality and high-resolution images obtained at 7 T and now at 10.5 T in the human torso. Despite these tremendous advances, work still remains to further improve the image quality and fully capitalize on the potential advantages UHF has to offer.

Keywords: 10.5 T; 7 T; Imaging; Parallel transmit; Torso; Ultrahigh fields.


Conflict of interest statement

Disclosure The work reported in this article coming from the Center for Magnetic Resonance Research (CMRR), University of Minnesota was supported by NIH grants NIBIBP41 EB015894, NIBIB P41 EB027061, and NIH S10 RR029672.

Figures

Fig. 1.
Fig. 1.
Two-dimensional (2D) plots of instantaneous transverse |B1| at progressing points during a half period in phantoms with (A) σ = 0 S/m, (B) σ = 0.26 S/m, and (C) σ = 0.67 S/m. The intensity profiles along the horizontal centerlines are also shown on the right of the 2D plots. The surface coil position is indicated by 2 small dots on the left side of the phantom. Because the temporal B1 strength varies greatly among these 3 cases, the signal intensities of temporal points are normalized individually for each conductivity condition in order to visualize the temporal change for all the conditions clearly.
Fig. 2.
Fig. 2.
Transmit B1 magnitude in the human head at 7 T, generated by a volume TEM coil. The color code is proportional to μTesla/V.
Fig. 3.
Fig. 3.
Electromagnetic simulations of the transmit B1 field in a body RF coil at 7 T. The coil produces a homogenous B1 when empty (top figure) but not when loaded with the human body (lower figure).
Fig. 4.
Fig. 4.
(A) Single axial slice image from the human pelvis reported from early 4 T experiments from the research laboratories of Siemens; (B), a contemporary 7 T image of an axial slice in the human torso, targeting imaging of the heart, obtained with a 16-channel transmit and receive array coil, using B1 “shimming”. (C) and (D) The transmit B1 magnitude map before (C) and after (D) optimization over the heart in an axial slice approximately at the same position as that shown in Fig. 4B, demonstrating that the B1 is normally highly inhomogeneous and weak over this organ of interest (C) but can be improved significantly by multichannel transmit methods (D).
Fig. 5.
Fig. 5.
T2-weighted turbo spin echo anatomic images acquired with different body array configurations. (A) Image obtained with the original 16-channel micro-stripline (16 ML) with 8 anterior and 8 posterior elements and capacitive decoupling between adjacent ground planes and conductors. (B) Image obtained with a 10-channel fractionated dipole antenna (10DA) array with 6 anterior and 4 posterior elements. (C) Image obtained with the 16-channel loop-dipole array with 8 fractionated dipoles and centrally geometrically decoupled loops. All coils had similar circumferential coverage with their relative spacing to the nearest neighbor dictated by design. On quantitative analysis, the combination of loops and dipole elements (C) provided improved SNR and transmit efficiency. The uniform cross-sectional images produced by 10DA (B) highlight the benefits of the dipole resonant structure for body imaging in general. Although overflipping is more pronounced with the 16LD due to the inclusion of loop elements (C) on transmit (yellow arrows), the characteristically high B1+ gradient at the surface is more prevalent with the 16 ML (red arrows), again due to the presence of the surface coils. All data are from CMRR.
Fig. 6.
Fig. 6.
(A) The loop and dipole element within a single block of the 16LD coil used to generate the images in Fig.5C; (B) the electrical fields associated with the dipole and the loop elements, calculated by electromagnetic simulations. (C) Four loop-dipole blocks as manufactured containing the 8 transceiver channels for the anterior side of the 16LD coil. The same configuration is then placed also on the posterior side, as shown in Fig. 7E with a torso phantom. (D) Kidney, cardiac, and prostate images obtained with the 16LD coil.
Fig. 7.
Fig. 7.
Single frames from short-axis (SA) cardiac cines acquired with 5 different 7 T body imaging arrays. (A) A 32-channel transceiver array consisting of 8 building blocks composed of 4 shielded loops in a 2 × 2 configuration per block. (B) An array composed of 16 building blocks each containing a bow tie-shaped λ/2-dipole antenna in a 4 × 2 configuration anterior and posterior. (A) and (B) used a universal RF shim solution based on EM simulations implemented through a splitter to produce a uniform field in the 4-chamber view. Images for (A) and (B) are acquired with resolutions of 1.1 × 1.1 × 2.5 mm3 and GRAPPA = 2 with acoustic cardiac triggering. (C) An 8 block array where each block is composed of a fractionated dipole transceiver and 2 receive only loops (ie, 8Tx/32Rx). The anterior elements are bent in the middle to better conform to the chest wall. Images were acquired with a resolution of 1.3 × 1.3 × 8 mm3 with subject-dependent phase-based RF shimming and VCG gating. (D) An 8-block array where each block is composed of a meander transceiver and 3 receive-only loop elements (ie, 8Tx/32Rx). RF shimming consisted of a universal phase-only RF shim and gating was performed with a finger pulse oximeter. Acquisition resolution was 1.5 × 1.5 × 3 mm3 with GRAPPA = 2 acceleration. (E) A 16-channel transceiver array with 4 loop-dipole blocks both anterior and posterior driven by a 16-channel pTx system using subject-specific static RF shim optimized for homogeneity over the heart. Acquisition parameters were 1 2 × 1.2 × 4 mm3 with GRAPPA = 2 and acquired with VCG gating. VCG, vectorcardiogram. (Courtesy of: Neindorf and Ozerdem (A, B); Steensma (C); Reitsch (D).)
Fig. 8.
Fig. 8.
L-curves demonstrating the tradeoff between excitation error (Normalized Root Mean Square Error) and resulting peak local SAR for 7.0 T (blue) and 10.5 T (black) arrays when designing 1-spoke (dashed) and 2-spoke (solid) pTx pulses to image the prostate (A), the kidneys (B), and the heart (C). The pTx pulses were designed with explicit local SAR constraint, and the L-curve per design scenario was created by varying the predefined peak 10 g SAR limit. In all cases, the nominal flip angle was 45°.
Fig. 9.
Fig. 9.
Anatomic hip imaging acquired at 10.5 T with a 10-channel dipole transceiver array. (A) An axial multislice 2D gradient echo acquisition acquired with fat saturation. (B) 3D coronal MEDIC acquisition. (C) Zoomed version of the right femoral head form the MEDIC (B) acquisition. (D) A proton-density (PD) weighted turbo spin echo (TSE) acquisition showing the expected contrast between the labrum and cartilage (yellow arrow).
Fig. 10.
Fig. 10.
Initial images of the prostate at 10.5 T images. (A) Axial fat-suppressed T2w TSE, 9 slices, FOV 220 mm TR/TE: 7000/55 ms, resolution: 0.72 × 0.57 × 3mm3, TA: 05:30. (B) Coronal fat-suppressed T2w TSE, 9 slices, FOV 220 mm TR/TE: 7000/55 ms, resolution: 0.72 × 0.57 × 3mm3, TA: 05:30.
Fig. 11.
Fig. 11.
10.5 T cardiac images obtained with phase-only shim and 1-spoke pTx RF pulses, retrospectively gated GRE cine acquisition in the 4-chamber view.

References

    1. Ugurbil K Imaging at ultrahigh magnetic fields: History, challenges, and solutions. Neuroimage 2018;168:7–32. - PMC - PubMed
    1. Ugurbil K The road to functional imaging and ultra-high fields. Neuroimage 2012;62:726–35. - PMC - PubMed
    1. Vaughan JT, Snyder C, DelaBarre L, et al. in Proc Intl Soc Mag Reson Med Vol. 16 213 (Seattle, Washington, 2006).
    1. Ugurbil K Magnetic resonance imaging at ultra-high fields. IEEE Trans Biomed Eng 2014;61:1364–79. - PMC - PubMed
    1. Umutlu L, Ladd ME, Forsting M, et al. 7 Tesla MR imaging: opportunities and challenges. Rofo 2014;186:121–9. - PubMed

MeSH terms