. 2021 Mar 1;218(3):e20201173.
doi: 10.1084/jem.20201173.

Compromised counterselection by FAS creates an aggressive subtype of germinal center lymphoma

Affiliations

Compromised counterselection by FAS creates an aggressive subtype of germinal center lymphoma

Raud Razzaghi et al. J Exp Med. .

Abstract

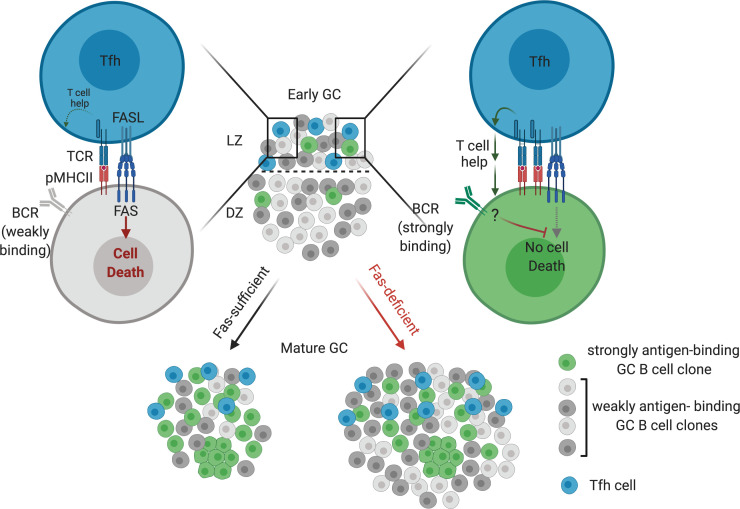
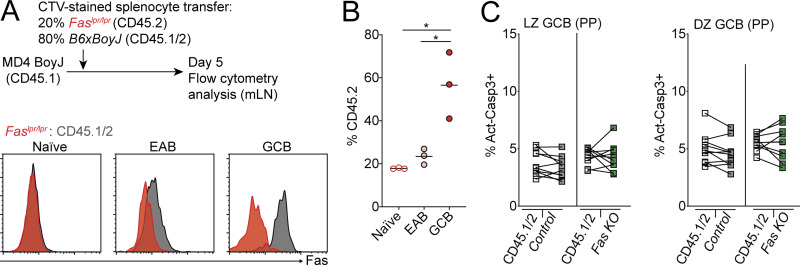
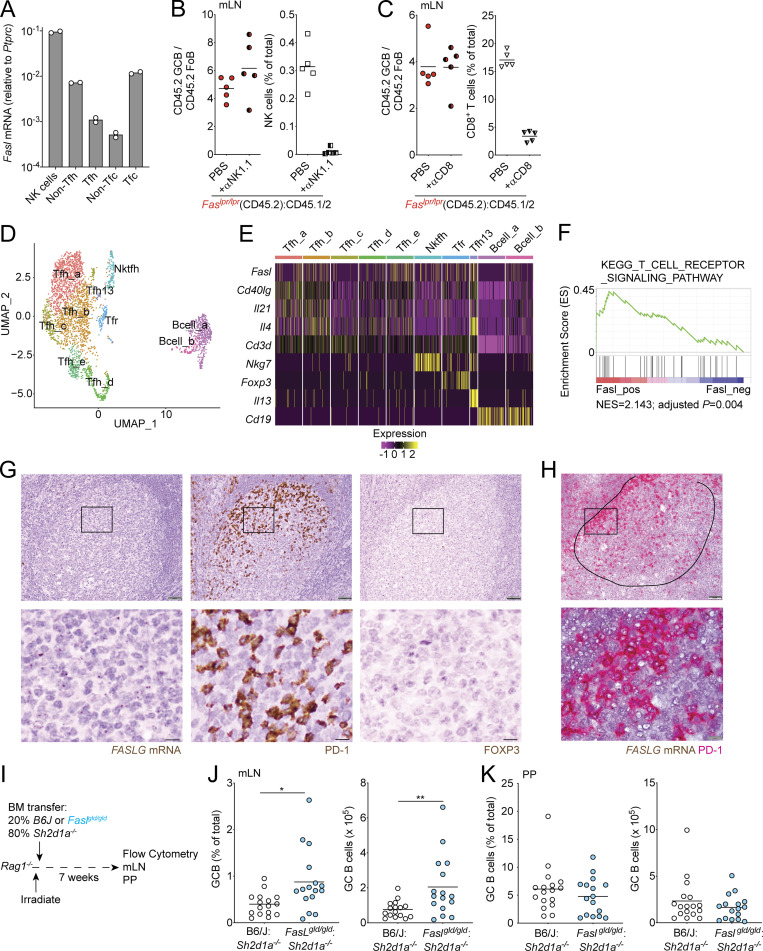
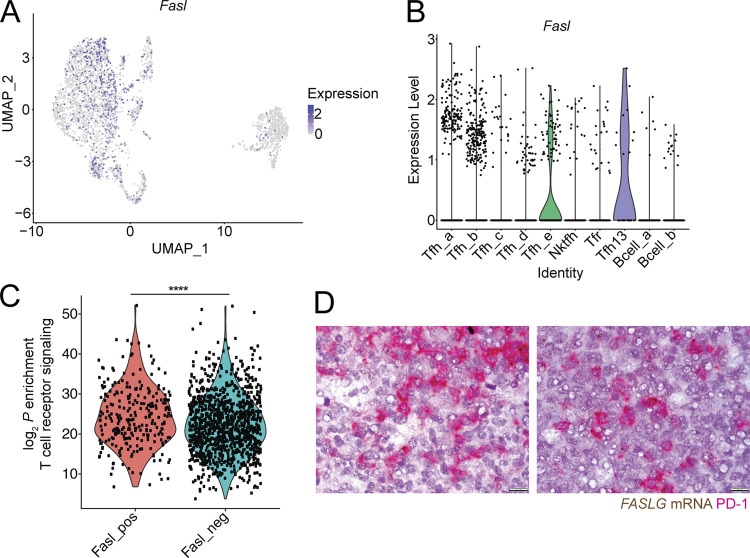
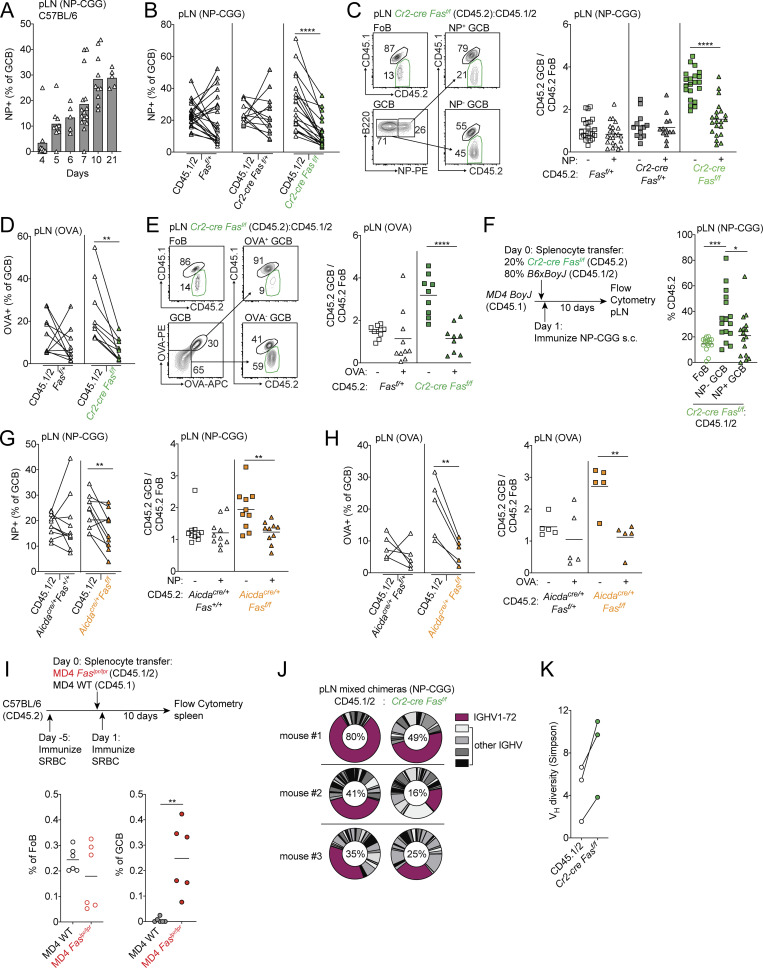
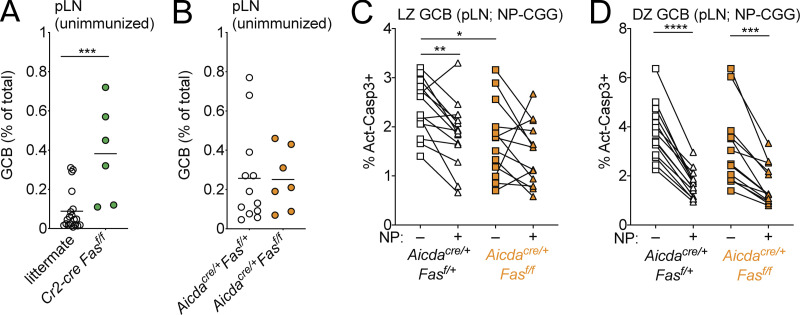
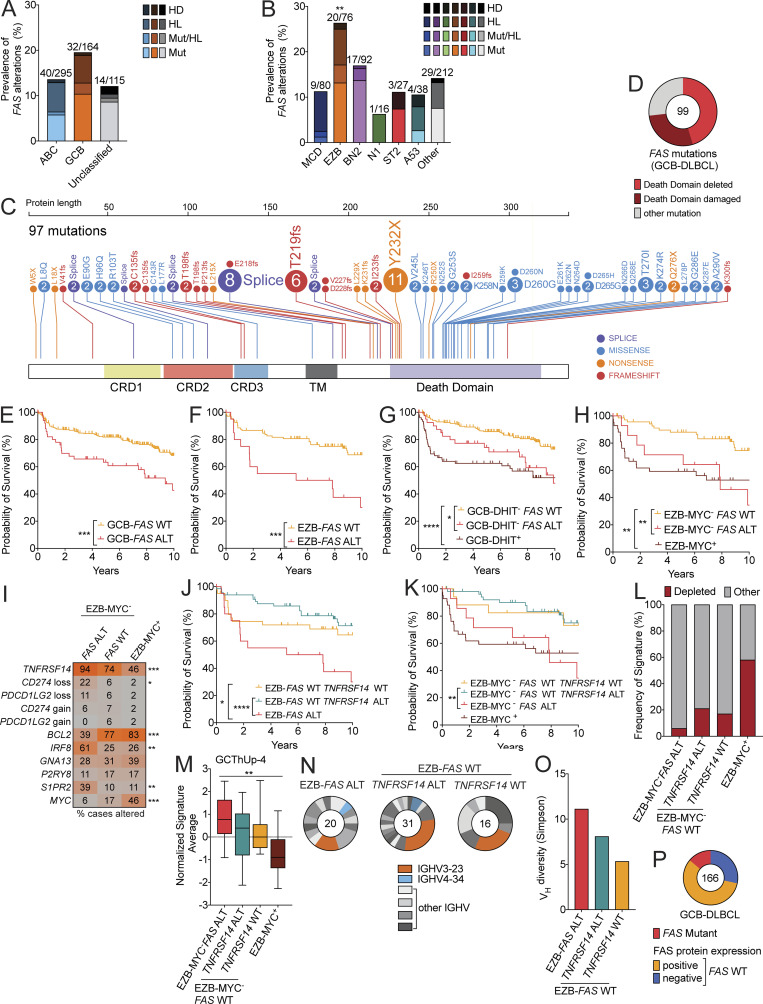
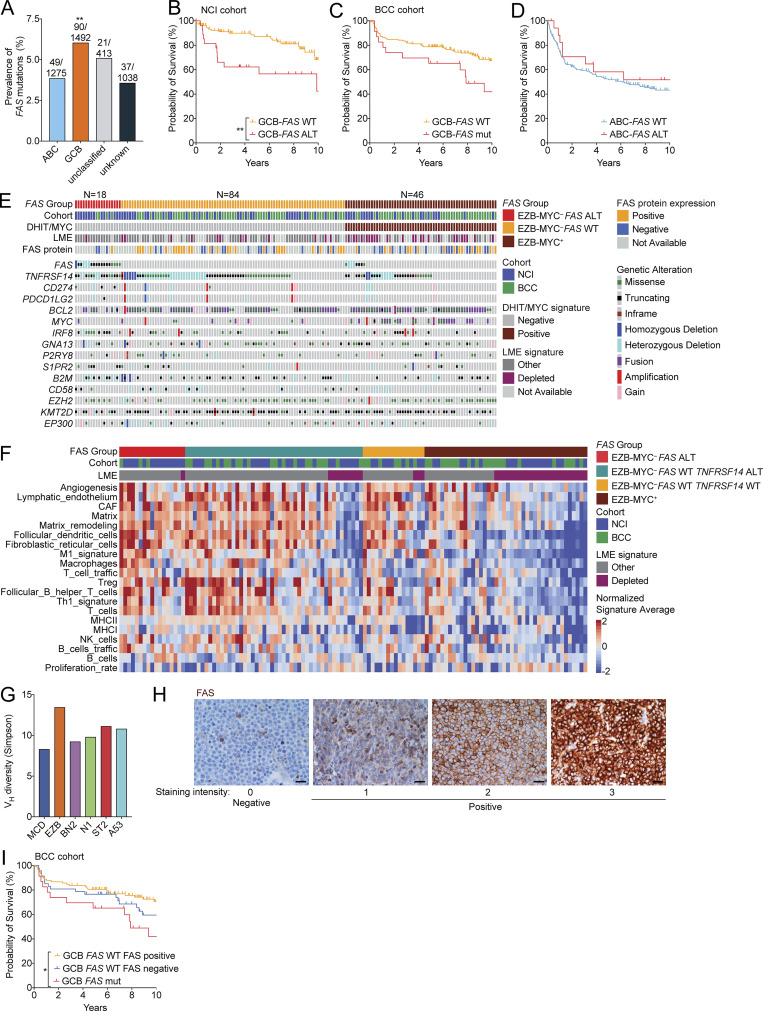
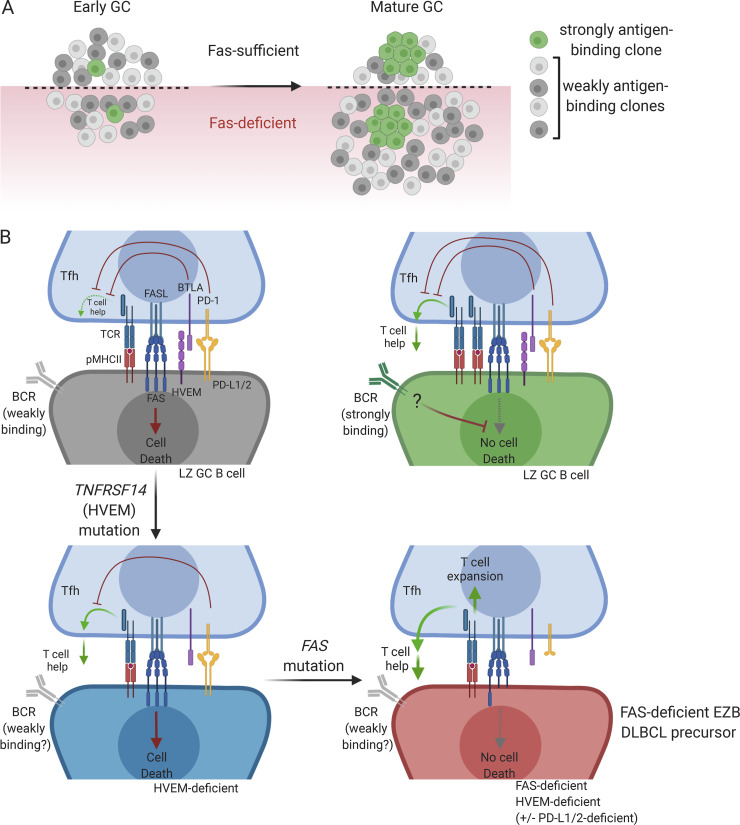
Fas is highly expressed on germinal center (GC) B cells, and mutations of FAS have been reported in diffuse large B cell lymphoma (DLBCL). Although GC-derived DLBCL has better overall outcomes than other DLBCL types, some cases are refractory, and the molecular basis for this is often unknown. We show that Fas is a strong cell-intrinsic regulator of GC B cells that promotes cell death in the light zone, likely via T follicular helper (Tfh) cell-derived Fas ligand. In the absence of Fas, GCs were more clonally diverse due to an accumulation of cells that did not demonstrably bind antigen. FAS alterations occurred most commonly in GC-derived DLBCL, were associated with inferior outcomes and an enrichment of Tfh cells, and co-occurred with deficiency in HVEM and PD-L1 that regulate the Tfh-B cell interaction. This work shows that Fas is critically required for GC homeostasis and suggests that loss of Tfh-mediated counterselection in the GC contributes to lethality in GC-derived lymphoma.


Conflict of interest statement

Disclosures: N. Kotlov reported a patent to BostonGene issued. O. Plotnikova reported "BostonGene employee." G.A. Smith reported personal fees from AMGEN outside the submitted work. J.J. O'Shea reported "other" from Pfizer outside the submitted work. J.D. Phelan reported a patent to PCT/US2018/025377 pending. D.W. Scott reported personal fees from Abbvie, personal fees from AstraZeneca, personal fees from Celgene, personal fees from Janssen, grants from Janssen, and grants from NanoString outside the submitted work; in addition, D.W. Scott had a patent for molecularly subtype lymphoma pending with NanoString. No other disclosures were reported.

Figures

None
Graphical abstract
Figure 1.
Figure 1.
Fas is required to constrain survival of GC B cells in vivo in a tissue-specific manner. (A) Fas expression on GC B cells from an mLN tumor from a 17-mo-old Cr2-cre Gna13f/f animal or littermate control. Gross appearance of the mLN is shown in images on the left. Scale bar, 1 cm. (B) Frequency of loss of Fas expression on GC B cell tumors from animals aged 12–20 mo with B cell–specific Gα13 deficiency (n = 29). (C) Experimental scheme for data in D and E. (D) Percentages of CD45.2 FoB cells and GC B cells (GCB) in mLNs of mixed BM chimeras generated with a mixture of 85% WT (CD45.1/2) and 15% CD45.2 BM that was B6/J or Faslpr/lpr, assessed by FACS. Example gating strategy for FoB cells and GC B cells is shown on the left in D. (E) Ratio of frequency of CD45.2 GC B cells to CD45.2 FoB cells in B6J or Faslpr/lpr mixed BM chimeras in mLNs, SRBC-immunized pLNs, and PPs. Data in D and E are pooled from two independent experiments with five mice per group. (F) Ratio of frequency of CD45.2 GC B cells to CD45.2 FoB cells in mLNs and PPs of mixed BM chimeras generated with 85% WT (CD45.1/2) and 15% CD45.2 BM that was Fasf/+, Cr2-cre Fasf/+, or Cr2-cre Fasf/f. Data are pooled from two independent experiments with five to seven mice per group. (G) Frequency of GC B cells among total cells in mLNs from littermate control or Cr2-cre Fasf/f animals. Data are pooled from four independent experiments with one to four mice per group. (H) Frequency of CD45.2 cells among FoB cells or GC B cells derived from donor cells in mLNs of MD4 BoyJ mice that were given a mixture of splenocytes that were 80% WT (CD45.1/2) and 20% Cr2-cre Fasf/f (CD45.2) 10–14 d before analysis. Data are pooled from five independent experiments with four to six mice per group. (I) Ratio of frequency of CD45.2 GC B cells to CD45.2 FoB cells from mLNs of mixed chimeras generated with a mixture of 92.5% WT (CD45.1/2) and 7.5% CD45.2 BM that was Cr2-cre Fasf/f Gna13f/+, Cr2-cre Fasf/+Gna13f/f, or Cr2-cre Fasf/fGna13f/f, assessed by FACS. Data are pooled from two independent experiments with 5–10 mice per group total. ****, P < 0.0001, paired two-tailed Student’s t test for data in H. For all other data, **, P < 0.01; ***, P < 0.001; ****, P < 0.0001, unpaired two-tailed Student’s t test.
Figure S1.
Figure S1.
Fas is required to constrain survival of GC B cells in vivo. (A) Fas expression on Ephrin-B1+ GC B cells from an mLN tumor from an 18-mo-old Cr2-cre Gna13f/f animal or littermate control. Gross appearance of the mLN is shown in images on the left. Scale bar, 1 cm. (B and C) Example of gating scheme for Ephrin-B1+ GC B cells (B) and percentages of CD45.2 FoB cells and Ephrin-B1+ GC B cells (C) in mLNs of mixed BM chimeras generated as in Fig. 1 C, assessed by FACS. Data are from 10 mice per group. ****, P < 0.0001, unpaired two-tailed Student’s t test.
Figure 2.
Figure 2.
Fas-dependent deletion occurs in the GC LZ. (A) Fas expression on CD45.2+ naive B cells (gray), EAB cells (blue), and GC B cells (red) in mLNs of MD4 BoyJ mice that were given CTV-labeled CD45.2+ splenocytes 5 d before analysis. Naive B cells were defined as CD45.2+ B cells that had not diluted CTV; EAB cells were defined as CD45.2+ B cells that had diluted CTV but did not express the GC marker Ephrin-B1; and GC B cells were defined as CD45.2+ B cells that were Ephrin-B1+CTVIgDloCD38lo. Data are representative of two independent experiments. (B) MD4 BoyJ mice were given a mixture of CTV-labeled splenocytes that were 20% Cr2-cre Fasf/f and 80% WT (CD45.1/2). Left panel shows Fas expression among transferred naive, EAB, or GC B cells that were Cr2-cre Fasf/f (green) or WT (CD45.1/2; gray) in mLNs 5 d after transfer. Middle and right panels show frequency of Cr2-cre Fasf/f (CD45.2+) among transferred cells that were naive, EAB, or GC B cells in mLNs 5 or 10 d after transfer. Data are pooled from two independent experiments for day 5 and three independent experiments for day 10 with three or four mice per experiment. (C) MD4 BoyJ mice were given a mixture of CTV-labeled splenocytes that were 20% Aicdacre/+Fasf/f and 80% Aicdacre/+Fas+/+ (CD45.1/2). Left panel shows Fas expression among transferred naive, EAB, or GC B cells that were Aicdacre/+Fasf/f (orange) or Aicdacre/+Fas+/+ (CD45.1/2; gray) in mLNs 10 d after transfer. Middle and right panels show the frequency of Aicdacre/+Fasf/f (CD45.2+) among transferred cells that were naive, EAB, or GC B cells in mLNs 10 or 21 d after transfer. Data are pooled from four independent experiments with two to four mice per time point. (D) Ratio of frequency of CD45.2 GC B cells to CD45.2 FoB cells in mLNs and PPs of mixed BM chimeras generated with 85% WT (CD45.1/2) and 15% CD45.2 BM that was Aicdacre/+Fas+/+ or Aicdacre/+Fasf/f. Data are from one experiment representative of two with 10 and 9 mice per group. (E) Intracellular FACS for BrdU incorporation in GC B cells from mLNs of Fasf/+ or Cr2-cre Fasf/f mixed BM chimeras generated as in Fig. 1 F that were treated i.p. with BrdU 30 min before sacrifice. Data are from five and eight mice of each type from one experiment representative of two independent experiments. (F) Ratio of frequency of Fasf/+ or Cr2-cre Fasf/f (CD45.2+) cells in LZ or DZ GC B cells relative to FoB cells in mLNs of mixed BM chimeras generated as in Fig. 1 F. Left panel shows example of gating strategy for LZ and DZ GC B cells. (G) Intracellular FACS for active caspase-3 in LZ or DZ GC B cells from mLNs of Cr2-cre Fasf/f mixed BM chimeras generated as in Fig. 1 F analyzed directly ex vivo. Left panel shows an example of the gating strategy for active caspase-3+ cells. Data in F and G are pooled from seven experiments with two or three mice per group per experiment. ***, P < 0.001, unpaired two-tailed Student’s t test for data in D. For all other data, *, P < 0.05; **, P < 0.01; ***, P < 0.001; ****, P < 0.0001, paired two-tailed Student’s t test. SSC, side scatter.
Figure S2.
Figure S2.
Fas is up-regulated in EAB cells. (A and B) MD4 BoyJ mice were given a mixture of CTV-labeled splenocytes that were 20% Faslpr/lpr and 80% WT (CD45.1/2). Histograms show Fas expression among transferred naive cells, EAB cells, or GC B cells that were Faslpr/lpr (red) or WT (CD45.1/2; gray) in mLNs 5 d after transfer (A). Frequency of Faslpr/lpr (CD45.2+) among transferred cells that were naive, EAB, or GC B cells in mLNs 5 d after transfer (B). Data are from one experiment with three mice representative of two independent experiments. (C) Intracellular FACS for active caspase-3 in LZ or DZ GC B cells from PPs of Cr2-cre Fasf/f mixed BM chimeras generated as in Fig. 1 F, analyzed directly ex vivo. Data are from two independent experiments with 10 mice total per group. *, P < 0.05, paired two-tailed Student’s t test.
Figure 3.
Figure 3.
GC Tfh cells promote death of GC B cells via Fas. (A) Quantitative PCR for Fasl from sorted cells in indicated lymphocyte subsets from mLNs. Data are from two independent experiments. Tfc, cytotoxic T follicular cells. (B and C) Ratio of frequency of CD45.2 GC B cells to CD45.2 FoB cells or frequency of NK cells (B) or CD8 cells (C) in Faslpr/lpr mixed BM chimeras generated as in Fig. 1 C in mLNs treated with PBS or anti-NK1.1 for 3 wk (B) or with anti-CD8 antibody for 4 wk (C) before analysis. Data are from five mice per group. (D) Two-dimensional Uniform Manifold Approximation and Projection (UMAP) of the Gowthaman et al. (2019) scRNA-seq dataset of sorted Tfh cells showing 10 distinct cell clusters. (E) Heatmap of expression of Fasl, Cd40lg, Il21, Il4, Cd3d, Nkg7, Foxp3, Il13, and Cd19 among cell clusters. Five clusters of cells express Cd40lg, Il21, Il4, and Cd3d and are not enriched for Nkg7, Foxp3, Il13, or Cd19 (Tfh_a–e). One cell cluster coexpresses Cd3d and Nkg7 (Nktfh). One cluster coexpresses Cd3d and Foxp3 (Tfr). One cell cluster is enriched for Il13 and represents the recently described IL-13–producing Tfh (Tfh13) cell population (Gowthaman et al., 2019). Cd19 is enriched in two clusters of B cells that are not enriched for Cd3d (Bcell_a and Bcell_b). Cd79a and Ms4a1 are also enriched in these clusters (not shown). (F) Gene set enrichment analysis of differentially expressed genes from cells expressing Fasl versus nonexpressers in Tfh clusters (Tfh_a–e) compared with the TCR signaling pathway gene set. NES, normalized enrichment score. (G and H) RNAscope analysis for FASLG mRNA (brown) in human tonsillar sections. PD-1 and FOXP3 staining of serial sections is shown in G. Costaining for FASLG (brown) and PD-1 (red) is shown in H. Original magnification, 20× in G, 20× in top panel in H, and 100× in bottom panel in H. Circled area in H denotes GC boundary. Scale bars, 50 µm in top panels and 10 µm in bottom panels. Data in G and H are representative of at least three independent experiments. (I) Experimental scheme for data in J and K. (J and K) Frequency or number of GCB in mLNs (J) or PPs (K) of mixed BM chimeras generated by reconstituting irradiated Rag1−/− hosts with a mixture of 80% Sh2d1a−/− (SAP KO) and 20% B6/J or Faslgld/gld BM assessed by FACS. Data in J and K are pooled from three independent experiments with five to seven mice per group per experiment. *, P < 0.05; **, P < 0.01, unpaired two-tailed Student’s t test.
Figure S3.
Figure S3.
Fasl is expressed in a fraction of Tfh. (A) Single-cell transcript levels of Fasl in the Gowthaman et al. (2019) scRNA-seq dataset of sorted Tfh illustrated in a Uniform Manifold Approximation and Projection (UMAP) plot. (B) Violin plot of Fasl expression among cell clusters. (C) Enrichment (log2 P values) of TCR signaling gene signature in Fasl-expressing (Fasl_pos) versus -nonexpressing (Fasl_neg) cells in Tfh clusters (Tfh_a–e) determined by a one-sided Fisher’s exact test. (D) Additional examples of costaining for FASLG (brown) and PD-1 (red) in human tonsillar GCs. Original magnification, 100×. Scale bar, 10 µm. ****, P < 0.0001, unpaired two-tailed Student’s t test, for data in C.
Figure 4.
Figure 4.
Fas is required to select against cells that do not strongly bind antigen in immunized GCs. (A) Frequency of NP-binding GC B cells among total GC B cells in pLNs of WT mice at indicated time points following immunizations with NP-CGG in alum. Data are pooled from four independent experiments with 5–10 mice per time point. (B) Frequency of NP binding in WT (CD45.1/2) GC B cells or CD45.2 GC B cells that were Fasf/+, Cr2-cre Fasf/+, or Cr2-cre Fasf/f in pLNs of mixed BM chimeras generated as in Fig. 1 F 10 d following s.c. immunization with NP-CGG in alum. (C) Ratio of frequency of CD45.2 non–NP-binding or NP-binding GC B cells to CD45.2 FoB cells in mixed chimeras from B. Example gating strategy for NP-specific GC B cells is shown on the left. Data in B and C are pooled from two independent experiments with six or seven mice per group per experiment. (D) Frequency of OVA binding in WT (CD45.1/2) GC B cells or CD45.2 GC B cells that were Fasf/+ or Cr2-cre Fasf/f in pLNs of mixed BM chimeras generated as in Fig. 1 F on day 21 following s.c. immunization with OVA in alum on days 0, 2, and 4. (E) Ratio of frequency of CD45.2 non–OVA-binding or OVA-binding GC B cells to CD45.2 FoB cells in mixed chimeras from D. Example gating strategy for OVA-specific GC B cells is shown on the left. Data in D and E are pooled from two experiments with four or five mice per group per experiment. (F) Frequency of CD45.2 cells among FoB cells or non–NP-binding GC B cells or NP-binding GC B cells derived from donor cells in pLNs of MD4 BoyJ mice that were given a mixture of splenocytes that were 80% WT (CD45.1/2) and 20% Cr2-cre Fasf/f, immunized with NP-CGG in alum s.c. 1 d after transfer, and analyzed 10–14 d later. Data are pooled from five independent experiment with three to five mice per experiment. Only mice with >5% of total GC B cells that bound NP were included in this analysis. (G and H) Frequency of antigen binding in WT (CD45.1/2) GC B cells or CD45.2 GC B cells that were Aicdacre/+Fas+/+ or Aicdacre/+Fasf/f in pLNs of mixed BM chimeras generated as in Fig. 2 D and immunized as in B and D, respectively (left panels), or the ratio of frequency of CD45.2 non–antigen-binding or antigen-binding GC B cells to CD45.2 FoB cells in mixed chimeras (right panels). Data in G and H are from 10 and 5 mice per group, respectively. (I) CD45.2 C57BL/6 mice were immunized with SRBC 5 d before receiving a mixture of CD45.1 MD4 WT or CD45.1/2 MD4 Faslpr/lpr splenocytes. Recipients were immunized with SRBC 1 d after transfer and analyzed 10 d later. Shown is the frequency of CD45.1 MD4 WT or CD45.1/2 MD4 Faslpr/lpr cells among all FoB cells or all GC B cells (GCB). Data are pooled from two independent experiments with six mice in total. (J) Vh usage from heavy-chain repertoire sequencing of sorted day 10 pLNs from WT CD45.1/2 or Cr2-cre Fasf/f GCB cells from mixed chimeras generated as in Fig. 1 F that were immunized s.c. with NP-CGG. The percentage of reads with IGHV1-72 among total reads is shown. (K) Simpson’s diversity of Vh usage from repertoire sequencing in J. Data in J and K are from three mice. *, P < 0.05; **, P < 0.01; ***, P < 0.001; ****, P < 0.0001, paired two-tailed Student’s t test.
Figure S4.
Figure S4.
Frequency of GC B cells in pLNs of unimmunized Fas-deficient mice. (A and B) Frequency of GC B cells among total cells in unimmunized pLNs from littermate control or Cr2-cre Fasf/f animals (A) or Aicdacre/+Fasf/+ or Aicdacre/+Fasf/f animals (B). Data are from four and three independent experiments, respectively, with one to four mice per group. (C and D) Intracellular FACS for active caspase-3 in non–NP-binding or NP-binding LZ or DZ GC B cells from pLNs of Aicdacre/+Fasf/+ or Aicdacre/+Fasf/f animals 12 d following s.c. immunization with NP-CGG in alum. Data are from three independent experiments with three to six animals per group. ***, P < 0.001, unpaired two-tailed Student’s t test, for data in A. **, P < 0.01; ***, P < 0.001; ****, P < 0.0001, paired two-tailed Student’s t test, for data in C and D comparing non–NP-binding with NP-binding cells. *, P < 0.05, unpaired two-tailed Student’s t test, for data in C comparing non–NP-binding cell control and Aicdacre/+Fasf/f animals.
Figure 5.
Figure 5.
FAS alterations define a distinct subtype of lethal GC-derived DLBCL. (A) Frequency of FAS mutations (Mut), heterozygous loss (HL), or homozygous deletion (HD) in GCB-DLBCL, ABC-DLBCL, and unclassified cases reported by Schmitz et al. (2018). (B) Frequency of FAS Mut, HL, or HD in genetic subtypes of DLBCL. (C) Comprehensive analysis of nonsynonymous coding mutations of FAS in GCB-DLBCL from published cohorts. Cysteine-rich domains (CRD) 1, 2, and 3; transmembrane (TM) domain; and DD are indicated. (D) Frequency of mutations leading to a FAS protein that is expressed on the surface lacking a DD or mutations predicted to disrupt DD structure. (E and F) Overall survival of GCB-DLBCL (E) or EZB (F) in cases with or without a FAS mut, HL, or HD (ALT). (G and H) Overall survival of GCB-DLBCL (G) or EZB (H) lacking a double-hit signature (DHIT or MYC, respectively) with or without a FAS alteration. (I) Frequency of alterations of selected genes in EZB-MYC FAS ALT, EZB-MYC FAS WT, or EZB-MYC+ cases. (J and K) Overall survival of EZB (J) or EZB-MYC (K) that were FAS ALT or FAS WT TNFRSF14 ALT. (L and M) Frequency of LME-depleted signature (L) or Tfh signature (M) in EZB-MYC FAS ALT, EZB-MYC FAS WT TNFRSF14 ALT, EZB-MYC FAS WT TNFRSF14 WT, or EZB-MYC+ cases. (N) Vh usage in EZB-FAS ALT, EZB-FAS WT TNFRSF14 ALT, or EZB-FAS WT TNFRSF14 WT. The number of cases with identified Vh segments is shown. IGHV3-23 is the most commonly used V gene in the normal human B cell repertoire. IGHV4-34 encodes a self-reactive BCR that is enriched in several non–GC-derived lymphomas. (O) Simpson’s diversity of Vh usage across EZB samples that were FAS ALT, FAS WT TNFRSF14 ALT, or FAS WT TNFRSF14 WT. (P) FAS protein expression assessed on a tissue microarray including GCB-DLBCL. The total number of cases is indicated. **, P < 0.01 Fisher’s exact test of EZB compared with all others in B. *, P < 0.05; **, P < 0.01; ***, P < 0.001; ****,P < 0.0001, log-rank test, for data in E, F, G, H, J, and K. *, P < 0.05; **, P < 0.01; ***, P < 0.001, χ2 test, for data in I. **, P < 0.01, one-way ANOVA, for data in M.
Figure S5.
Figure S5.
Landscape of genetic alterations in FAS mutant EZB DLBCL. (A) Frequency of FAS mutations in GCB-DLBCL, ABC-DLBCL, and unclassified and unknown cases across all published cohorts. (B and C) Overall survival of GCB-DLBCL with or without a FAS copy number alteration (CNA) or mutation from the NCI (A) or BCC (B) cohorts. FAS CNA information was not available in the BCC cohort. (D) Overall survival of ABC-DLBCL with or without a FAS mutation. (E) Landscape of genetic alterations in selected genes, LME signatures, or FAS protein expression assessed in a tissue microarray in EZB-MYC FAS ALT, EZB-MYC FAS WT, or EZB-MYC+ cases. (F) Heatmap of gene signatures used to assess LME signatures in EZB-MYC FAS ALT, FAS WT TNFRSF14 ALT, FAS WT TNFRSF14 WT, or EZB-MYC+ cases. (G) Simpson’s diversity of Vh usage across genetic subtypes of DLBCL. (H) Representative FAS immunohistochemistry in GCB-DLBCL. Scale bar, 50 µm. (I) Overall survival of FAS WT GCB-DLBCL cases with or without FAS protein expression in the BCC cohort. **, P < 0.01, χ2 test of GCB-DLBCL compared with all others in A. *, P < 0.05; **, P < 0.01, log-rank test, for data in B and I.
Figure 6.
Figure 6.
Loss of multiple negative regulators of the T cell–GC B cell integration in FAS mutant EZB DLBCL. (A) Early GCs are seeded by many B cell clones with negligible affinity for the immunizing antigen. Over time, these weakly antigen-binding clones are deleted in a Fas-dependent manner but accumulate in the absence of Fas. (B) GC B cells that do not strongly bind antigen are counterselected via FAS-mediated cell death and diminished T cell help as a result of inhibition of T cell help by HVEM/BTLA and PD-L1/PD-1 interactions (upper left panel). GC B cells that strongly bind antigen are protected from Fas-mediated death, possibly as a result of BCR signaling (upper right panel). In the absence of HVEM, the inhibition of T cell help is weakened, thereby allowing for some expansion of weakly antigen-binding B cell clones, but these cells can still be killed via Fas (lower left panel). With loss of FAS and HVEM (and, in some cases, PD-L1/2), as occurs in FAS-deficient EZB, there is positive feedback between weakly antigen-binding GC B cells and Tfh, promoting expansion of both cell types (lower right panel).

References

    1. Adzhubei, I.A., Schmidt S., Peshkin L., Ramensky V.E., Gerasimova A., Bork P., Kondrashov A.S., and Sunyaev S.R.. 2010. A method and server for predicting damaging missense mutations. Nat. Methods. 7:248–249. 10.1038/nmeth0410-248 - DOI - PMC - PubMed
    1. Afshar-Sterle, S., Zotos D., Bernard N.J., Scherger A.K., Rödling L., Alsop A.E., Walker J., Masson F., Belz G.T., Corcoran L.M., et al. 2014. Fas ligand-mediated immune surveillance by T cells is essential for the control of spontaneous B cell lymphomas. Nat. Med. 20:283–290. 10.1038/nm.3442 - DOI - PubMed
    1. Alabyev, B., Vuyyuru R., and Manser T.. 2008. Influence of Fas on the regulation of the response of an anti-nuclear antigen B cell clonotype to foreign antigen. Int. Immunol. 20:1279–1287. 10.1093/intimm/dxn087 - DOI - PMC - PubMed
    1. Allen, C.D. 2015. Germinal center quality control: death by Fas. Immunity. 42:783–785. 10.1016/j.immuni.2015.05.005 - DOI - PubMed
    1. Arthur, S.E., Jiang A., Grande B.M., Alcaide M., Cojocaru R., Rushton C.K., Mottok A., Hilton L.K., Lat P.K., Zhao E.Y., et al. 2018. Genome-wide discovery of somatic regulatory variants in diffuse large B-cell lymphoma. Nat. Commun. 9:4001. 10.1038/s41467-018-06354-3 - DOI - PMC - PubMed

Publication types

MeSH terms