. 2021 Feb;599(4):1151-1172.
doi: 10.1113/JP280578. Epub 2020 Dec 9.

IRBIT activates NBCe1-B by releasing the auto-inhibition module from the transmembrane domain

Affiliations

IRBIT activates NBCe1-B by releasing the auto-inhibition module from the transmembrane domain

Pan Su et al. J Physiol. 2021 Feb.

Abstract

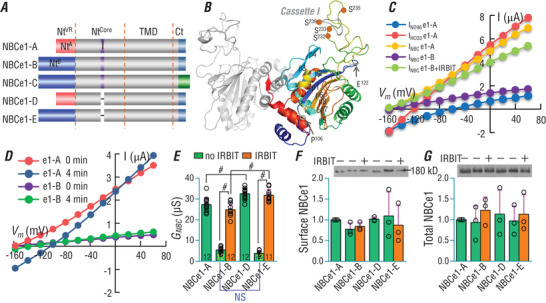
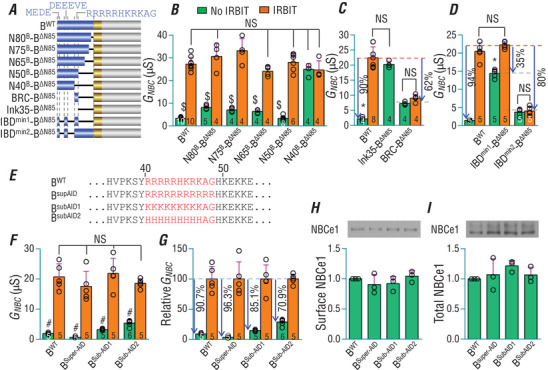
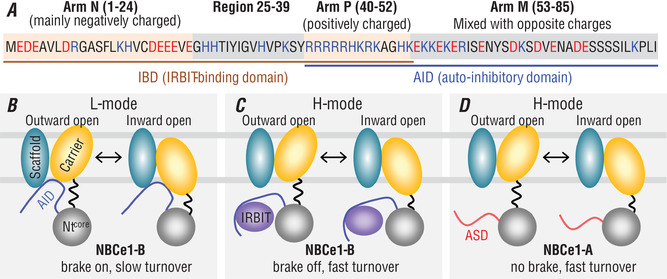
Key points: The electrogenic Na+ /HCO3- cotransporter NBCe1-B is widely expressed in many tissues, including pancreas, submandibular gland, brain, heart, etc. NBCe1-B has very low activity under basal condition due to auto-inhibition, but can be fully activated by protein interaction with the IP3R-binding protein released with inositol 1,4,5-trisphosphate (IRBIT). The structural components of the auto-inhibition domain and the IRBIT-binding domain of NBCe1-B are finely characterized based on systematic mutations in the present study and data from previous studies. Reducing negative charges on the cytosol side of the transmembrane domain greatly decreases the magnitude of the auto-inhibition of NBCe1-B. We propose that the auto-inhibition domain functions as a brake module that inactivates NBCe1-B by binding to, via electrostatic attraction, the transmembrane domain; IRBIT activates NBCe1-B by releasing the brake from the transmembrane domain via competitive binding to the auto-inhibition domain.

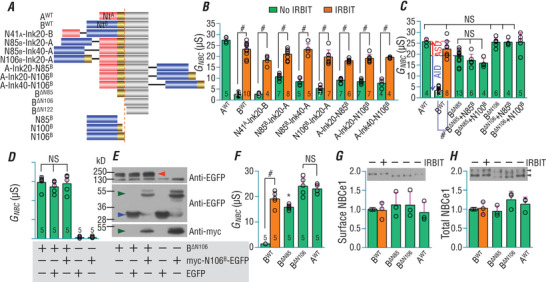
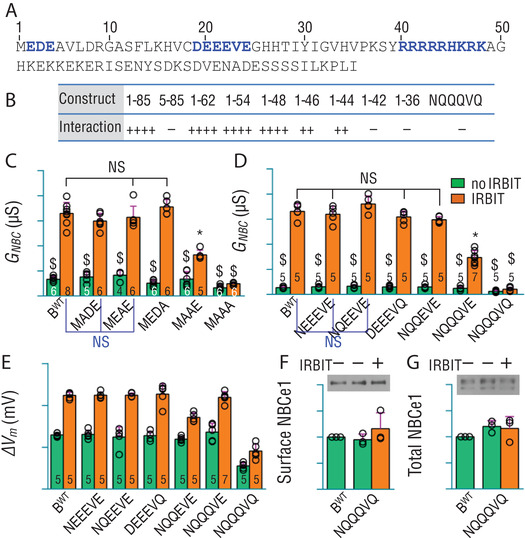
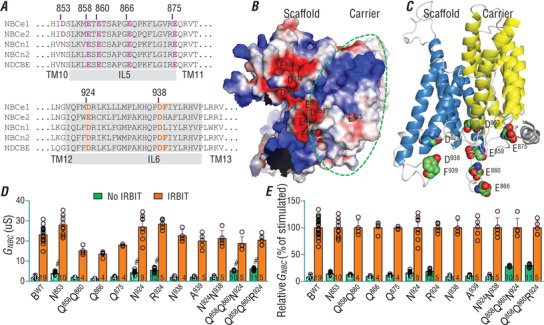
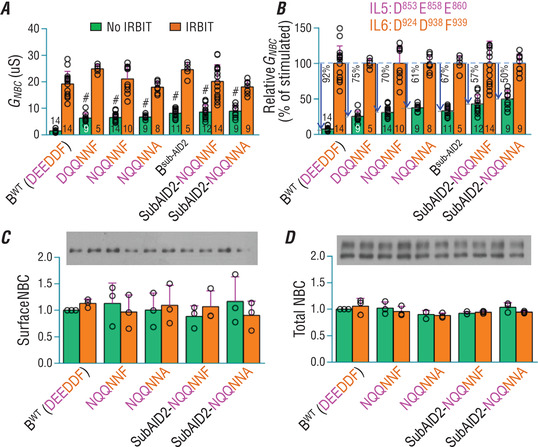
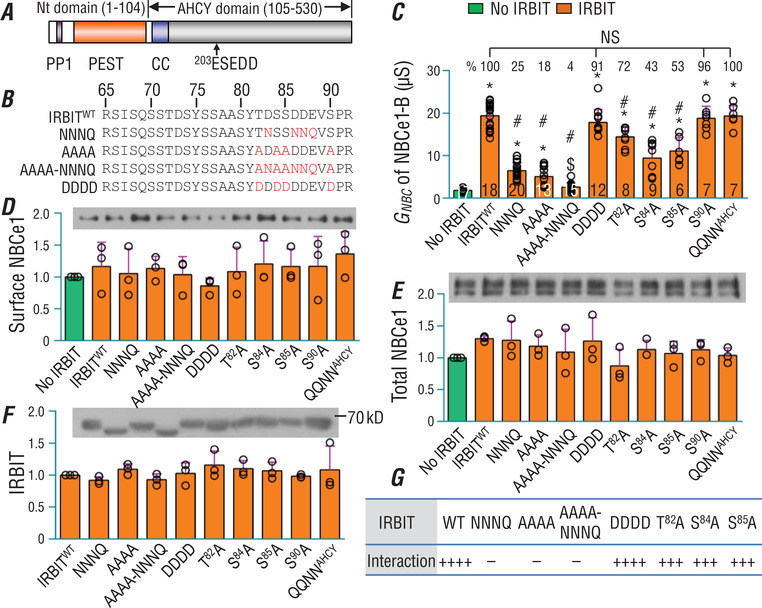
Abstract: The electrogenic Na+ /HCO3- cotransporter NBCe1-B is widely expressed in many tissues in the body. NBCe1-B exhibits only basal activity due to the action of the auto-inhibition domain (AID) in its unique amino-terminus. However, NBCe1-B can be activated by interaction with the IP3R-binding protein released with inositol 1,4,5-trisphosphate (IRBIT). Here, we investigate the molecular mechanism underlying the auto-inhibition of NBCe1-B and its activation by IRBIT. The IRBIT-binding domain (IBD) of NBCe1-B spans residues 1-52, essentially consisting of two arms, one negatively charged (residues 1-24) and the other positively charged (residues 40-52). The AID mainly spans residues 40-85, overlapping with the IBD in the positively charged arm. The magnitude of auto-inhibition of NBCe1-B is greatly decreased by manipulating the positively charged residues in the AID or by replacing a set of negatively charged residues with neutral ones in the transmembrane domain. The interaction between IRBIT and NBCe1-B is abolished by mutating a set of negatively charged Asp/Glu residues (to Asn/Gln) plus a set of Ser/Thr residues (to Ala) in the PEST domain of IRBIT. However, this interaction is not affected by replacing the same set of Ser/Thr residues in the PEST domain with Asp. We propose that: (1) the AID, acting as a brake, binds to the transmembrane domain via electrostatic interaction to slow down NBCe1-B; (2) IRBIT activates NBCe1-B by releasing the brake from the transmembrane domain.

Keywords: IRBIT; NBCe1; SLC4A4; auto-inhibition; bicarbonate transporter; electrostatic interaction.


Figures

Figure 1
Figure 1. Functional comparison of NBCe1 variants in Xenopus oocytes
A, diagram showing primary structure of NBCe1 variants. NtVR: variable region of the initial amino terminus (Nt). NtA: unique Nt of NBCe1‐A (red) containing the auto‐stimulatory domain (ASD). NtB: unique Nt of NBCe1‐B (blue) containing the auto‐inhibitory domain (AID). Ntcore: conserved core region of the Nt. TMD: transmembrane domain. Ct: carboxyl terminus. The purple indicates the optionally spliced cassette I. B, 3‐dimensional model of Ntcore domain of NBCe1. The model was simulated based on the crystal structure of human NDCBE Nt (PDB ID: 5JHO). Cassette I (indicated in grey in the coloured monomer) is located in a poorly folded loop that is rich in Ser and Thr residues. C, representative I‐V curves of an oocyte expressing NBCe1‐A or NBCe1‐B ± IRBIT in ND96 and 5% CO2/33 mm HCO3 . D, comparison of electrophysiology recordings for day‐matched oocytes expressing NBCe1‐A or ‐B at time 0 and 4 min after switch from ND96 to CO2/HCO3 . Shown here are representative of four independent recordings. E, summary of G NBC of NBCe1 with or without IRBIT. G NBC represents the slope conductance of I NBC between ±40 mV calculated from experiments like those shown in panel C. F and G, expression and abundance of NBCe1 in surface (F) and total fractions (G) of Xenopus oocytes. NBCe1 was probed with anti‐EGFP. The protein abundance was normalized to NBCe1‐A. The numerals on the bars indicate the number of individual oocytes. Panels F and G represent the average of three experiments. Green bars: without IRBIT. Orange bars: with IRBIT. #Statistically significant. NS: not significant. One‐way ANOVA followed by post hoc Tukey's comparison was performed for statistical analysis. Numerical values for all bars and detailed results of statistical tests are provided as Supporting information in Statistical Summary Tables 1E−1G.
Figure 2
Figure 2. AID is inhibitory at both Nt and Ct ends, but requires covalent linkage to NBCe1
A, diagram showing the design of constructs. Red: NtA, the unique Nt of NBCe1‐A (red) containing the ASD; blue: NtB, the unique Nt of NBCe1‐B (blue) containing the AID; gold: region 86−106; grey: residues 107 to Ct end (amino‐acid numbering according to NBCe1‐B). B, IRBIT stimulates NBCe1 variants simultaneously containing AID and ASD. C, isolated AID‐containing Nt fragments of NBCe1‐B have no effect on the functional expression of BΔN85 and BΔN106. The blue arrow indicates the AID effect. The red arrow indicates the ASD effect. D, Myc‐N106B‐EGFP has no effect on the functional expression of BΔN106. E, western blot showing the expression of BΔN106 (indicated by red triangle) and Myc‐N106B‐EGFP (indicated by green triangle). Blue triangle indicates EGFP. F, comparison of G NBC of BWT, BΔN85, BΔN106 and AWT. G and H, expression and relative abundance of AWT, BWT, BΔN85 and BΔN106 in surface and total fractions of Xenopus oocytes. The protein abundance was normalized to BWT without IRBIT. The two bands indicated by triangles in the total fraction presumably represent glycosylated vs. non‐glycosylated NBCe1 (Choi et al. 2003). The numerals on the bars in panels BD and F indicate the number of individual oocytes. Panels G and H each represent the average of three experiments. Green bars: without IRBIT. Orange bars: with IRBIT. #Significantly different from the corresponding bar without IRBIT (two‐tailed unpaired Student's t test). *BΔN85 is significantly different from BΔN106 and AWT. NSBars in the group not significant from each other. For multiple comparisons, one‐way ANOVA followed by post hoc Tukey's comparison was performed. In panel E, red triangle indicates BΔN106; blue triangle indicates EGFP; green triangle indicates myc‐N106B‐EGFP. For voltage clamp recordings, NBCe1 variants were always analysed with day‐matched BWT. Numerical values for all bars and detailed results of statistical tests are provided as Supporting information in Statistical Summary Tables 2B−D and 2F−H.
Figure 3
Figure 3. Identification and characterization of structural elements in NtB essential for IRBIT binding
A, primary amino‐acid sequence of NtB. The blue indicates elements essential for IRBIT binding. B, summary of yeast two‐hybrid results for protein interaction between NtB fragments and IRBIT. The construct name indicates regions of NtB used for yeast two‐hybrid assay. NQQQVQ: full‐length NtB variant with ‘DEEEVE’ replaced by ‘NQQQVQ’. ‘++++’: strong protein interaction; ‘++’: weak interaction; ‘−’: no detectable interaction by yeast two‐hybrid assay. The strength of protein interaction between NtB fragments and IRBIT was judged based on the number and colour‐intensity of blue colonies on quadruple‐dropout medium (QDO). C, effect of perturbing residues in ‘MEDE’ on NBCe1‐B stimulation by IRBIT. D, effect of perturbing residues in DEEEVE on NBCe1‐B stimulation by IRBIT. E, summary of maximum hyperpolarization of oocytes expressing NBCe1 variants. F and G, expression and relative abundance of BWT, NQQQVQ ± IRBIT in surface and total fractions of Xenopus oocytes. The protein abundance was normalized to BWT without IRBIT. For voltage clamp measurements, NBCe1 mutants were analysed with day‐matched BWT. The numerals on the bars indicate the number of individual oocytes. Panels F and G each represent the average of three experiments. Green bars: without IRBIT. Orange bars: with IRBIT. $Bars are not significantly different from BWT. NSBars in the group are not significantly different from each other. *Bar is significantly different from all other bars. One‐way ANOVA followed by post hoc Tukey's comparison was performed for statistical analysis. Numerical values for all bars and detailed results of statistical tests are provided as Supporting information in Statistical Summary Tables 3C−3G.
Figure 4
Figure 4. Minimum structural requirements for IRBIT binding and effect of mutation to ‘basic cluster’ on the magnitude of auto‐inhibition of NBCe1‐B
A, diagram showing the design of NBCe1‐B variants. Blue boxes represent elements of NtB. Gold boxes represent region 86−106 of NBCe1‐B. Lines indicate GS‐linkers (repeats of ‘GGGGS’). The length of the GS‐linker matches the length of the replaced region of NBCe1‐B. B−D, summary of G NBC of NBCe1‐B variants (with different parts of NtB) ± IRBIT. E, mutation to ‘basic cluster’ of NBCe1‐B. F, summary of G NBC of ‘basic‐cluster’ variants ± IRBIT. G, relative G NBC of ‘basic‐cluster’ variants as percentiles of the corresponding stimulated ones. To obtain the relative G NBC, the G NBC of each individual oocyte contributed to the bars in panel F was normalized to the average G NBC of the same variant activated by IRBIT. The percentile difference between the non‐activated vs. the IRBIT‐activated G NBC indicates the magnitude of auto‐inhibition. H and I, expression and relative abundance of BWT, BSuper‐AID, BSub‐AID1 and BSub‐AID2 in the surface and total fractions of Xenopus oocytes. The protein abundance was normalized to BWT. NBCe1 was probed with anti‐EGFP. For voltage clamp recordings, mutants were always analysed with day‐matched BWT. The numerals on the bars indicate the number of individual oocytes. Panels H and I each represent the average of three experiments. Green bars: without IRBIT. Orange bars: with IRBIT. NSThese groups are not significantly different from each other. $Groups are not significantly different from each other. *The group is significantly different from all other groups. #These four groups are significantly different from each other. One‐way ANOVA followed by post hoc Tukey's comparison was performed for statistical analysis. Numerical values for all bars and detailed results of statistical tests are provided as Supporting information in Statistical Summary Tables 4B−4D and 4F−4I.
Figure 5
Figure 5. Screening for potential AID‐binding targets in the transmembrane domain of NBCe1
A, sequence alignment of intracellular loop IL5 and IL6 of NBCe1, NBCe2, NBCn1, NBCn2 and NDCBE. Purple in IL5 and orange in IL6 of NBCe1 indicate the negatively charged or aromatic residues manipulated in the present study. Most of these residues are conserved in other NBC members. B, bottom view of 3‐dimension structure of NBCe1 transmembrane domain showing the electrostatic surface of the intracellular side. Red indicates negatively charged surface area. Blue indicates positively charged surface area. The region surrounded by a dashed green line represents the carrier domain. C, side view of 3‐dimensional structure of NBCe1 transmembrane domain. Yellow represents the carrier domain. Blue represents the scaffold domain. Shown as spheres are the acidic and aromatic residues in the IL5 and IL6 that are presumably involved in the binding of AID. Red spheres = O, green spheres = C and blue spheres = N. D, functional expression of different NBCe1 constructs with and without IRBIT in Xenopus oocytes. E, relative G NBC as percentile of the stimulated NBCe1. The 3‐dimensional model of mouse NBCe1 was simulated based on the cryo‐EM structure of human NBCe1 (PDB ID 6CAA) by using SWISS‐MODEL and visualized using the PyMOL Molecular Graphics System (Version 2.0 Schrödinger, LLC). For voltage clamp recordings, NBCe1 mutants were always analysed with day‐matched oocytes expressing BWT. The relative G NBC was calculated as in Fig. 4 G. Green bars: without IRBIT. Orange bars: with IRBIT. The numerals on the bars indicate the number of individual oocytes. #Significantly different from BWT by one‐way ANOVA followed by post hoc Tukey's comparison among the groups without IRBIT. Numerical values for all bars and detailed results of statistical tests are provided as Supporting information in Statistical Summary Tables 5D and 5E. [Correction made on 6 January 2021, after first online publication: The label of the y axis in Figure 5D was changed from ‘GHCO3 (uS)’ to ‘GNBC (uS)’ to be consistent with the bar graphs of the rest of the figures.]
Figure 6
Figure 6. Manipulating residues in TMD decreases the magnitude of NBCe1‐B auto‐inhibition
A, functional expression of different NBCe1 constructs with and without IRBIT in Xenopus oocytes. B, relative G NBC as a percentile of the stimulated NBCe1. For voltage clamp recordings, NBCe1 mutants were always analysed with day‐matched oocytes expressing BWT. The relative G NBC was calculated as in Fig. 4 G. The numerals on the bars indicate the number of individual oocytes. #Significantly different from BWT and all orange bars. C and D, expression and relative abundance of selected NBCe1 variants in surface (C) and total fractions (D) of Xenopus oocytes. The protein abundance was normalized to BWT without IRBIT. The numerals on the bars indicate the number of individual oocytes. Panels C and D each represent the average of three experiments. Green bars: without IRBIT. Orange bars: with IRBIT. ANOVA followed by post hoc Tukey's comparison was performed for statistical analysis. Numerical values for all bars and detailed results of statistical tests are provided as Supporting information in Statistical Summary Tables 6A−6D.
Figure 7
Figure 7. Effects of mutation to charged residues and potential phosphorylation sites in PEST domain of IRBIT on its interaction with NBCe1‐B
A, diagram to show the module structure of IRBIT. IRBIT contains a unique Nt domain and an AHCY domain that is homologous to the adenosylhomocysteine hydrolase. The PEST domain, a core portion in the unique Nt, is rich in acidic residues and potential phosphorylation sites. PP1: putative protein phosphatase 1 binding site. CC: coiled‐coil domain. B, alignment to show mutations to the PEST domain in IRBIT variants. C, stimulatory effects of IRBIT variants on NBCe1‐B activity. The percentages above the orange bars indicate the stimulatory effect of IRBIT variants on NBCe1‐B relative to that of WT IRBIT, computed by (G NBC mutant IRBIT – G NBC No IRBIT)/(G NBC WT IRBIT – G NBC No IRBIT). D and E, expression and abundance of NBCe1‐B in surface (D) and total (E) fractions of Xenopus oocytes relative to control ‘No IRBIT’ (i.e. BWT only). F, expression of IRBIT in total fraction of Xenopus oocytes relative to wild‐type (WT) IRBIT. G, summary of results of a yeast two‐hybrid assay for protein interaction between NtB and IRBIT variants. The numerals on the bars indicate the number of individual oocytes. Panels DF each represent the average of three experiments. Green bars: without IRBIT. Orange bars: with IRBIT. $Not significantly different from the control ‘No IRBIT’. *Bars significantly different from the control ‘No IRBIT’. #Bars significantly different from wild‐type IRBIT. NS: bars in this group are not significantly different from each other. One‐way ANOVA followed post hoc Tukey's comparison was performed for statistical analysis. The number of ‘+’ signs in panel G indicates the relative strength of protein interaction. ‘−’ signs indicate no detectable protein interaction by yeast two‐hybrid assay. The strength of protein interaction between NtB fragments and IRBIT was judged based on the number and colour‐intensity of blue colonies on the quadruple‐dropout (QDO) medium. Numerical values for all bars and detailed results of statistical tests are provided as Supporting information in Statistical Summary Tables 7C−7F.
Figure 8
Figure 8. Proposed mechanisms for the auto‐inhibition and activation of NBCe1‐B by IRBIT and high‐activity of NBCe1‐A
A, functional modules of unique Nt of NBCe1‐B. IRBIT‐binding domain (IBD) consists of structural elements in the Nt half. The two acidic motifs ‘EDE’ and ‘DEEEVE’ in negatively charged Arm N and the ‘basic cluster’ in positively charged Arm P are essential for IRBIT binding. Region 25−39 also contains elements important for IRBIT binding. The auto‐inhibitory domain (AID) consists of elements in the Ct half including Arm P and Arm M (mixed with opposite charges). Red indicates residues that could be negatively charged, whereas blue indicates residues that could be positively charged. B, NBCe1‐B functions in low activity mode (L‐mode) in the absence of IRBIT. Here, the AID functions as a brake module by binding to the MTD of NBCe1‐B, and thus slows down the turnover rate of the transporter. In the TMD, both the scaffold domain and the carrier domain presumably contain binding sites for the AID. C, NBCe1‐B functions in high activity mode (H‐mode) in the presence of IRBIT. The binding of IRBIT to IBD releases the brake from the TMD, resulting in full turnover rate of the transporter. D, NBCe1‐A constitutively functions in H‐mode due to lacking a brake module.

Similar articles

Cited by

References

    1. Abuladze N, Lee I, Newman D, Hwang J, Boorer K, Pushkin A & Kurtz I (1998). Molecular cloning, chromosomal localization, tissue distribution, and functional expression of the human pancreatic sodium bicarbonate cotransporter. J Biol Chem 273, 17689–17695. - PubMed
    1. Alvadia CM, Sommer T, Bjerregaard‐Andersen K, Damkier HH, Montrasio M, Aalkjaer C & Morth JP (2017). The crystal structure of the regulatory domain of the human sodium‐driven chloride/bicarbonate exchanger. Sci Rep 7, 12131. - PMC - PubMed
    1. Ando H, Mizutani A, Kiefer H, Tsuzurugi D, Michikawa T & Mikoshiba K (2006). IRBIT suppresses IP3 receptor activity by competing with IP3 for the common binding site on the IP3 receptor. Mol Cell 22, 795–806. - PubMed
    1. Ando H, Mizutani A, Matsu‐ura T & Mikoshiba K (2003). IRBIT, a novel inositol 1,4,5‐trisphosphate (IP3) receptor‐binding protein, is released from the IP3 receptor upon IP3 binding to the receptor. J Biol Chem 278, 10602–10612. - PubMed
    1. Arakawa T, Kobayashi‐Yurugi T, Alguel Y, Iwanari H, Hatae H, Iwata M, Abe Y, Hino T, Ikeda‐Suno C, Kuma H, Kang D, Murata T, Hamakubo T, Cameron AD, Kobayashi T, Hamasaki N & Iwata S (2015). Crystal structure of the anion exchanger domain of human erythrocyte band 3. Science 350, 680–684. - PubMed

Publication types

MeSH terms