. 2021 Jun;109(6):1528-1537.
doi: 10.1002/cpt.2122. Epub 2020 Dec 17.

Pharmacogenetics at Scale: An Analysis of the UK Biobank

Affiliations

Pharmacogenetics at Scale: An Analysis of the UK Biobank

Gregory McInnes et al. Clin Pharmacol Ther. 2021 Jun.

Abstract

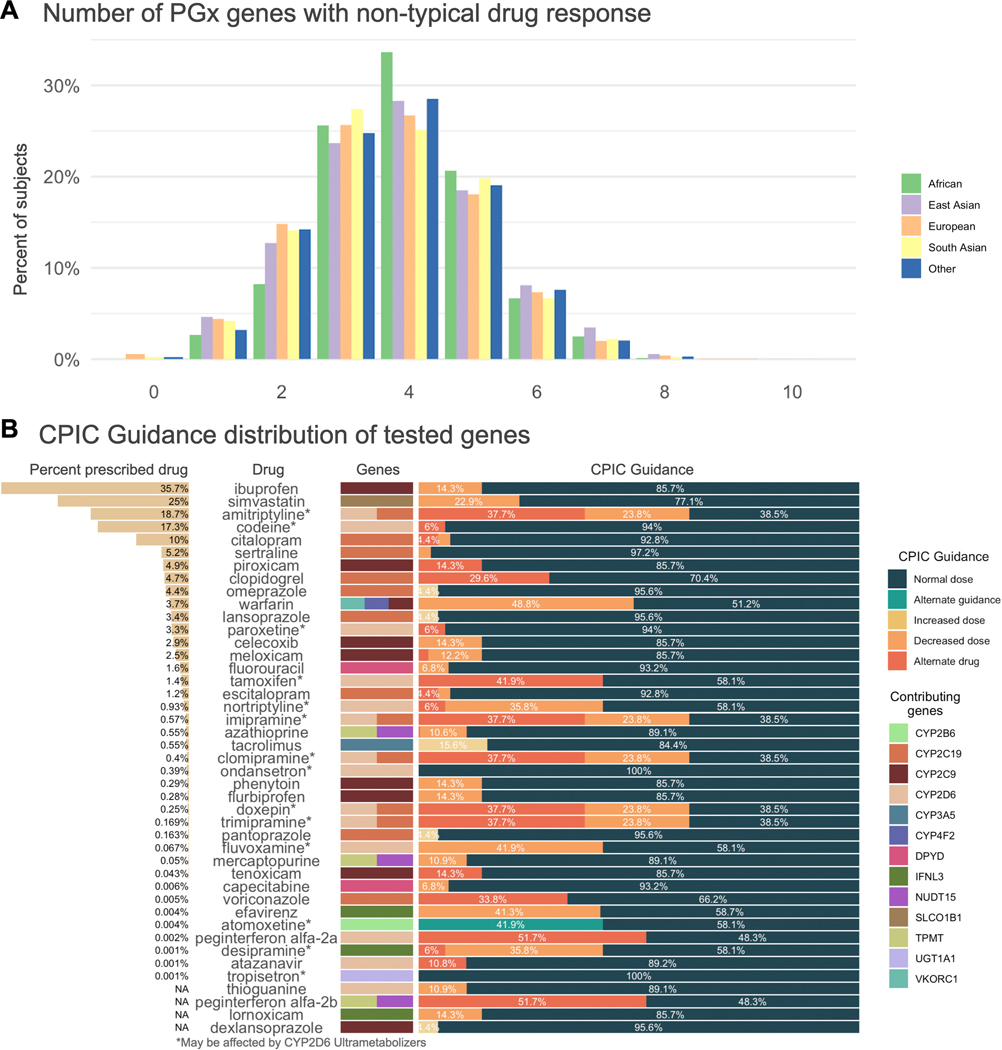
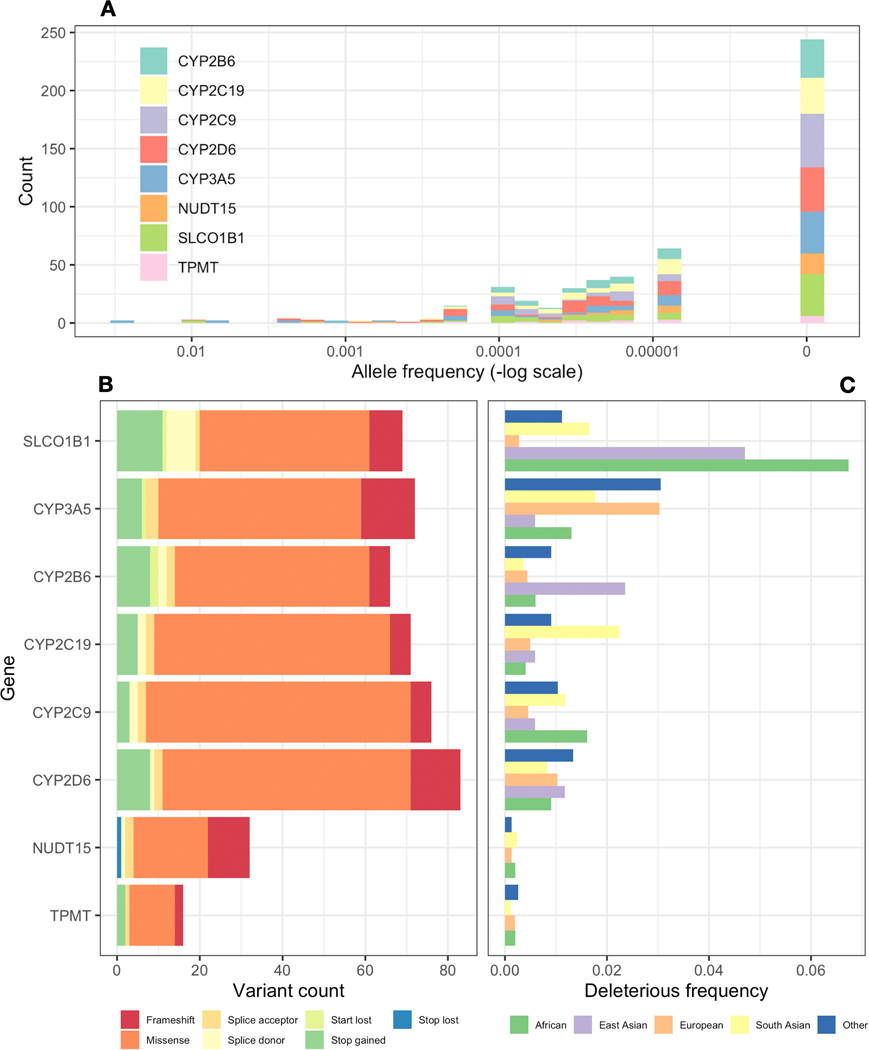
Pharmacogenetics (PGx) studies the influence of genetic variation on drug response. Clinically actionable associations inform guidelines created by the Clinical Pharmacogenetics Implementation Consortium (CPIC), but the broad impact of genetic variation on entire populations is not well understood. We analyzed PGx allele and phenotype frequencies for 487,409 participants in the UK Biobank, the largest PGx study to date. For 14 CPIC pharmacogenes known to influence human drug response, we find that 99.5% of individuals may have an atypical response to at least 1 drug; on average they may have an atypical response to 10.3 drugs. Nearly 24% of participants have been prescribed a drug for which they are predicted to have an atypical response. Non-European populations carry a greater frequency of variants that are predicted to be functionally deleterious; many of these are not captured by current PGx allele definitions. Strategies for detecting and interpreting rare variation will be critical for enabling broad application of pharmacogenetics.


Conflict of interest statement

Conflict of Interests

R.B.A. is a stockholder in Personalis.com, 23andme.com. All other authors declared no competing interests for this work.

Figures

Figure 1.
Figure 1.
Analysis workflow. Our analysis comprises three data types, data imputed from genotype arrays, exome sequencing data, and an integrated call set that combines both. We phase all datasets using statistical phasing with Eagle2. We then generate pharmacogenetic alleles for all samples using PGxPOP and generate a report of the matching star allele, the variants contributing to that call, and the resulting phenotype.
Figure 2.
Figure 2.
Concordance between diplotypes called from imputed data and integrated call sets reveal inefficiencies in data imputed from genotypes. The concordance is the proportion of diplotypes that exactly matched between the two call sets. We calculated population-specific concordance between the imputed data and integrated call sets. This comparison highlights the differences in the coding regions only, as the non-coding regions in the integrated call set are derived from the imputed data. Difference colors represent different global populations.
Figure 3.
Figure 3.
Star allele and phenotype frequencies for cytochrome P450 genes. Frequencies shown here are generated from the integrated call set which comprises nearly 50,000 subjects. The star allele frequency plots show all star alleles occurring with a frequency of 3% or greater. Any haplotypes with under 3% allele frequency in all populations are grouped into “Other”. Combination alleles, alleles that contain either partial or full matches of more than one star allele on the same strand occurring with less than 3% allele frequency are grouped in “Other combos”. The number of alleles in “Other” and “Other combos” is shown in the legend for each gene. Note that allele and phenotype frequencies for CYP2D6 do not include structural variants.
Figure 4.
Figure 4.
Star allele and phenotype frequencies for non-cytochrome P450 genes. Frequencies shown here are generated from the integrated call set which comprises nearly 50,000 subjects. The star allele frequency plots show all star alleles occurring with a frequency of 3% or greater. Any haplotypes with under 3% allele frequency in all populations are grouped into “Other”. Combination alleles, alleles that contain either partial or full matches of more than one star allele on the same strand occurring with less than 3% allele frequency are grouped in “Other combos”. The number of alleles in “Other” and “Other combos” is shown in the legend for each gene. SLCO1B1 star alleles are determined excluding synonymous variants.
Figure 5.
Figure 5.
Frequency of pharmacogenes with a predicted non-typical response across the study population derived from the integrated call set and CPIC guideline recommendations for 45 drugs. a) The distribution of non-typical response alleles across each of the populations included in this study. Frequency of non-typical response pharmacogene alleles per subject range from 0 to 10, with a mean of 3.7. b) CPIC dosage guidance for 45 drugs that include recommendations based on any of the fourteen genes included in this study. We show the percent of the population that has ever been prescribed the drug, the drug name, the genes from this study that contribute to the recommendation, and the distribution of CPIC recommendations.
Figure 6.
Figure 6.
Analysis of deleterious variants not contained within existing star allele definitions. We identified presumptive deleterious variants in the exome sequencing data for eight genes by identifying probable loss of function variants as well as predicted deleterious missense variants. (a) shows the allele frequency of each probable deleterious variant in gnoMAD. Variants with an allele frequency of 0 were not identified in gnoMAD. (b) shows the number of deleterious variants identified as well as the frequency of each type of variant. (c) shows the total frequency of any deleterious variant in each population in the exome data. Concretely, the frequency represents the sum of allele frequencies for all deleterious variants not found within existing star allele definitions for each population.

References

    1. 2016 NAMCS Summary Web Tables. At <https://www.cdc.gov/nchs/data/ahcd/namcs_summary/2016_namcs_web_tables.pdf>
    1. Van Driest SL et al. Clinically actionable genotypes among 10,000 patients with preemptive pharmacogenomic testing. Clin. Pharmacol. Ther 95, 423–431 (2014). - PMC - PubMed
    1. Reisberg S. et al. Translating genotype data of 44,000 biobank participants into clinical pharmacogenetic recommendations: challenges and solutions. Genet. Med (2018).doi:10.1038/s41436-018-0337-5 - DOI - PMC - PubMed
    1. Bush WS et al. Genetic variation among 82 pharmacogenes: The PGRNseq data from the eMERGE network. Clin. Pharmacol. Ther 100, 160–169 (2016). - PMC - PubMed
    1. Lavertu A. et al. Pharmacogenomics and big genomic data: from lab to clinic and back again. Hum. Mol. Genet 27, R72–R78 (2018). - PMC - PubMed

Publication types