

Bayesian models of human navigation behaviour in an augmented reality audiomaze
- PMID: 33237612
- PMCID: PMC9292259
- DOI: 10.1111/ejn.15061
Bayesian models of human navigation behaviour in an augmented reality audiomaze
Abstract
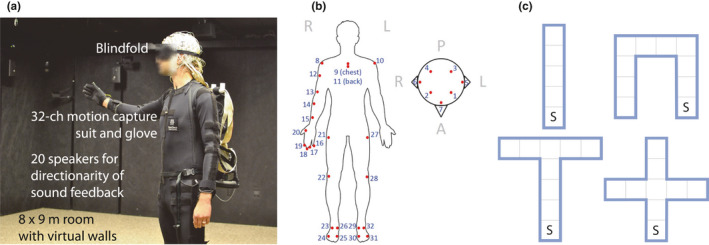
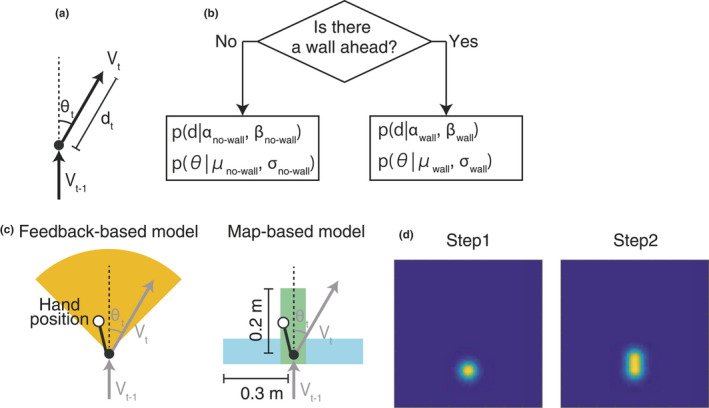
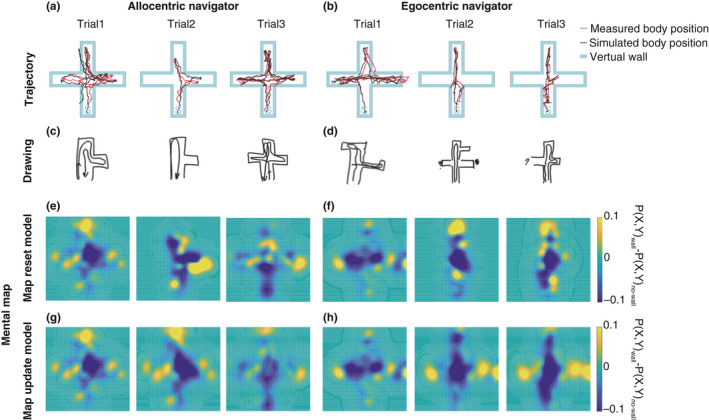
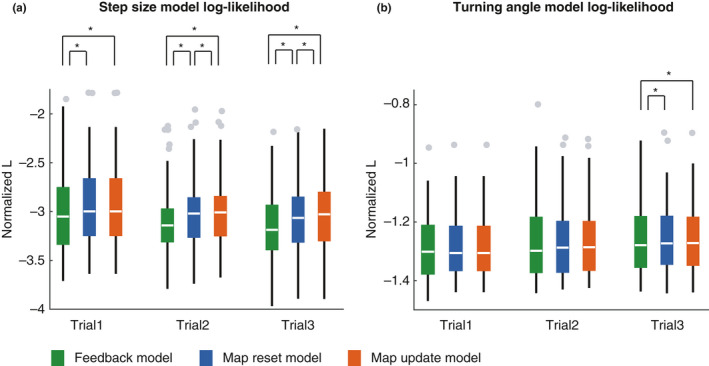
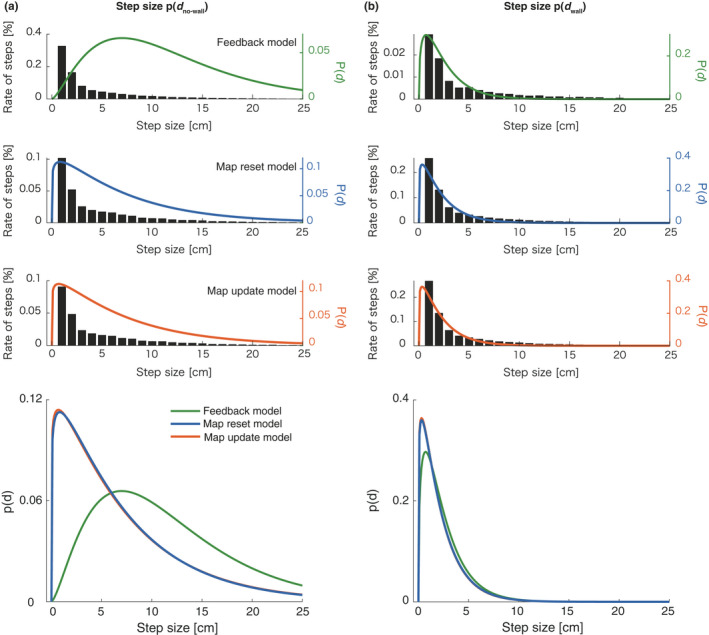
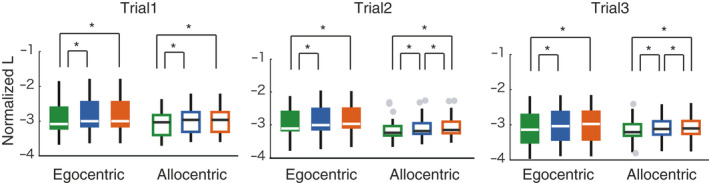
We investigated Bayesian modelling of human whole-body motion capture data recorded during an exploratory real-space navigation task in an "Audiomaze" environment (see the companion paper by Miyakoshi et al. in the same volume) to study the effect of map learning on navigation behaviour. There were three models, a feedback-only model (no map learning), a map resetting model (single-trial limited map learning), and a map updating model (map learning accumulated across three trials). The estimated behavioural variables included step sizes and turning angles. Results showed that the estimated step sizes were constantly more accurate using the map learning models than the feedback-only model. The same effect was confirmed for turning angle estimates, but only for data from the third trial. We interpreted these results as Bayesian evidence of human map learning on navigation behaviour. Furthermore, separating the participants into groups of egocentric and allocentric navigators revealed an advantage for the map updating model in estimating step sizes, but only for the allocentric navigators. This interaction indicated that the allocentric navigators may take more advantage of map learning than do egocentric navigators. We discuss relationships of these results to simultaneous localization and mapping (SLAM) problem.
Keywords: allocentric navigator; egocentric navigator; map generation; real-space navigation.
© 2021 The Authors. European Journal of Neuroscience published by Federation of European Neuroscience Societies and John Wiley & Sons Ltd.
Conflict of interest statement
The authors declare no competing financial interests.
Figures
Similar articles
-
Brain Dynamics of Spatial Reference Frame Proclivity in Active Navigation.IEEE Trans Neural Syst Rehabil Eng. 2021;29:1701-1710. doi: 10.1109/TNSRE.2021.3106174. Epub 2021 Aug 30. IEEE Trans Neural Syst Rehabil Eng. 2021. PMID: 34410926
-
Incidental learning of allocentric and egocentric strategies by both men and women in a dual-strategy virtual Morris Water Maze.Behav Brain Res. 2019 May 17;364:281-295. doi: 10.1016/j.bbr.2019.02.032. Epub 2019 Feb 19. Behav Brain Res. 2019. PMID: 30794853
-
The AudioMaze: An EEG and motion capture study of human spatial navigation in sparse augmented reality.Eur J Neurosci. 2021 Dec;54(12):8283-8307. doi: 10.1111/ejn.15131. Epub 2021 Feb 23. Eur J Neurosci. 2021. PMID: 33497490
-
Dissociating spatial strategies in animal research: Critical methodological review with focus on egocentric navigation and the hippocampus.Neurosci Biobehav Rev. 2021 Jul;126:57-78. doi: 10.1016/j.neubiorev.2021.03.022. Epub 2021 Mar 23. Neurosci Biobehav Rev. 2021. PMID: 33771535 Review.
-
Egocentric and Allocentric Spatial Memory in Mild Cognitive Impairment with Real-World and Virtual Navigation Tasks: A Systematic Review.J Alzheimers Dis. 2021;79(1):95-116. doi: 10.3233/JAD-201017. J Alzheimers Dis. 2021. PMID: 33216034 Free PMC article.
Cited by
-
Time to move: Brain dynamics underlying natural action and cognition.Eur J Neurosci. 2021 Dec;54(12):8075-8080. doi: 10.1111/ejn.15562. Eur J Neurosci. 2021. PMID: 34904290 Free PMC article.
References
-
- Adomi, M. , Shikauchi, Y. , & Ishii, S. (2010). Hidden Markov model for human decision process in a partially observable environment. ICANN 2010, Part Ⅱ, LNCS 6353, 94–103.
-
- Bailey, T. , & Durrant‐Whyte, H. (2006). Simultaneous localization and mapping (SLAM): Part II. IEEE Robotics & Automation Magazine, 13, 108–117. 10.1109/MRA.2006.1678144 - DOI
-
- Banino, A. , Barry, C. , Uria, B. , Blundell, C. , Lillicrap, T. , Mirowski, P. , Pritzel, A. , Chadwick, M. J. , Degris, T. , Modayil, J. , Wayne, G. , Soyer, H. , Viola, F. , Zhang, B. , Goroshin, R. , Rabinowitz, N. , Pascanu, R. , Beattie, C. , Petersen, S. , … Kumaran, D. (2018). Vector‐based navigation using grid‐like representations in artificial agents. Nature, 557, 429–433. 10.1038/s41586-018-0102-6 - DOI - PubMed
