

Matching methods in precision oncology: An introduction and illustrative example
- PMID: 33237632
- PMCID: PMC7963415
- DOI: 10.1002/mgg3.1554
Matching methods in precision oncology: An introduction and illustrative example
Abstract
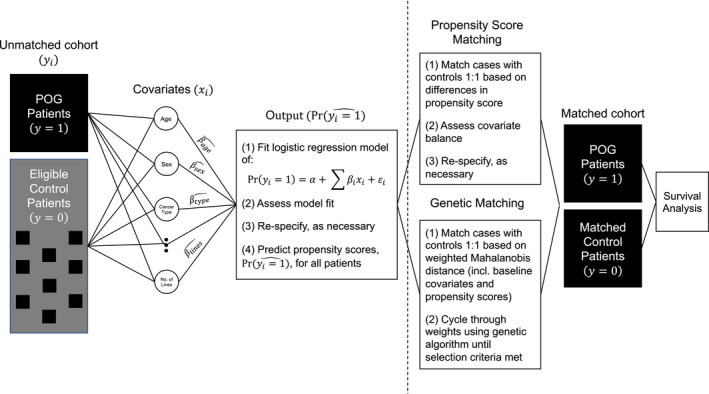
Background: Randomized controlled trials (RCTs) are uncommon in precision oncology. We provide an introduction and illustrative example of matching methods for evaluating precision oncology in the absence of RCTs. We focus on British Columbia's Personalized OncoGenomics (POG) program, which applies whole-genome and transcriptome analysis (WGTA) to inform advanced cancer care.
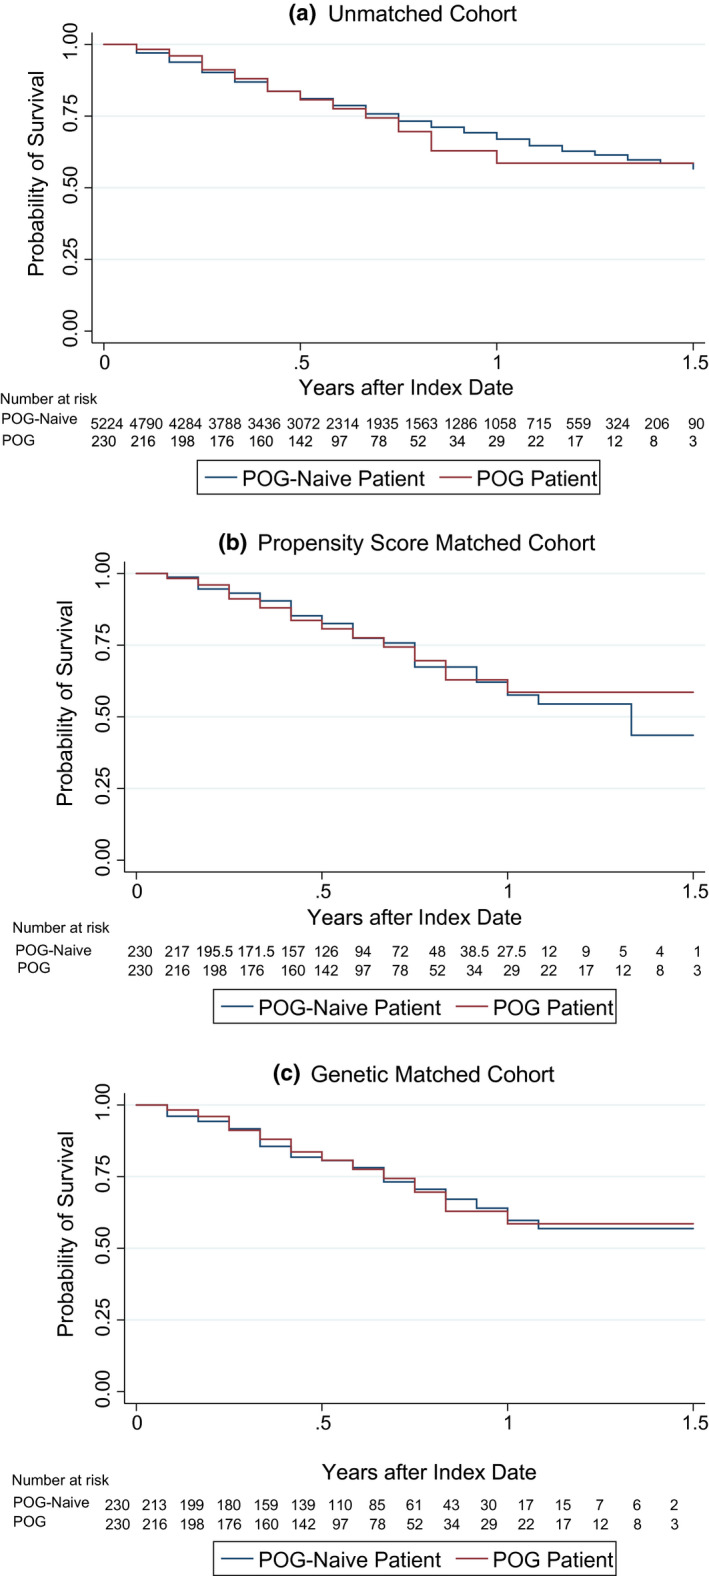
Methods: Our cohort comprises 230 POG patients enrolled between 2014 and 2015 and matched POG-naive controls. We generated our matched cohort using 1:1 propensity score matching (PSM) and genetic matching prior to exploring survival differences.
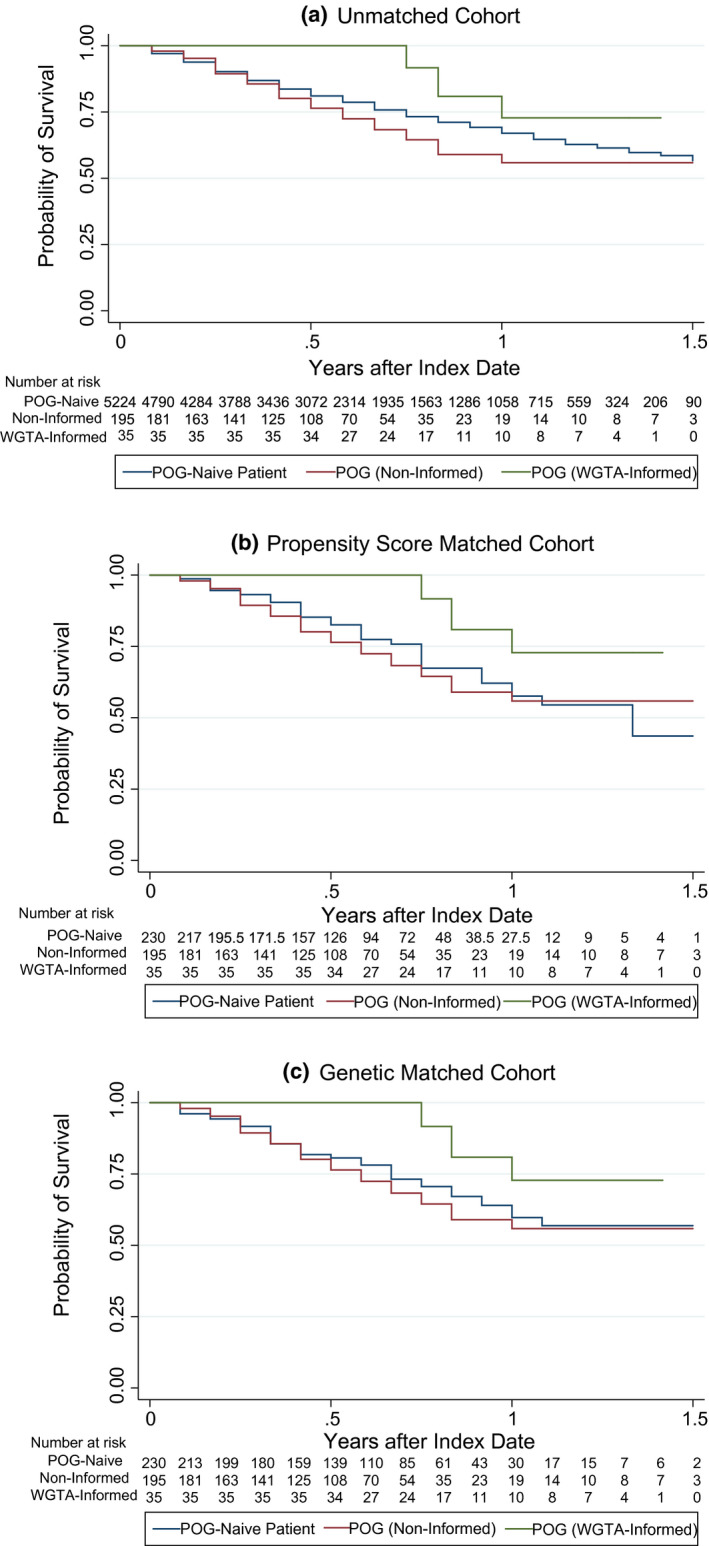
Results: We find that genetic matching outperformed PSM when balancing covariates. In all cohorts, overall survival did not significantly differ across POG and POG-naive patients (p > 0.05). Stratification by WGTA-informed treatment indicated unmatched survival differences. Patients whose WGTA information led to treatment change were at a reduced hazard of death compared to POG-naive controls in all cohorts, with estimated hazard ratios ranging from 0.33 (95% CI: 0.13, 0.81) to 0.41 (95% CI: 0.17, 0.98).
Conclusion: These results signal that clinical effectiveness of precision oncology approaches will depend on rates of genomics-informed treatment change. Our study will guide future evaluations of precision oncology and support reliable effect estimation when RCT data are unavailable.
Keywords: administrative data; genomic sequencing; matching; precision medicine; quasi-experimental methods.
© 2020 The Authors. Molecular Genetics & Genomic Medicine published by Wiley Periodicals LLC.
Conflict of interest statement
Deirdre Weymann, Steven J.M. Jones, Robyn Roscoe, Sophie Sun, Kasmintan A. Schrader, and Marco A. Marra report no conflicts of interest. Janessa Laskin has received honoraria, ad boards, and institutional grant funding from Roche, BI, AstraZeneca, and Takeda. Howard Lim has received honoraria from Eisai, Taiho, Roche, Lilly, Amgen, and Leo and is an investigator on trials with Bayer, BMS, Lilly, Roche, AstraZeneca, and Amgen. Daniel J. Renouf has received research funding and honoraria from Bayer and Roche, as well as travel funding and honoraria from Servier, Celgene, Taiho, and Ipsen. Sophie Sun has received research grant and honoraria funding from AstraZeneca. Stephen Yip is an advisory board member of Roche, Bayer and Pfizer and has received honoraria form Amgen. Dean A. Regier has received travel support from Illumina.
Figures
References
-
- Abadie, A. , & Imbens, G. W. (2008). On the failure of the bootstrap for matching estimators. Econometrica, 76, 1537–1557.
-
- Akaike, H. (1974). A new look at the statistical model identification. IEEE Transactions on Automatic Control, 19, 716–723.
-
- Austin, P. C. (2009). The relative ability of different propensity score methods to balance measured covariates between treated and untreated subjects in observational studies. Medical Decision Making, 29, 661–677. - PubMed
Publication types
MeSH terms
Grants and funding
LinkOut - more resources
Full Text Sources
Medical
Miscellaneous
