Review
. 2021 Jan 1;94(1117):20200780.
doi: 10.1259/bjr.20200780. Epub 2020 Nov 25.

Multimodality cardiac imaging in the 21st century: evolution, advances and future opportunities for innovation

Affiliations
Review

Multimodality cardiac imaging in the 21st century: evolution, advances and future opportunities for innovation

Melissa A Daubert et al. Br J Radiol. .

Abstract

Cardiovascular imaging has significantly evolved since the turn of the century. Progress in the last two decades has been marked by advances in every modality used to image the heart, including echocardiography, cardiac magnetic resonance, cardiac CT and nuclear cardiology. There has also been a dramatic increase in hybrid and fusion modalities that leverage the unique capabilities of two imaging techniques simultaneously, as well as the incorporation of artificial intelligence and machine learning into the clinical workflow. These advances in non-invasive cardiac imaging have guided patient management and improved clinical outcomes. The technological developments of the past 20 years have also given rise to new imaging subspecialities and increased the demand for dedicated cardiac imagers who are cross-trained in multiple modalities. This state-of-the-art review summarizes the evolution of multimodality cardiac imaging in the 21st century and highlights opportunities for future innovation.


Figures

Figure 1.
Figure 1.
Three-dimensional transesophageal echocardiography performed during percutaneous mitral valve repair for severe mitral regurgitation secondary to mitral valve prolapse. (a) Mitral valve (surgeon’s view) with myxomatous mitral valve, prolapse of the anterior mitral valve leaflet and large regurgitant orifice. (b) Catheter deploying mitral valve clip between anterior and posterior mitral valve leaflets.
Figure 2.
Figure 2.
Regional strain analysis with speckle-tracking echocardiography in the apical 4-chamber, 2-chamber, and 3-chamber views demonstrates left ventricular dyssynchrony in a patient with LBBB. The characteristic LBBB contraction pattern on strain imaging includes early terminated shortening in the septal wall, early (pre-stretch) contraction in the lateral wall, and late lateral peak contraction. LBBB, left bundle branch block.
Figure 3.
Figure 3.
Coronary artery disease on CCTA reveals severity of luminal stenosis and composition of atherosclerotic plaque in the vessel wall: (a) non-calcified plaque; (b) mixed plaque with calcified and non-calcified components; (c) densely calcified plaque. CCTA, cardiac CT angiography.
Figure 4.
Figure 4.
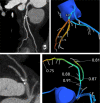
The degree of stenosis of the left anterior descending artery at the take-off of the first diagonal branch appears similar in the curved planar reformation CCTA images in these two patients. However, CT-FFR analysis demonstrates that the atherosclerotic plaque in the upper row is a flow-limiting stenosis with a CT-FFR value of less than 0.8 after the lesion, while the plaque in the bottom row does not result in a hemodynamically-significant obstruction of coronary blood flow on CT-FFR. CT-FFR, CT-fractionalflow reserve; CCTA, cardiac CT angiography.
Figure 5.
Figure 5.
CCTA demonstrating thrombus (arrow) on aortic valve leaflet after TAVR. CCTA, cardiac CTangiography; TAVR, transcatheter aortic valve replacement.
Figure 6.
Figure 6.
Acute myocarditis and follow-up evaluation by CMR imaging. (a) LGE imaging demonstrates mid-myocardial and epicardial enhancement involving the lateral and inferolateral left ventricular wall (arrows), in a pattern most characteristic of myocarditis. (b) T2 weighted imaging reveals hyperintensity in the lateral LV wall (arrows), indicating edema and suggesting active myocardial inflammation. Follow-up CMR imaging was performed 1.5 years later: (c) LGE imaging demonstrates myocardial scarring, as indicated by epicardial and mid-myocardial enhancement in the lateral and inferolateral walls (arrows). (d) T2 weighted imaging is normal, which indicates that the previously seen myocardial edema has resolved, suggesting the absence of active inflammation. CMR, cardiac magnetic resonance; LGE, late gadolinium enhancement; LV, left ventricular.
Figure 7.
Figure 7.
Cardiac amyloidosis diagnosed by CMR imaging. (a) LGE imaging demonstrates diffuse subendocardial enhancement, as well as patchy mid-myocardial enhancement (arrows). The diffuse subendocardial pattern of enhancement, in conjunction with the black blood pool, is characteristic for cardiac amyloidosis. (b) Non-contrast T1 mapping demonstrates heterogenous high T1 values in the myocardium. The measured average T1 time was 1407 ms (normal reference = 950 ± 21 ms). CMR, cardiac magneticresonance; LGE, late gadolinium enhancement.
Figure 8.
Figure 8.
Late gadolinium enhancement in a coronary artery distribution is the hallmark feature of myocardial infarction. (a) Subendocardial infarct in the LAD territory, spanning less than 25% myocardial wall thickness (arrows). (b) Myocardial infarction of the left circumflex artery. LGE CMR imaging in the short axis plane demonstrates myocardial wall thinning and transmural enhancement in the inferolateral wall of the left ventricle (arrow). CMR, cardiac magneticresonance; LAD, left anterior descending; LGE, late gadolinium enhancement.
Figure 9.
Figure 9.
Exercise stress (top) and rest (bottom) myocardial perfusion imaging study with SPECT. Reversible changes in the septum, anterior, inferior and apical segments compatible with ischemia. Transient ischemic dilatation is noted with TID index of 1.3. Cardiac catheterization demonstrated proximal 90% LAD stenosis and 90% mid-RCA stenosis. LAD, left anterior descending; RCA, right coronary artery; SPECT, single-photon emission computed tomography; TID, transient ischemic dilation.
Figure 10.
Figure 10.
PET assessment of myocardial viability in patient with triple vessel obstructive coronary artery disease and reduced ejection fraction. Top rows: N-13 ammonia at rest show diminished perfusion in the lateral wall. Lower rows: F-18 FDG reveal preserved metabolic FDG uptake in the corresponding lateral segments, as well as the remaining myocardium, which signifies the presence of viable myocardium. FDG, fludeoxyglucose; PET, positron emission tomography.
Figure 11.
Figure 11.
Tc-99m Pyrophosphate planar and SPECT imaging for cardiac amyloid. (a) Increased activity is seen over the heart on planar imaging. (b) Quantitative analysis of H/CL ratio is 1.95 (Negative <1.5), strongly suggestive of TTR amyloidosis. C. SPECT imaging confirms intense diffuse uptake in the left ventricular myocardium and to a lesser degree in the visible aspect of the right ventricle. Fine needle aspiration biopsy of the abdominal fat was positive for extracellular amyloid deposition. H/CL, heart-to-contralateral lung; SPECT, single photon emission tomography.
Figure 12.
Figure 12.
Cardiac PET: N-13 ammonia rest images (top rows) demonstrate a perfusion defect in the basal and mid inferoseptum, extending from the epicardium to the subendocardium. F-18 FDG images (lower rows) demonstrate focal hypermetabolism in the areas of perfusion defect, consistent with active inflammation in this area. Hybrid CT and F-18 FDG images of the chest show hyperemtabolic hilar and mediastinal lymphadenopathy, compatible with active chest sarcoidosis. The integration of the chest and cardiac findings are consistent with sarcoidosis. FDG, fluorodeoxyglucose; PET,positron emission tomography.

References

    1. Hung J, Lang R, Flachskampf F, Shernan SK, McCulloch ML, Adams DB, et al. . 3D echocardiography: a review of the current status and future directions. J Am Soc Echocardiogr 2007; 20: 213–33. doi: 10.1016/j.echo.2007.01.010 - DOI - PubMed
    1. Dorosz JL, Lezotte DC, Weitzenkamp DA, Allen LA, Salcedo EE. Performance of 3-dimensional echocardiography in measuring left ventricular volumes and ejection fraction: a systematic review and meta-analysis. J Am Coll Cardiol 2012; 59: 1799–808. doi: 10.1016/j.jacc.2012.01.037 - DOI - PMC - PubMed
    1. Thavendiranathan P, Liu S, Verhaert D, Calleja A, Nitinunu A, Van Houten T, et al. . Feasibility, accuracy, and reproducibility of real-time full-volume 3D transthoracic echocardiography to measure LV volumes and systolic function: a fully automated endocardial contouring algorithm in sinus rhythm and atrial fibrillation. JACC Cardiovasc Imaging 2012; 5: 239–51. doi: 10.1016/j.jcmg.2011.12.012 - DOI - PubMed
    1. Stanton T, Jenkins C, Haluska BA, Marwick TH. Association of outcome with left ventricular parameters measured by two-dimensional and three-dimensional echocardiography in patients at high cardiovascular risk. J Am Soc Echocardiogr 2014; 27: 65–73. doi: 10.1016/j.echo.2013.09.012 - DOI - PubMed
    1. Hahn RT, Nicoara A, Kapadia S, Svensson L, Martin R. Echocardiographic imaging for transcatheter aortic valve replacement. J Am Soc Echocardiogr 2018; 31: 405–33. doi: 10.1016/j.echo.2017.10.022 - DOI - PubMed

MeSH terms