. 2020 Nov 24;33(8):108427.
doi: 10.1016/j.celrep.2020.108427.

Hetero-oligomerization of Rho and Ras GTPases Connects GPCR Activation to mTORC2-AKT Signaling

Affiliations

Hetero-oligomerization of Rho and Ras GTPases Connects GPCR Activation to mTORC2-AKT Signaling

Hiroshi Senoo et al. Cell Rep. .

Abstract

The activation of G-protein-coupled receptors (GPCRs) leads to the activation of mTORC2 in cell migration and metabolism. However, the mechanism that links GPCRs to mTORC2 remains unknown. Here, using Dictyostelium cells, we show that GPCR-mediated chemotactic stimulation induces hetero-oligomerization of phosphorylated GDP-bound Rho GTPase and GTP-bound Ras GTPase in directed cell migration. The Rho-Ras hetero-oligomers directly and specifically stimulate mTORC2 activity toward AKT in cells and after biochemical reconstitution using purified proteins in vitro. The Rho-Ras hetero-oligomers do not activate ERK/MAPK, another kinase that functions downstream of GPCRs and Ras. Human KRas4B functionally replace Dictyostelium Ras in mTORC2 activation. In contrast to GDP-Rho, GTP-Rho antagonizes mTORC2-AKT signaling by inhibiting the oligomerization of GDP-Rho with GTP-Ras. These data reveal that GPCR-stimulated hetero-oligomerization of Rho and Ras provides a critical regulatory step that controls mTORC2-AKT signaling.

Keywords: AKT; Dictyostelium; G protein-coupled receptors; KRas; Rho; cell migration; mTORC2; small GTPases.


Conflict of interest statement

Declaration Of Interests The authors declare no competing interests.

Figures
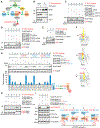
Figure 1.
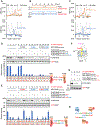
Figure 1.. Identification of the Interface for RacE-RasC Binding
(A) Model for GPCR-mediated mTORC2-AKT signaling. In response to GPCR activation by chemoattractant, GDP-bound RacE becomes phosphorylated by GSK-3 and associates with GTP-bound RasC and mTORC2 to promote AKT phosphorylation. (B) RacE was immunoprecipitated with anti-RacE antibodies and protein A agarose beads from total lysates of Dictyostelium cells. The lysate (input) and immunoprecipitated proteins (IP) were analyzed by western blotting using antibodies to RacE, RasC, and actin. +Stim indicates that cells were stimulated by the chemoattractant (1 μM cAMP) for 30 s before cell lysis. (C) The indicated GFP-tagged RacE proteins were purified from Dictyostelium cells. GTP-bound FLAG-RasCQ62L was purified without stimulation. WT GFP-RacE, GDP-bound GFP-RacET25N, or GTP-bound GFP-RacEG20V were incubated with FLAG-RasCQ62L and pulled down using GFP-Trap. The pellet fraction was analyzed by western blotting using antibodies to GFP and FLAG. (D) Purified phosphodefective GFP-RacET25N,S192A or phosphomimetic GFP-RacE T25N,S192D was mixed with purified GTP-bound FLAG-RasCQ62L and pulled down by GFP-Trap. The pellet fractions were analyzed by western blotting. (E) GFP-RacET25N that was purified after stimulation was incubated with WT FLAG-RasC, GDP-bound FLAG-RasCS18N, or GTP-bound FLAG-RasCQ62L and pulled down with GFP-Trap. The pellet fraction was analyzed by western blotting. (F) Modeled three-dimensional structure of human KRas, Dictyostelium RasC, and Dictyostelium RacE. In the KRas molecule, D154 and R161, which are critical for KRas dimerization, are shown (Ambrogio et al., 2018; Güldenhaupt et al., 2012). These residues are located in α helix 5 (yellow). Corresponding α helix and residues are indicated in the modeled structures of RasC and RacE (I-TASSER). (G) The indicated GFP-RacE proteins were incubated with different FLAG-RasC and pulled down using GFP-Trap. The pellet fractions were analyzed by western blotting with antibodies to GFP and FLAG. The band intensity of FLAG-RasC in the pellet fractions was quantified. FLAG-RasCQ62L that was co-precipitated with GFP-RacET25N,S192D (lane 1) was set to 100%. Values are average ±SD (n = 3). (H) The indicated FLAG- or GFP-tagged proteins were incubated and pulled down using GFP-Trap. (I) mTORC2 was purified using FLAG-Tor from Dictyostelium cells and incubated with purified FLAG-RasC and FLAG-RacE in the presence of ATP and human unactive AKT. AKT phosphorylation was analyzed by western blotting using anti-phospho-AKT (serine 473) antibodies. A summary of the data is shown. All of the experiments were repeated at least three times. See also Figures S1 and S2.
Figure 2.
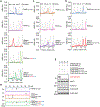
Figure 2.. GDP-RacE Forms Homo-oligomers
(A) SEC elution profiles of FLAG-RacE. FLAG-RacE was purified from Dictyostelium cells. +Stim indicates that cells were stimulated by the chemoattractant (1 μM cAMP) for 30 s before protein purification. The SEC elution profile of standard proteins is shown by a gray line with the molecular weight of peaks. (B) Western blot analysis of SEC fractions using antibodies to FLAG and phospho-RacE (Ser192). (C) SEC elution profiles of phophodefective GDP-bound FLAG-RacET25N,S192A and phosphomimetic GDP-bound FLAG-RacET25N,S192D. (D and E) The indicated GFP- and FLAG-RacE proteins were mixed and pulled down by GFP-Trap. The pellet fractions were analyzed by western blotting with antibodies to FLAG and GFP. The band intensity of FLAG-RacE in the pellet fraction was quantified. The intensity of FLAG-RacET25N,S192D in lane 1 was set 100%. Values are average ±SD (n = 3). (F) A modeled three-dimensional structure of Dictyostelium RacE. (G) The indicated FLAG- or GFP-tagged proteins were incubated and pulled down using GFP-Trap. (H) Summary of the data for RasC-RacE and RacE-RacE interactions. All of the experiments were repeated at least three times. See also Figure S2.
Figure 3.
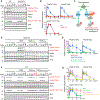
Figure 3.. Phospho-GDP-RacE and GTP-RasC Form Hetero-oligomers
(A) SEC elution profiles of FLAG-tagged RacE and RasC protein. The elution profile of standard proteins is superimposed with the molecular weight of peaks (gray line). (B) Western blot analysis of SEC fractions using anti-FLAG antibodies. (C and D) SEC elution profiles of the indicated proteins. (E) Purified mTORC2 using FLAG-Tor was incubated with the indicated FLAG-RasC and FLAG-RacE proteins in the presence of ATP and human unactive AKT. AKT phosphorylation was analyzed by western blotting using anti-phospho-AKT (serine 473) antibodies. All of the experiments were repeated at least three times. See also Figures S2 and S3.
Figure 4.
Figure 4.. RacE-RasC Interaction Is Required for Chemoattractant-Induced, mTORC2-Mediated AKT Phosphorylation in Cells
The indicated Dictyostelium cell lines were stimulated with the chemoattractant cAMP (1 μM). Phosphorylation of two AKT homologs (PkbR1 and PkbA) and an Erk/MAPK homolog (Erk2) were analyzed by western blotting and quantified. (A and B) WT cells and RacE-KO cells were analyzed. (C) Summary of data for two separate pathways downstream of RasC. (D and E) RacE-KO cells expressing the indicated GFP-RacE proteins were examined. (F and G) WT cells expressing the indicated FLAG-RasC proteins were analyzed. The band intensity of phosphorylated PKBR1, PKBA, and Erk2 were quantified in (B), (E), and (G): WT cells at 30 s (B and G) and RacE-KO cells expressing WT RacE at 30 s (E) were set at 100%. Values are average ±SD (n = 3). See also Figures S4 and S5.
Figure 5.
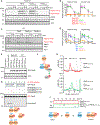
Figure 5.. GTP-RacE Binds Phospho-GDP-RacE and Inhibits Its Association with GTP-RasC
(A-D) RacE-KO cells in (A and B) and WT cells in (C and D) were transfected with the indicated GFP-RacE constructs and stimulated with the chemoattractant cAMP (1 μM). Phosphorylation of PkbR1 and PkbA was analyzed by western blotting. Their band intensity was quantified in (B) and (D): RacE-KO cells with GFP-RacE and at 30 s in (B) and untransfected WT cells at 30 s in (D) and were set at 100%. Values are average ±SD (n = 3). (E) Western blotting shows similar expression levels of GFP-RacE proteins. (F) Model for the inhibitory role of GTP-RacE in mTORC2-AKT signaling. (G) The indicated GFP-RacE proteins were incubated with different FLAG-RacE proteins and pulled down using GFP-Trap. A summary of the data is shown. (H and I) Phophosphomimetic GDP-bound FLAG-RacET25N,S192D and GTP-bound FLAG-RasCQ62L were analyzed by SEC in the presence or absence of phosphodefective GTP-bound FLAG-RacEG20V,S192A. Western blot analysis of SEC fractions using anti-FLAG antibodies is shown in (I). All of the experiments were repeated at least three times.
Figure 6.
Figure 6.. GTP-RacE Inhibits Chemoattractant-Stimulated AKT Phosphorylation in Cells
(A and B) WT cells expressing the indicated GFP-RacE proteins were stimulated with the chemoattractant cAMP (1 μM). Phosphorylation of PkbR1 and PkbA was analyzed by western blotting. Their band intensity was quantified in (B): untransfected WT cells at 30 s were set at 100%. Values are the average ±SD (n = 3). (C) Residues that mediate interactions between phospho-GDP-bound RacE and GTP-RacE are shown. (D) Expression levels of GFP-RacE proteins were analyzed by western blotting with antibodies to RacE and actin. (E) Purified mTORC2 using FLAG-Tor was incubated with GTP-bound FLAG-RasCQ62L along with the indicated FLAG-RacE proteins in the presence of ATP and human unactive AKT. AKT phosphorylation was analyzed by western blotting using anti-phospho-AKT (serine 473) antibodies. (F) Dictyostelium cells expressing the indicated GFP fusion proteins were placed in a chemoattractant gradient (Senoo et al., 2019) and observed by spinning disc confocal microscopy. Scale bar, 10 μm. (G) Quantification of the fluorescence intensity of GFP at the front region relative to the back region of migrating cells using ImageJ. Bars are average ±SD (n = 15 cells). Statistical analysis was performed using one-way ANOVA with post hoc Tukey: **p < 0.01. (H) Model for mTORC2-AKT signaling regulated by RacE and RasC in migrating cells.
Figure 7.
Figure 7.. Human KRas4B Functionally Replaces Dictyostelium RasC
(A-C) WT cells expressing a GTP-bound form of FLAG-tagged human Ras proteins were stimulated with the chemoattractant cAMP (1 μM). Phosphorylation of PkbR1, PkbA, and Erk2 was analyzed by western blotting. Their band intensities were quantified in (B). WT cells at 30 s were set at 100%. Values are average ±SD (n = 3). Expression levels of human Ras proteins were analyzed by western blotting with antibodies to FLAG and actin in (C). (D) Phosphomimetic GDP-bound GFP-RacET25N,S192D was incubated with GTP-bound FLAG-tagged human Ras proteins and pulled down using GFP-Trap. (E) FLAG-RacET25N,S192D and FLAG-KRas4BG12V were mixed and analyzed by SEC. As controls, these proteins were individually analyzed by SEC. SEC elution profile of standard proteins is shown by a gray line with the molecular weight of peaks. Western blot analysis of SEC fractions using anti-FLAG antibodies is shown. (F) Purified mTORC2 using FLAG-Tor was incubated with GTP-bound FLAG-RasCQ62L or FLAG-KRas4BG12V along with the indicated FLAG-RacE proteins in the presence of ATP and human unactive AKT. AKT phosphorylation was analyzed by western blotting using anti-phospho-AKT (serine 473) antibodies. All of the experiments were repeated at least three times. See also Figures S1 and S6.

Similar articles

Cited by

References

    1. Ambrogio C, Kohler J, Zhou ZW, Wang H, Paranal R, Li J, Capelletti M, Caffarra C, Li S, Lv Q, et al. (2018). KRAS Dimerization Impacts MEK Inhibitor Sensitivity and Oncogenic Activity of Mutant KRAS. Cell 172, 857–868. - PubMed
    1. Artemenko Y, Lampert TJ, and Devreotes PN (2014). Moving towards a paradigm: common mechanisms of chemotactic signaling in Dictyostelium and mammalian leukocytes. Cell. Mol. Life Sci 71, 3711–3747. - PMC - PubMed
    1. Cai H, Das S, Kamimura Y, Long Y, Parent CA, and Devreotes PN (2010). Ras-mediated activation of the TORC2-PKB pathway is critical for chemotaxis. J. Cell Biol 190, 233–245. - PMC - PubMed
    1. Caunt CJ, Sale MJ, Smith PD, and Cook SJ (2015). MEK1 and MEK2 inhibitors and cancer therapy: the long and winding road. Nat. Rev. Cancer 15, 577–592. - PubMed
    1. Devreotes P, and Horwitz AR (2015). Signaling networks that regulate cell migration. Cold Spring Harb. Perspect. Biol 7, a005959. - PMC - PubMed

Publication types

MeSH terms

Substances

LinkOut - more resources