. 2020 Nov 24;33(8):108409.
doi: 10.1016/j.celrep.2020.108409.

Shigella flexneri Disruption of Cellular Tension Promotes Intercellular Spread

Affiliations

Shigella flexneri Disruption of Cellular Tension Promotes Intercellular Spread

Jeffrey K Duncan-Lowey et al. Cell Rep. .

Abstract

During infection, some bacterial pathogens invade the eukaryotic cytosol and spread between cells of an epithelial monolayer. Intercellular spread occurs when these pathogens push against the plasma membrane, forming protrusions that are engulfed by adjacent cells. Here, we show that IpaC, a Shigella flexneri type 3 secretion system protein, binds the host cell-adhesion protein β-catenin and facilitates efficient protrusion formation. S. flexneri producing a point mutant of IpaC that cannot interact with β-catenin is defective in protrusion formation and spread. Spread is restored by chemical reduction of intercellular tension or genetic depletion of β-catenin, and the magnitude of the protrusion defect correlates with membrane tension, indicating that IpaC reduces membrane tension, which facilitates protrusion formation. IpaC stabilizes adherens junctions and does not alter β-catenin localization at the membrane. Thus, Shigella, like other bacterial pathogens, reduces intercellular tension to efficiently spread between cells.

Keywords: IpaC; Shigella flexneri; cell-to-cell spread; intercellular spread; intracellular pathogens; plasma membrane; type 3 secretion system; β-catenin.


Conflict of interest statement

Declaration of Interests The authors declare no competing interests.

Figures
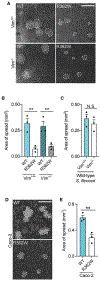
Figure 1.
Figure 1.. IpaC C-Terminal Tail Is Required for Efficient Intercellular Spread of S. flexneri
(A and B) Plaques formed in Vim+/+ and Vim−/− MEF monolayers by S. flexneri ΔipaC-producing WT IpaC (WT) or IpaC R362W (R362W). Representative images; 30–60 plaques measured per condition per experiment. (B) Plaque size from experiments represented in (A). (C) Quantification of the size of plaques formed by WT S. flexneri in Vim+/+ and Vim−/− MEFs. A total of 62–103 plaques were measured per condition per experiment. (D) Plaques formed in Caco-2 monolayers by S. flexneri ΔipaC-producing WT IpaC or IpaC R362W. Representative images; 30–56 plaques measured per condition per experiment. (E) Plaque size from experiments represented in (D). For bar graphs, dots represent independent experiments (B, C, and E); data are mean ± SEM. Scale bars, 500 μm. N.S., not significant; **p < 0.01; one-way ANOVA with Tukey post hoc test (B) or Student’s t test (C and E). See also Figures S1 and S2.
Figure 2.
Figure 2.. IpaC Is Required for Protrusion Formation by S. flexneri
(A) Plasma membrane protrusions formed in confluent HeLa cells by S. flexneri ΔipaC-producing WT IpaC or IpaC R362W. Green, S. flexneri; red, t-farnesyl-red fluorescent protein (RFP), which labels plasma membranes; blue, DNA. Arrowheads, bacteria in protrusions. Representative images. Five random fields were analyzed per condition per experiment. (B) Percentage of intracellular bacteria located within protrusions from (A), mean ± SEM. (C) Live-cell imaging snapshots of actin-based motility of designated S. flexneri strains during infection of HeLa cells producing LifeAct GFP, which labels actin. Yellow, S. flexneri; purple, actin. Arrowheads, motile bacteria with unipolar polymerized actin. Representative images. (D) Speeds of bacteria with polymerized actin at one pole, mean ± SEM. Ten bacteria imaged per condition per experiment. Data are from two (C and D) or three (A and B) independent experiments. Dots represent independent experiments (B) or individual bacteria(D). Scale bars, 10 μM. N.S., not significant; **p < 0.01; Student’s t test. See also Figure S3.
Figure 3.
Figure 3.. IpaC C-Terminal Tail Arginine Is Required for S. flexneri-Mediated Reduction of Host Membrane Tension.
(A and B) Infection of polarized Caco-2 cells with S. flexneri ΔipaC-producing WT IpaC or IpaC R362W. (A) Cell-cell junctions of Caco-2 cells delineated by ZO-1 staining. White, ZO-1; green, S. flexneri; orange dots, membrane junctions; orange dashed lines, linear distances between junctions. Representative images. A total of 14–37 junctions were measured per condition per experiment. (B) Membrane length from (A), mean ± SEM. (C and D) Infection of HeLa cells by S. flexneri ΔipaC-producing WT IpaC or IpaC R362W. (C) Plasma membrane protrusions formed in HeLa cells by S. flexneri ΔipaC-producing WT IpaC or IpaC R362W after treatment with blebbistatin or carrier. Arrowheads, bacteria in protrusions; red, t-farnesyl-RFP; green, S. flexneri; blue, DNA. Representative images. A total of 51–337 bacteria were analyzed per condition per experiment. (D) Percentage of bacteria in protrusions from (C), mean ± SEM. (E and F) Infection of Caco-2 cells with S. flexneri ΔipaC-producing WT IpaC or IpaC R362W. Quantification of the percentage of bacteria within protrusions in cells at the edge of a monolayer that are sub-confluent (E) or in cells that are confluent. (F). Five (E) or ten (F) fields were analyzed per condition per experiment. Dots represent independent experiments (B and D–F). Bars are mean ± SEM. Scale bars, 10 μM. *p < 0.05; **p < 0.01. One-way ANOVA with Tukey post hoc test (B and D) or Student’s t test (E and F).
Figure 4.
Figure 4.. IpaC Interactions with β-Catenin Are Associated with S. flexneri Intercellular Spread
(A) Schematic of yeast protein-protein interaction platform. Interaction of the mCherry-tagged prey protein (red) with the bait protein fused to the inclusion body forming protein μNS (gray) results in puncta of red fluorescence. In contrast, the lack of an interaction between prey and bait proteins results in generally diffuse mCherry fluorescence throughout the cytosol of the yeast cells. (B) Protein interaction assay. Arrowheads, fluorescent puncta. Representative images. A total of 88–186 yeast were analyzed per condition per experiment. Scale bar, 10 μM. (C) Percentage of yeast displaying puncta, which indicates an interaction; mean ± SEM. (D and E) Infection of HeLa cells with or without β-catenin knockdown by S. flexneri ΔipaC-producing WT IpaC or IpaC R362W. (D) Bacterial plaques formed in monolayers stably expressing β-catenin-targeting (#1 and #2) or control shRNA. Images collected at 18 h of infection. Green, S. flexneri; blue, DNA. Scale bar, 100 μm. Representative images. Five to ten fields were examined per condition per experiment. (E) Quantification of plaque size (area of spread) from (D), mean ± SEM. Dots represent data from three or more independent experiments (C and E). *p < 0.05; **p < 0.01; ***p < 0.001; one-way ANOVA with Sidak post hoc test. See also Figure S4.
Figure 5.
Figure 5.. IpaC Stabilizes the β-Catenin-Cadherin Interaction
(A–C) Infection of Caco-2 cells with S. flexneri-producing WT IpaC or IpaC R362W. (A) Representative images. Five to ten images were analyzed per condition per experiment. Cyan, S. flexneri; green, membrane-bound YFP; red, β-catenin; blue, DNA. Scale bar 20 βM. (B and C) Quantification of the percentage of protrusions that colocalized with β-catenin in either sub-confluent (B) or confluent (C) cells. Student’s t test. Data are mean ± SEM. (D) Subcellular localization of β-catenin in HeLa cells infected with S. flexneri-producing WT IpaC or IpaC R362W. (E–G) Yeast-based protein interaction assay comparing the efficiency of the interaction between β-catenin and E-cadherin in the presence of either WT IpaC or IpaC R362W. (E) Schematic showing prey is E-cadherin GFP, modifier is IpaC, and bait is β-catenin-μNS. (F) Representative images. Dotted lines are outlines of yeast. Scale bar, 10 μm. A total of 29–175 yeast were analyzed per condition per experiment. (G) Percentage of yeast displaying puncta, which indicates an interaction, from (F). Data are mean ± SEM. N.S., not significant. *p < 0.05; one-way ANOVA with Tukey post hoc test. See also Figure S5.

References

    1. Allaoui A, Mounier J, Prévost MC, Sansonetti PJ, and Parsot C (1992). icsB: a Shigella flexneri virulence gene necessary for the lysis of protrusions during intercellular spread. Mol. Microbiol 6, 1605–1616. - PubMed
    1. Allaoui A, Sansonetti PJ, Ménard R, Barzu S, Mounier J, Phalipon A, and Parsot C (1995). MxiG, a membrane protein required for secretion of Shigella spp. Ipa invasins: involvement in entry into epithelial cells and in intercellular dissemination. Mol. Microbiol 17, 461–470. - PubMed
    1. Baxt LA, and Goldberg MB (2014). Host and bacterial proteins that repress recruitment of LC3 to Shigella early during infection. PLoS One 9, e94653. - PMC - PubMed
    1. Bernardini ML, Mounier J, d’Hauteville H, Coquis-Rondon M, and Sansonetti PJ (1989). Identification of icsA, a plasmid locus of Shigella flexneri that governs bacterial intra- and intercellular spread through interaction with F-actin. Proc. Natl. Acad. Sci. USA 86, 3867–3871. - PMC - PubMed
    1. Campbell-Valois FX, Schnupf P, Nigro G, Sachse M, Sansonetti PJ, and Parsot C (2014). A fluorescent reporter reveals on/off regulation of the Shigella type III secretion apparatus during entry and cell-to-cell spread. Cell Host Microbe 15, 177–189. - PubMed

Publication types

MeSH terms

Substances