. 2020 Nov 24;33(8):108433.
doi: 10.1016/j.celrep.2020.108433.

An IL-27-Driven Transcriptional Network Identifies Regulators of IL-10 Expression across T Helper Cell Subsets

Affiliations

An IL-27-Driven Transcriptional Network Identifies Regulators of IL-10 Expression across T Helper Cell Subsets

Huiyuan Zhang et al. Cell Rep. .

Erratum in

Abstract

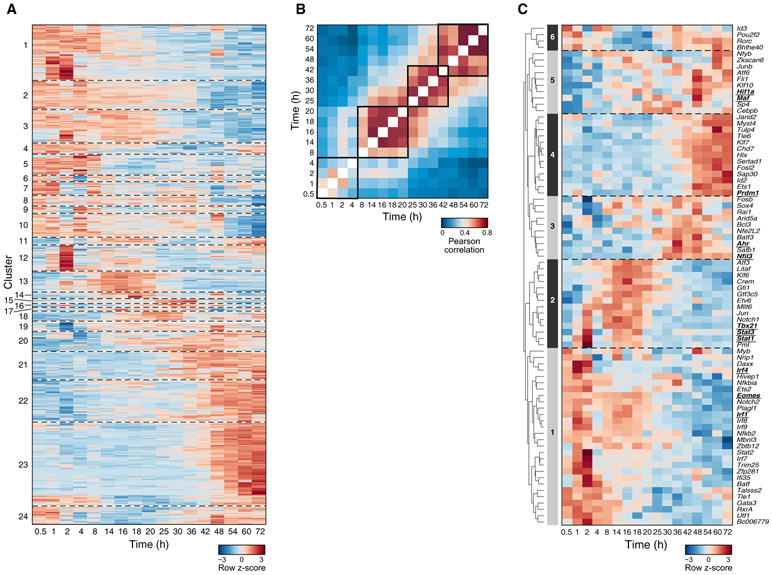
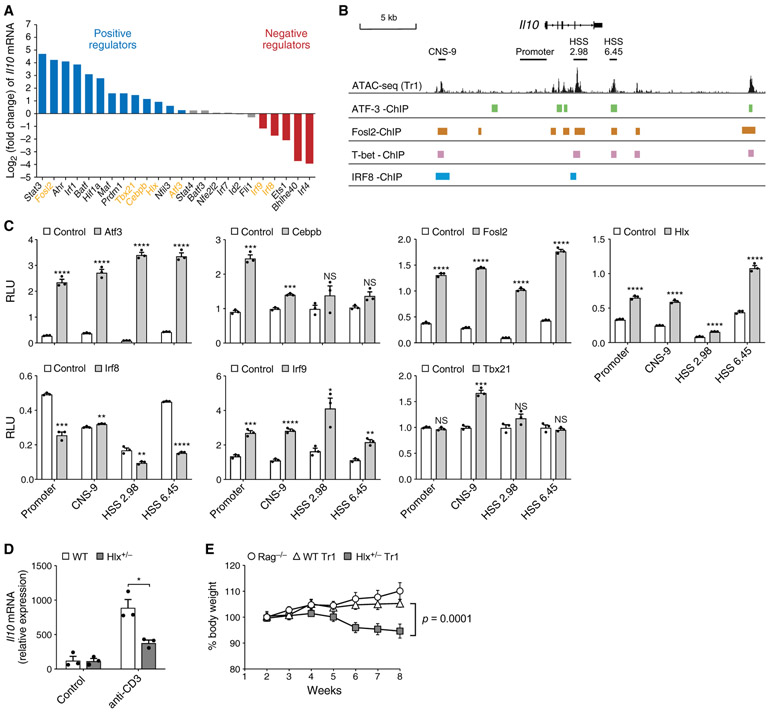
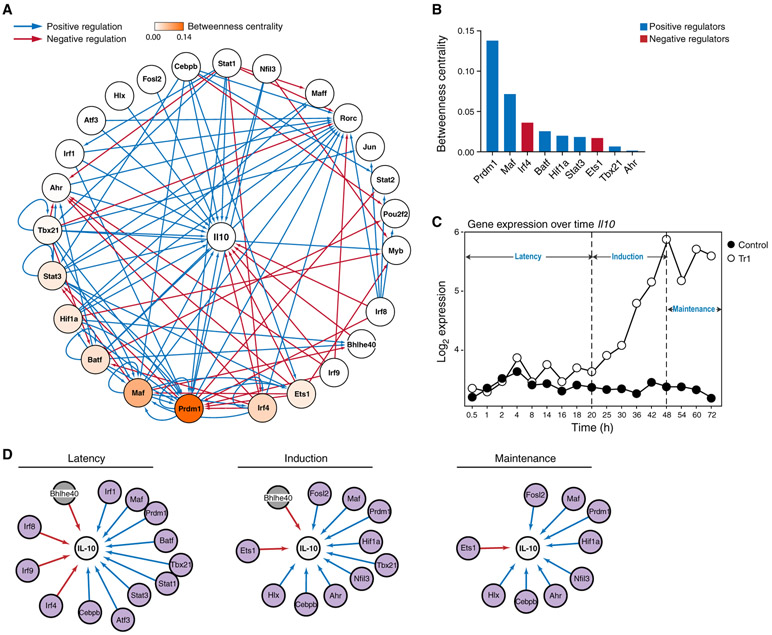
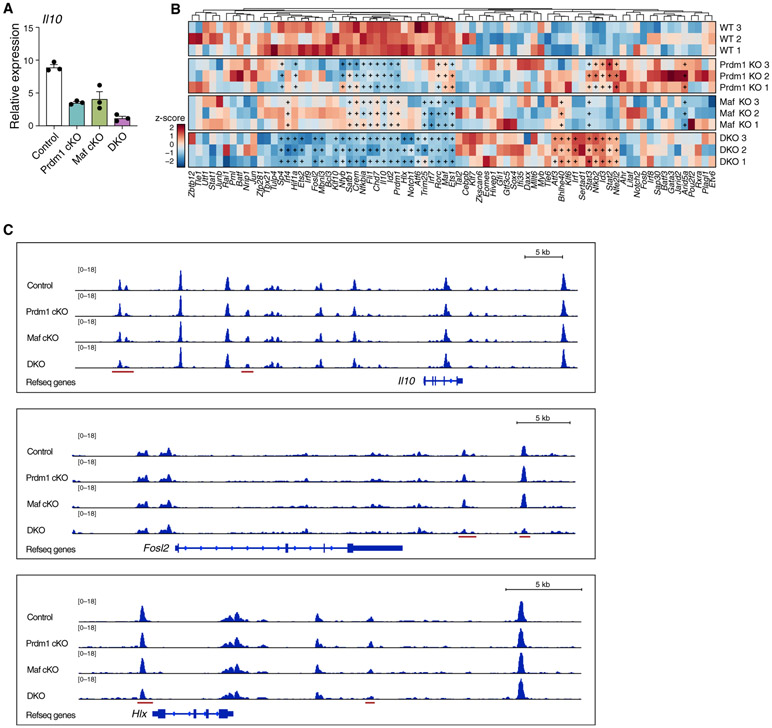
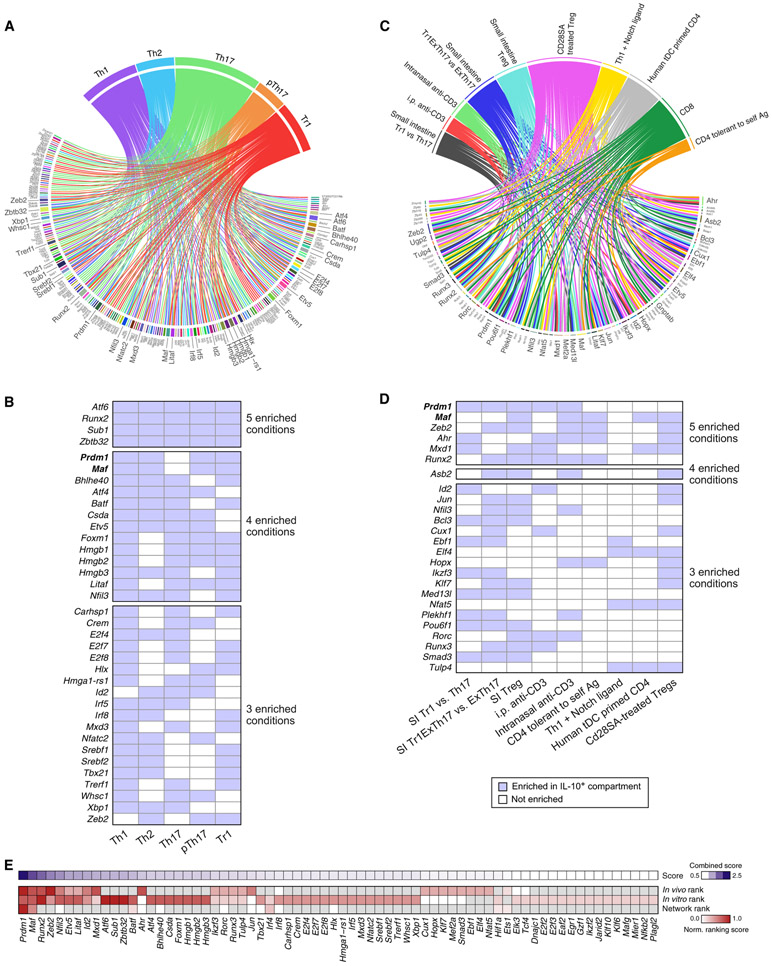
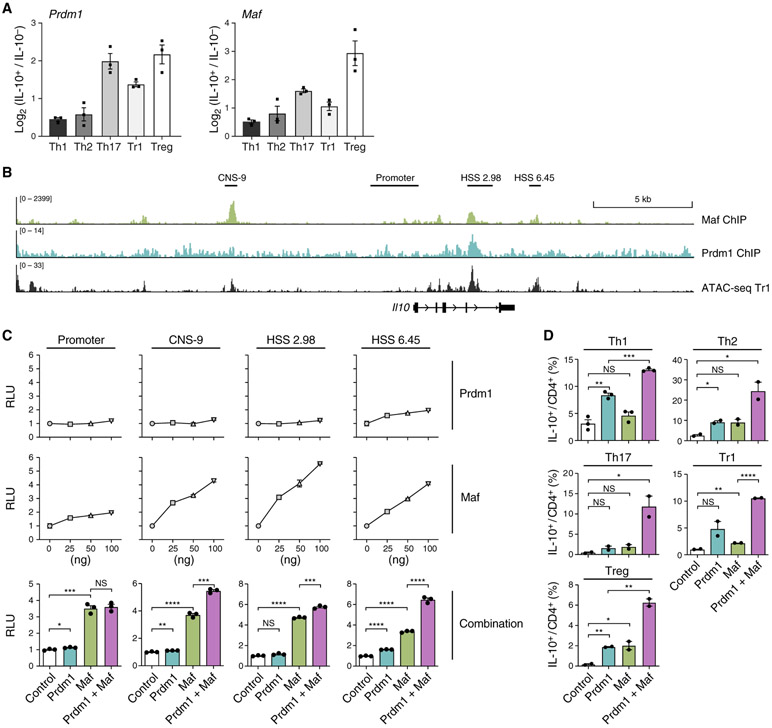
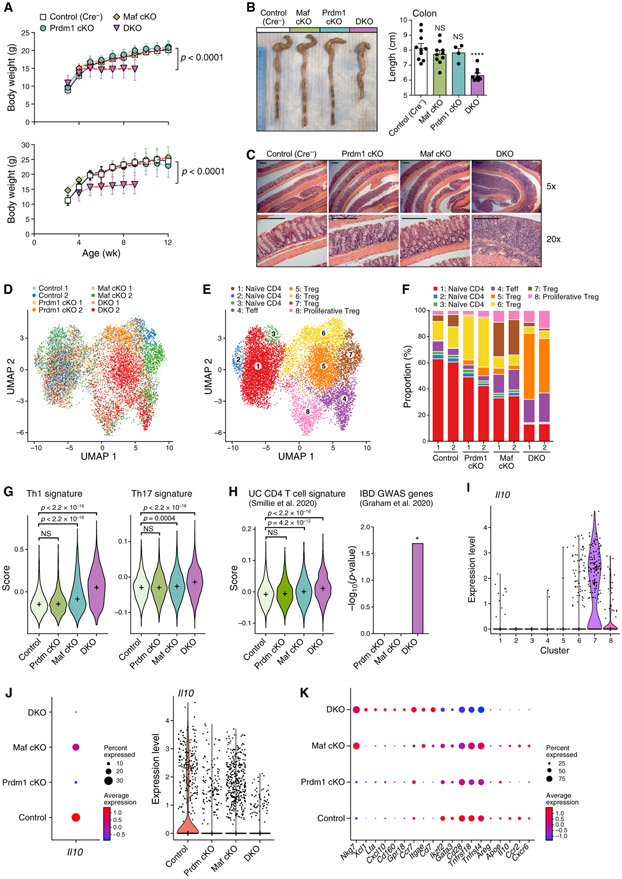
Interleukin-27 (IL-27) is an immunoregulatory cytokine that suppresses inflammation through multiple mechanisms, including induction of IL-10, but the transcriptional network mediating its diverse functions remains unclear. Combining temporal RNA profiling with computational algorithms, we predict 79 transcription factors induced by IL-27 in T cells. We validate 11 known and discover 5 positive (Cebpb, Fosl2, Tbx21, Hlx, and Atf3) and 2 negative (Irf9 and Irf8) Il10 regulators, generating an experimentally refined regulatory network for Il10. We report two central regulators, Prdm1 and Maf, that cooperatively drive the expression of signature genes induced by IL-27 in type 1 regulatory T cells, mediate IL-10 expression in all T helper cells, and determine the regulatory phenotype of colonic Foxp3+ regulatory T cells. Prdm1/Maf double-knockout mice develop spontaneous colitis, phenocopying ll10-deficient mice. Our work provides insights into IL-27-driven transcriptional networks and identifies two shared Il10 regulators that orchestrate immunoregulatory programs across T helper cell subsets.

Keywords: IL-10; IL-27; Maf; Prdm1; T helper cells; Tr1; Treg; colitis; transcriptional network.


Conflict of interest statement

Declaration of Interests A.R. is a founder and equity holder of Celsius Therapeutics, an equity holder in Immunitas Therapeutics, and, until August 31, 2020, an SAB member of Syros Pharmaceuticals, Neogene Therapeutics, Asimov, and Thermo Fisher Scientific. From August 1, 2020, A.R. is an employee of Genentech, a member of the Roche Group. V.K.K. has an ownership interest in Tizona Therapeutics, Celsius Therapeutics, and Bicara Therapeutics. V.K.K. has financial interests in Biocon Biologic, BioLegend, Elpiscience Biopharmaceutical Ltd., Equilium Inc., and Syngene Intl. V.K.K. is a member of SABs for Elpiscience Biopharmaceutical Ltd., GSK, Kintai Therapeutics, Repertoir Immune Medicines, Rubius Therapeutics, and Tizona Therapeutics. A.C.A. is a member of SAB for Tizona Therapeutics, Compass Therapeutics, Zumutor Biologics, ImmuneOncia, and Astellas Global Pharma Development Inc. A.C.A.’s and V.K.K.’s interests were reviewed and managed by the Brigham and Women’s Hospital and Partners Healthcare and A.R.’s interests by the Broad Institute and HHMI in accordance with their conflict of interest policies.

Figures

Figure 1.
Figure 1.. Building a Predicative Model of the IL-27-Driven Transcriptional Program in CD4 T Cells by High-Resolution Temporal Transcriptional Profiling
Gene expression profiles during IL-27-driven in-vitro Tr1 differentiation were measured by microarray at 17 time points with the Th0 condition as a control. (A) Relative expression (log2(Tr1/Th0)) of 790 differentially expressed genes (rows). (B) Pearson correlation matrix of the transcriptome at every pair of time points. (C) Relative expression (log2(Tr1/Th0)) of 79 TFs predicted to regulate gene clusters. Underlined are TFs known to regulate Tr1 differentiation.
Figure 2.
Figure 2.. Experimental Validation of IL-27 Predicative Network Identifies TFs that Regulate Il10 In Vitro and In Vivo
(A) Log2 fold change of Il10 mRNA levels in WT versus KO Tr1 cells differentiated in vitro with IL-27 for 72 h, quantified by qPCR. Blue, positive regulator; red, negative regulator; gray, not statistically significant. Data are displayed as mean of 2–3 replicates. (B) Statistically significant ChIP-seq binding sites of ATF-3 ATF-3, Fosl2, T-bet, and IRF8 in the Il10 locus. (C) Luciferase activity in 293T cells transfected with luciferase reporters for the indicated cis-regulatory elements of Il10 and plasmids encoding the depicted TFs. Firefly luciferase activity is normalized to constitutive Renilla luciferase activity. (D) WT and Hlx+/− mice were injected intraperitoneally (i.p.) with anti-CD3. Il10 mRNA in CD4+ T cells MACS purified from mesenteric lymph nodes was measured by qPCR. (E) 5 x 10⁵ in vitro differentiated WT (diamonds) and Hlx+/−(squares) Tr1 cells were transferred i.p. into Rag1−/− recipients. Rag1−/− (circles) did not receive any cells. Changes in body weight were monitored weekly. n = 5.
Figure 3.
Figure 3.. A Comprehensive Transcriptional Network Focused on Regulation of IL-10 by IL-27
(A) General network of Il10 regulation by TFs in Tr1 cells, visualized using Cytoscape. Edges indicate causal regulatory targets identified using genetic perturbation by RNA-seq or qPCR. Blue and red edges indicate positive and negative regulations, respectively. Nodes are colored by betweenness centrality score. (B) Betweenness centrality scores of the regulators in (A). Blue, positive regulator; red, negative regulator. (C) Temporal expression of Il10 in Tr1 versus Th0 cells measured by microarray. (D) Temporal regulation of Il10 in Tr1 cells, divided into 3 main phases: latency (0–20 h), induction (25–48 h), and maintenance (54–72 h). Purple nodes, increased by IL-27; gray nodes, decreased by IL-27.
Figure 4.
Figure 4.. Prdm1 and Maf Have Complementary but Indispensable Roles in Regulating Tr1 Identity at the Transcriptional and Chromatin Level
(A) Naive CD4 T cells from the indicated mice were differentiated in vitro into Tr1 cells with IL-27. Il10 expression was measured by qPCR on day 3. (B and C) Control, Prdm1 cKO, Maf cKO, and Prdm1/Maf DKO Tr1 cells generated as described in (A) were analyzed by RNA-seq (B) and ATAC-seq (C). (B) Heatmap showing expression of 79 predicted regulators in the Tr1 network. “+” indicates statistically significant differential expression. (C) Chromatin accessibility in the Il10, Fosl2, and Hlx loci in Tr1 cells of the indicated genotype. Red bars represent regions with differential chromatin accessibility in DKO cells.
Figure 5.
Figure 5.. TFs Associated with IL-10 Production in Different T Helper Cells
(A and C) TFs enriched in the IL-10+ compartments compared with their IL-10 compartments in (A) in-vitro-generated T helper cell subsets, (C) 10 in vivo/ex vivo conditions where a direct comparison between the transcriptome of IL-10+ and IL-10 cells was made in public data (Table S1). TFs that are enriched under at least 3 conditions were magnified. (B and D) A different display of same data in (A) and (C), respectively, showing TFs that are enriched under at least 3 conditions and the conditions where their expression is enriched in the IL-10+ compartment. SI, small intestine. (E) A ranking scheme (STAR Methods) for all potential regulators of IL-10, taking into account network centrality (Figure 3B), enrichment in in vitro conditions (Figure 5A), and enrichment in public datasets (Figure 5C).
Figure 6.
Figure 6.. Prdm1 and Maf Synergistically Regulate IL-10 in All T Helper Cells
(A) Enrichment of Prdm1 and Maf mRNA in in-vitro-generated T helper cells validated by qPCR. (B) ChIP-seq of Maf in Th17 cells and Prdm1 in tissue-resident memory T cells aligned with ATAC-seq data of Tr1 cells differentiated in vitro at 72 h. (C) Luciferase activity in 293T cells transfected with Il10 luciferase reporters along with constructs encoding Prdm1, Maf, or both. n = 3. (D) T helper cells differentiated in vitro were transduced with two retroviruses expressing Prdm1 and Maf, respectively. IL-10 expression in control cells, Prdm1-overexpressing cells, Maf-overexpressing cells, and cells overexpressing Prdm1 and Maf was measured by flow cytometry 48 h after transduction.
Figure 7.
Figure 7.. Genetic Deficiency of Prdm1 and Maf, but Not Either Alone, in T Cells Leads to Human IBD-like Spontaneous Colitis Driven by a Unique Cluster of Treg Cells
(A) Weekly monitored body weights. Top: female mice. Bottom: male mice. n ≥ 8. Data are represented as mean ± SD. (B) Colon length of the indicated mice, presented as seen by gross anatomy and measurement. (C) Hematoxylin and eosin staining of colon Swiss rolls. Pictures are representative of 10 control, 4 Prdm1 cKO, 6 Maf cKO, and 7 DKO mice. Scale bars represent 250 μm. (D–K) CD4 T cells from colonic lamina propria were profiled by scRNA-seq. (D and E) Uniform manifold approximation and projection (UMAP) plots show 13,535 cells (dots) colored by genotype (D) or cluster (E). (F) Distribution of cells with different genotypes in clusters. (G and H) Left: distribution of gene signature scores of Tconv cells (clusters 1–4) by genotype. “+” indicates median. (H) right: enrichment of IBD-associated GWAS genes that are involved in adaptive immunity in differentially expressed genes of Prdm1 cKO, Maf cKO, and DKO Tconv cells, respectively, compared with the control. Significance of enrichment was tested by hypergeometric test. (I-K) Gene expression level represented as log(TP10K+1). (I) Il10 expression by control (WT) cells across clusters. (J) Il10 expression by Treg cells (clusters 5–8) across genotypes. (K) Representative differentially expressed genes of DKO Treg cells compared with all other genotypes. Dot size represents the fraction of cells in the cluster that express the gene; color indicates mean expression in expressing cells relative to other genotypes.

References

    1. Anders S, and Huber W (2010). Differential expression analysis for sequence count data. Genome Biol. 11, R106. - PMC - PubMed
    1. Apetoh L, Quintana FJ, Pot C, Joller N, Xiao S, Kumar D, Burns EJ, Sherr DH, Weiner HL, and Kuchroo VK (2010). The aryl hydrocarbon receptor interacts with c-Maf to promote the differentiation of type 1 regulatory T cells induced by IL-27. Nat. Immunol 11, 854–861. - PMC - PubMed
    1. Artis D, Villarino A, Silverman M, He W, Thornton EM, Mu S, Summer S, Covey TM, Huang E, Yoshida H,et al. (2004). The IL-27 receptor(WSX-1) is an inhibitor of innate and adaptive elements of type 2 immunity. J. Immunol 173, 5626–5634. - PubMed
    1. Awasthi A, Carrier Y, Peron JPS, Bettelli E, Kamanaka M, Flavell RA, Kuchroo VK, Oukka M, and Weiner HL (2007). A dominant function for interleukin 27 in generating interleukin 10-producing anti-inflammatory T cells. Nat. Immunol 8, 1380–1389. - PubMed
    1. Batten M, Li J, Yi S, Kljavin NM, Danilenko DM, Lucas S, Lee J, de Sauvage FJ, and Ghilardi N (2006). Interleukin 27 limits autoimmune encephalomyelitis by suppressing the development of interleukin 17-producing T cells. Nat. Immunol 7, 929–936. - PubMed

Publication types