. 2020 Nov 24;33(8):108424.
doi: 10.1016/j.celrep.2020.108424.

A Two-Step Process of Effector Programming Governs CD4+ T Cell Fate Determination Induced by Antigenic Activation in the Steady State

Affiliations

A Two-Step Process of Effector Programming Governs CD4+ T Cell Fate Determination Induced by Antigenic Activation in the Steady State

Adeleye Opejin et al. Cell Rep. .

Abstract

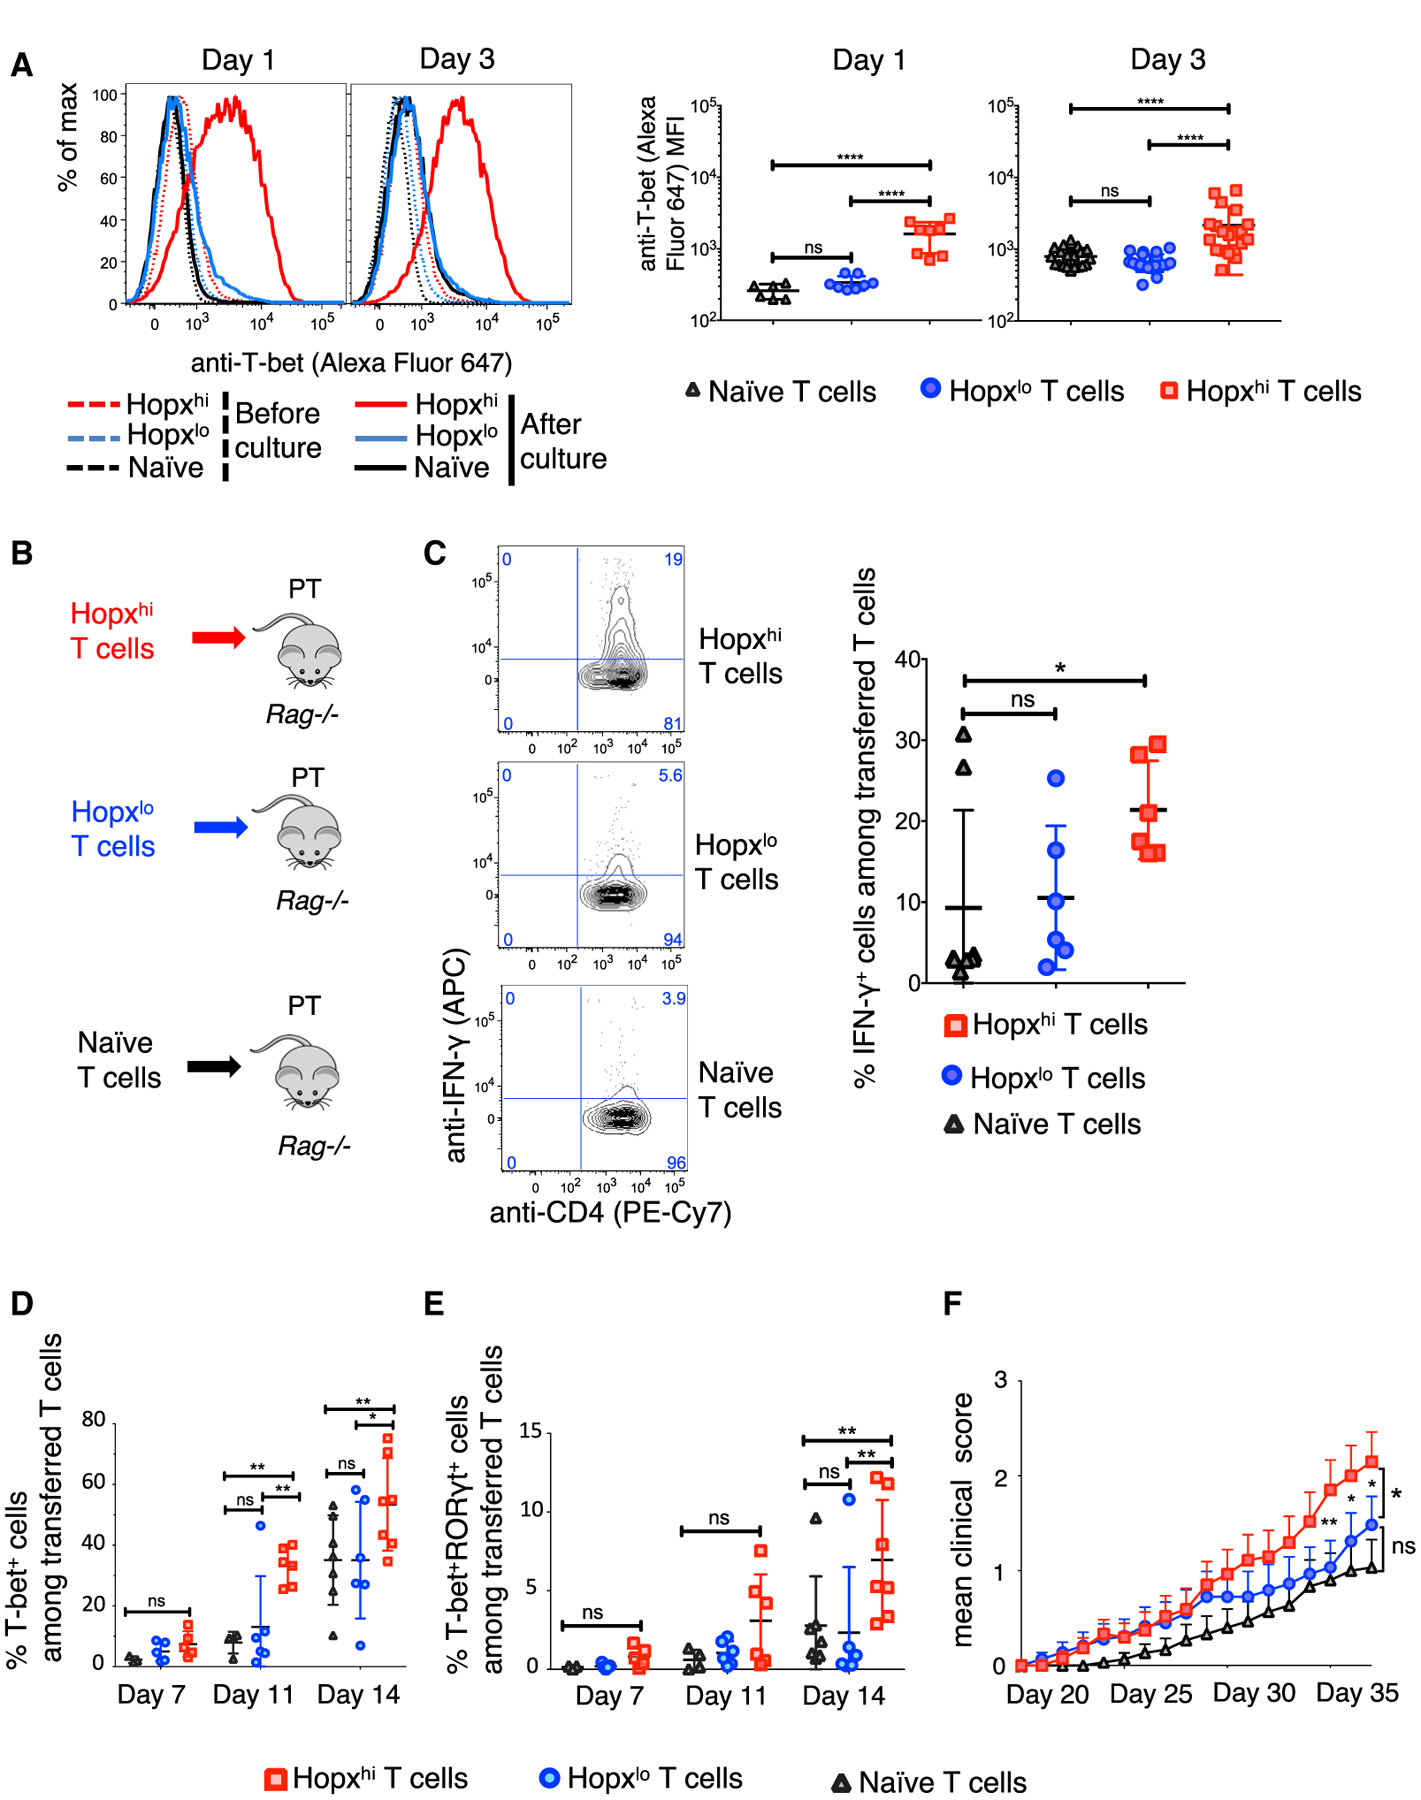
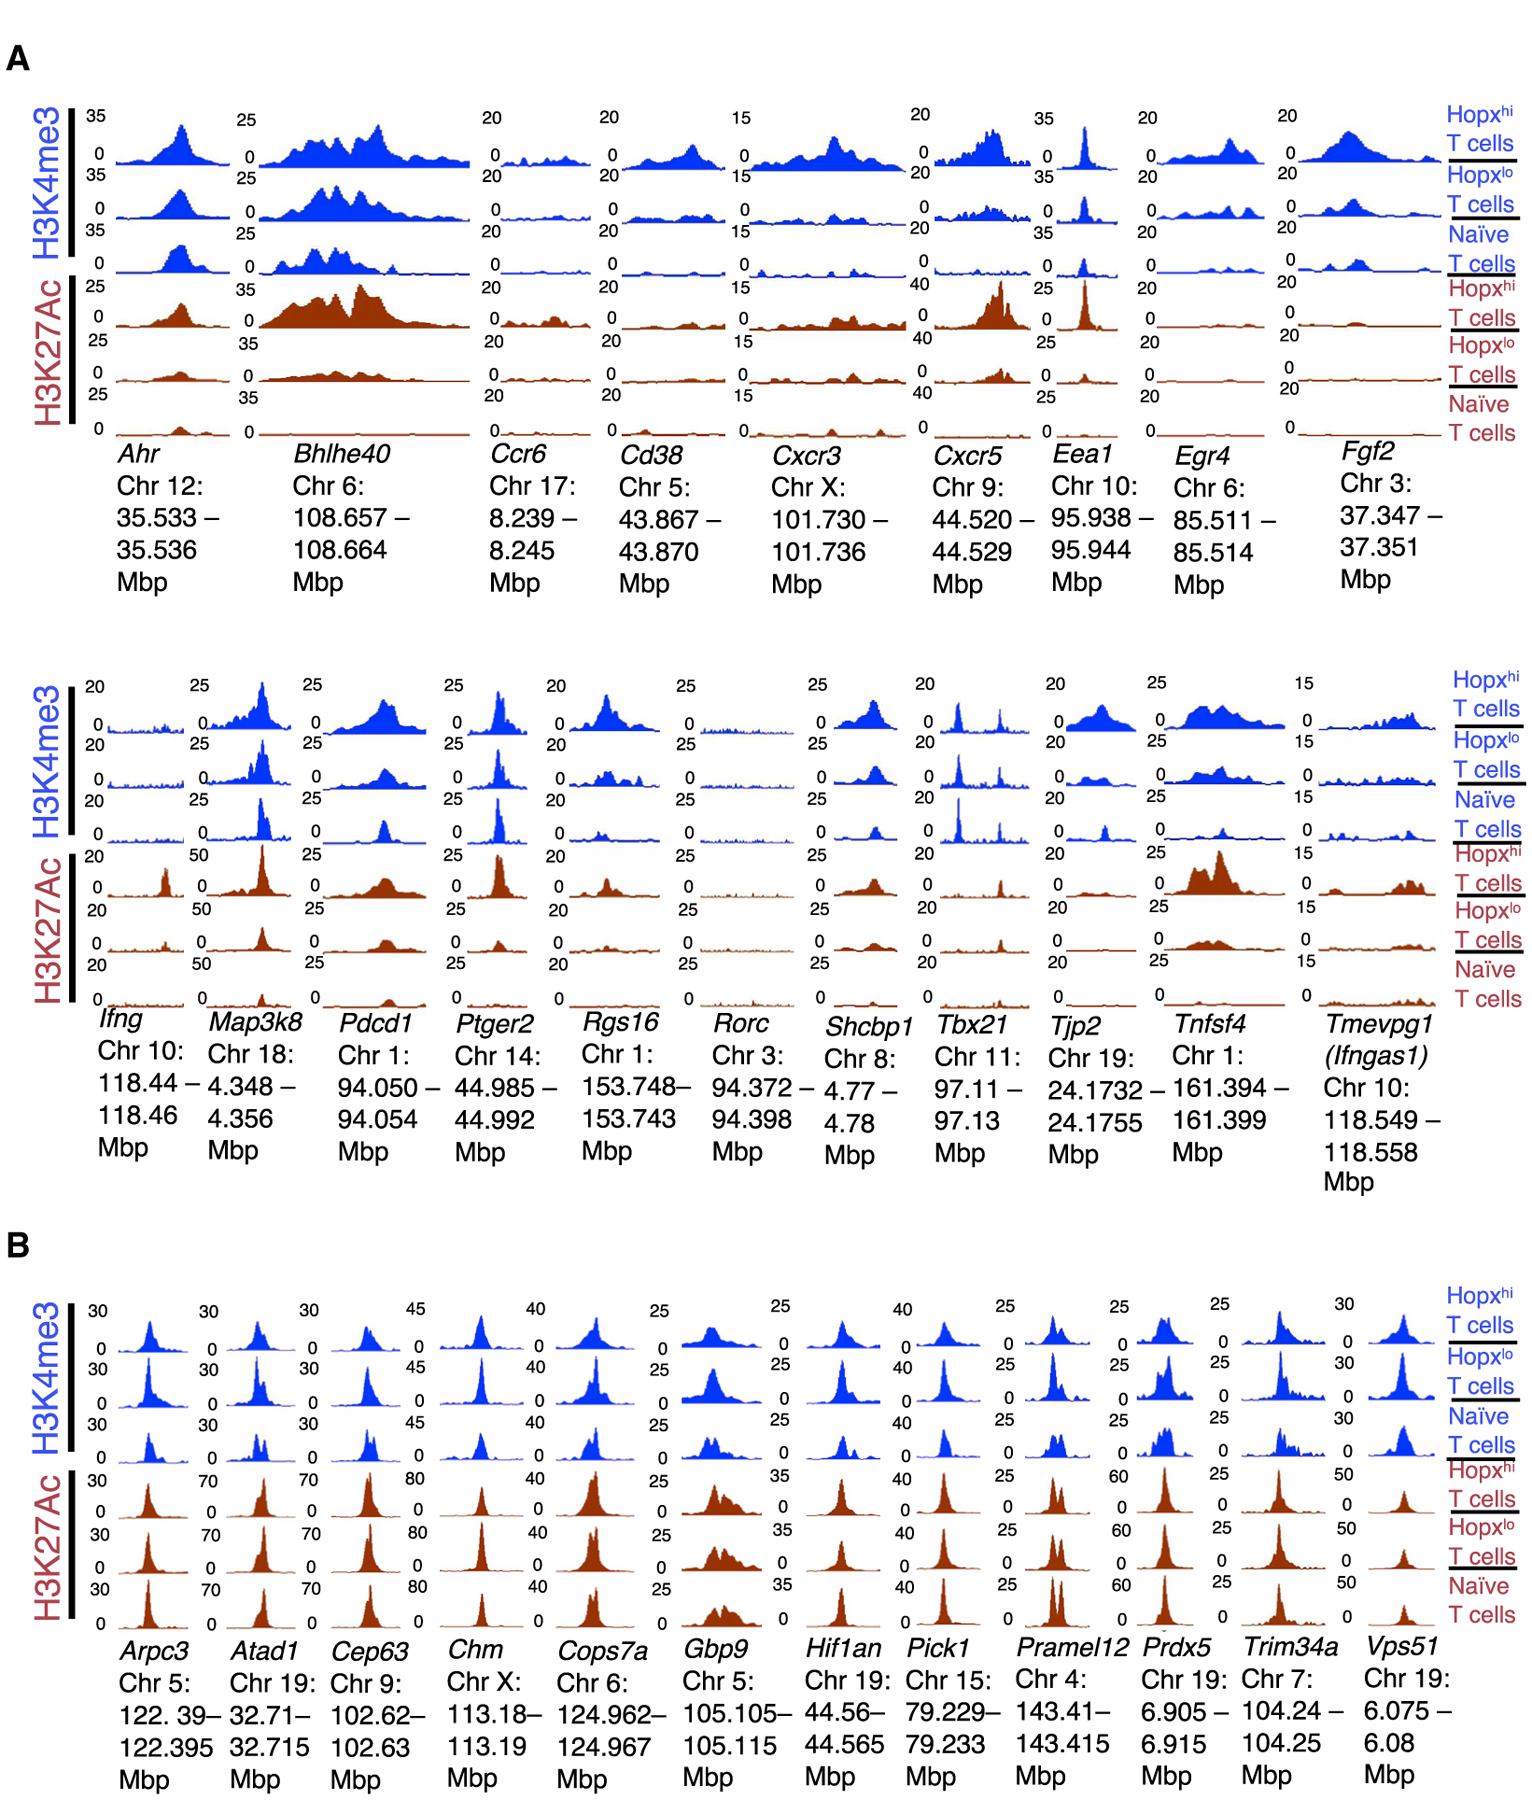
Various processes induce and maintain immune tolerance, but effector T cells still arise under minimal perturbations of homeostasis through unclear mechanisms. We report that, contrary to the model postulating primarily tolerogenic mechanisms initiated under homeostatic conditions, effector programming is an integral part of T cell fate determination induced by antigenic activation in the steady state. This effector programming depends on a two-step process starting with induction of effector precursors that express Hopx and are imprinted with multiple instructions for their subsequent terminal effector differentiation. Such molecular circuits advancing specific terminal effector differentiation upon re-stimulation include programmed expression of interferon-γ, whose production then promotes expression of T-bet in the precursors. We further show that effector programming coincides with regulatory conversion among T cells sharing the same antigen specificity. However, conventional type 2 dendritic cells (cDC2) and T cell functions of mammalian target of rapamycin complex 1 (mTORC1) increase effector precursor induction while decreasing the proportion of T cells that can become peripheral Foxp3+ regulatory T (pTreg) cells.

Keywords: EAE; Hopx; IFN-γ; T cells; autoimmune; dendritic cells; effector programming; mTORC1; steady state; tolerance.


Conflict of interest statement

Declaration of Interests The authors declare no competing interests.

Figures

Figure 1.
Figure 1.. Dendritic Cells Induce Regulatory and Effector-Related T Cells in the Steady State
(A and B) Induction of Hopxhi and Hopxlo T cells that differ in their pTreg cell conversion potential in vivo. (A) General experimental outline for examining Hopxhi and Hopxlo T cells. Plots (representative of multiple independent experiments) show Hopx (GFP) and Foxp3 (RFP) expression, and the corresponding regions indicate gating for automated cell sorting in pooled CD4+ T cells combined from peripheral lymph nodes and spleens obtained from MOG-specific TCR tg (2D2) HopxGFPFoxp3RFP mice 5 days after treatment with αDEC-MOG chimeric antibody. Arrows indicate adoptive transfers of Hopxhi and Hopxlo T cells into WT recipient mice that were then treated with either αDEC-MOG or PBS as indicated. (B) Representative plots show Foxp3 (RFP) expression and anti-CD25 staining intensity in the transferred CD4+ T cells among splenocytes from the recipients as in (A) analyzed by flow cytometry after 21 days. Numbers in quadrants show corresponding percentages. Graph shows mean ± standard deviation (SD) percentages of Foxp3+CD25+ pTreg cells among transferred CD4+ T cells in the indicated groups of recipients; ***p < 0.001 determined by unpaired t test, n = 4 per group from two independent experiments. (C) Expression of master regulators. The graphs show expression of Tbx21, Gata3, Rorc, Sfpi1, Bcl6, Irf4, Batf, Stat3, and Nr4a1 determined by RNA-sequencing (RNA-seq) in multiple independent replicates from the Hopxhi, Hopxlo, and naive 2D2 T cells obtained as in Figure S1F and analyzed as described in Star Methods. None of those genes have significantly different expression between Hopxhi and Hopxlo T cells. (D) Gene set enrichment analysis (GSEA). Individual genes whose expression is significantly different between Hopxhi and Hopxlo T cells and that were identified by the GSEA are shown as present in the indicated numbers of publicly available gene sets either positively (containing genes with upregulated expression in effector/memory T cells) or negatively (containing genes with downregulated expression in effector/memory T cells) associated with effector or memory T cells. The vertical axes show the specific ratio of expression of such genes in Hopxhi T cells and Hopxlo T cells, and red and blue dots denote individual genes with either upregulated or downregulated, respectively, expression in Hopxhi T cells in comparison with Hopxlo T cells. A shaded contour represents the distribution of projections of the dots onto the horizontal plane. (E) Immune gene expression. Heatmap shows expression of additionally identified genes whose expression is significantly different between Hopxhi and Hopxlo T cells and that are associated with specific immune cell functions (see text and Table 1). Multiple independent replicates are shown.
Figure 2.
Figure 2.. Effector Precursors Undergo Robust Terminal Differentiation In Vitro and In Vivo
(A) Induction of T-bet expression. Representative histograms show anti-T-bet intracellular staining intensity analyzed by flow cytometry in Hopxhi, Hopxlo, and naive 2D2 T cells that were obtained as in Figure S1F and then re-stimulated in vitro under Th0 conditions for either 1 or 3 days as indicated. Graphs show mean ± SD median fluorescence intensity (MFI) in the indicated groups, n = 6–20 replicates from three independent experiments using pooled material from multiple mice per group. (B) General experimental outline of analyzing the differentiation and functions in vivo of the Hopxhi, Hopxlo, and naive 2D2 T cells that were obtained as in Figure S1F and then adoptively transferred into multiple independent groups of Rag/ recipient mice also treated with pertussis toxin (PT). (C) Induction of IFN-γ expression. Representative plots show anti-CD4 and intracellular anti-IFN-γ staining intensity in the transferred CD4+CD3+ T cells among splenocytes analyzed by flow cytometry after 12 days and then additional re-stimulation in vitro. Graphs show mean ± SD percentages of IFN-γ+ cells among transferred T cells in the indicated groups, n = 5–6 individual mice per group from two independent experiments. (D–F) Terminal effector differentiation and acquisition of autoimmune functions of Hopxhi, Hopxlo, and naive T cells that were transferred as in (B). (D) Graphs show mean ± SD percentages of T-bet+ cells among transferred T cells in the indicated groups after 7, 11, or 14 days as indicated. (E) Graphs show mean ± SD percentages of T-bet+RORγt+ cells among transferred T cells in the indicated groups after 7, 11, or 14 days as indicated. (D and E) n = 3–7 individual mice per group from three independent experiments. (F) Graphs show mean ± SEM EAE disease scores in the indicated groups and at the indicated days; n = 25 individual mice per group from five independent experiments. *p < 0.05, **p < 0.01, ***p < 0.001, ****p < 0.0001, determined by Welch’s t test (A and C) or two-way ANOVA with Fisher’s least significant difference (LSD) (D–F). ns, not significant.
Figure 3.
Figure 3.. Epigenetic Modifications of T Cell Effector Fate Regulators in Effector Precursors
(A and B) Hopxhi, Hopxlo, and naive 2D2 T cells were obtained as in Figure S1F and analyzed by ChIP-seq. Genomic tracks were calculated from multiple independent experiments and show H3K4me3 and H3K27Ac enrichments for indicated genes or established enhancer regions (in case of Ifng) at the given positions in the genome. (A) Genomic tracks shown for identified relevant regulators of T cell fate. (B) Genomic tracks shown for select genes with no known functions in T cell differentiation.
Figure 4.
Figure 4.. Programmed Expression of Interferon-g in Effector Precursors Mediates an Expression of T-bet
(A and B) Robust induction of Ifng expression and IFN-γ production upon re-stimulation. (A) Hopxhi, Hopxlo, and naive 2D2 T cells were obtained as in Figure S1F and then additionally re-stimulated in vitro under Th0 conditions for 12 h as indicated (see Star Methods). RNA-seq heatmaps show expression of T cell-relevant genes whose expression in Hopxhi and Hopxlo T cells was found to be significantly different after the re-stimulation, but not in the absence of re-stimulation. Multiple independent replicates of Hopxhi, Hopxlo, and naive T cell groups are shown. (B) Hopxhi, Hopxlo, and naive 2D2 T cells were obtained as in Figure S1F and were then cultured in vitro under Treg cell-skewing conditions for 4 days. The concentration of IFN-γ was measured in the supernatants at the end of the cultures. Results show mean ± SD MFI in the indicated groups; n = 12–20 replicates from three independent experiments using pooled material from multiple mice per group. ***p < 0.001, determined by Welch’s t test. (C) IFN-γ induces T-bet expression. Representative histograms show anti-T-bet intracellular staining intensity analyzed by flow cytometry in Hopxhi, Hopxlo, and naive 2D2 T cells that were obtained as in Figure S1F and then re-stimulated under Th0 conditions for 3 days in the presence of either anti-IFN-γ or isotype control antibody as indicated. Graphs show mean ± SD MFI in the indicated groups, n = 10–14 replicates from three independent experiments using pooled material from multiple mice per group. ***p < 0.001, determined by Welch’s t test.
Figure 5.
Figure 5.. cDC2 and mTORC1 Increase Induction of Effector Precursors
(A) Impact of mTORC1 on the formation of effector precursors. Hopx(GFP)negFoxp3(RFP)negCD25neg 2D2 T cells were isolated from Rptor/ and Rptor+/+ 2D2 HopxGFPFoxp3RFP mice and were adoptively transferred into congenically labeled recipient mice that were then treated with αDEC-MOG. Representative plots show Hopx(GFP) and Foxp3(RFP) expression in the transferred CD4+ T cells among splenocytes analyzed by flow cytometry after 3 and 5 days as indicated. Numbers in quadrants show corresponding percentages. Graphs show mean ± SD percentages of Hopxhi cells among transferred CD4+ T cells in indicated groups of recipients; n = 11–12 individual mice per group from five independent experiments. (B) Induction of T-bet expression in the absence of mTORC1. Representative histograms show anti-T-bet intracellular staining intensity analyzed by flow cytometry in Rptor/ and Rptor+/+ Hopxhi, Hopxlo, and naive 2D2 T cells that were obtained as outlined in Figure S1F from the Rptor/ and Rptor+/+ 2D2 HopxGFPFoxp3RFP mice pre-treated with either αDEC-MOG or PBS. T cells were then re-stimulated in vitro under Th0 conditions for 3 days as indicated. Graphs show mean ± SD MFI in the indicated groups; n = 4–15 replicates using pooled material from multiple mice per group from four independent experiments. (C) Enhanced formation of effector precursors after antigenic stimulation mediated by cDC2. Hopx(GFP)negFoxp3(RFP)negCD25neg 2D2 T cells were adoptively transferred into congenically labeled recipient mice that were then treated with either αDEC-MOG or αDCIR2-MOG. Representative plots show Hopx(GFP) and Foxp3(RFP) expression in the transferred CD4+ T cells among splenocytes analyzed by flow cytometry after 3 and 5 days as indicated. Numbers in quadrants show corresponding percentages. Graphs show mean ± SD percentages of Hopxhi cells among transferred CD4+ T cells in the indicated groups of recipients; n = 3–6 individual mice per group from three independent experiments. (D) T-bet expression. Representative histograms show anti-T-bet intracellular staining intensity analyzed by flow cytometry in Hopxhi, Hopxlo, and naive 2D2 T cells obtained as outlined in Figure S1F from 2D2 HopxGFPFoxp3RFP mice that were pre-treated with αDCIR2-MOG and then re-stimulated in vitro under Th0 conditions for 3 days. Graphs show mean ± SD MFI in the indicated groups; n = 3–15 replicates using pooled material from multiple mice per group. Results represent one of two independent experiments. *p < 0.05, **p < 0.01, ***p < 0.001, ****p < 0.0001, determined by two-way ANOVA with Sidak’s multiple comparisons (A and C) or Welch’s t test (B and D). ns, not significant.

References

    1. Acuff NV, Li X, Kirkland R, Nagy T, and Watford WT (2015). Tumor progression locus 2 differentially regulates IFNγ and IL-17 production by effector CD4+ T cells in a T cell transfer model of colitis. PLoS ONE 10, e0119885. - PMC - PubMed
    1. Albrecht I, Niesner U, Janke M, Menning A, Loddenkemper C, Kühl AA, Lepenies I, Lexberg MH, Westendorf K, Hradilkova K, et al. (2010). Persistence of effector memory Th1 cells is regulated by Hopx. Eur. J. Immunol 40, 2993–3006. - PubMed
    1. Alspach E, Lussier DM, Miceli AP, Kizhvatov I, DuPage M, Luoma AM, Meng W, Lichti CF, Esaulova E, Vomund AN, et al. (2019). MHC-II neoantigens shape tumour immunity and response to immunotherapy. Nature 574, 696–701. - PMC - PubMed
    1. Ardouin L, Luche H, Chelbi R, Carpentier S, Shawket A, Montanana Sanchis F, Santa Maria C, Grenot P, Alexandre Y, Grégoire C, et al. (2016). Broad and Largely Concordant Molecular Changes Characterize Tolerogenic and Immunogenic Dendritic Cell Maturation in Thymus and Periphery. Immunity 45, 305–318. - PubMed
    1. Awasthi A, Riol-Blanco L, Jäger A, Korn T, Pot C, Galileos G, Bettelli E, Kuchroo VK, and Oukka M (2009). Cutting edge: IL-23 receptor gfp reporter mice reveal distinct populations of IL-17-producing cells. J. Immunol 182, 5904–5908. - PMC - PubMed

Publication types