. 2021 Jan 20;109(2):257-272.e14.
doi: 10.1016/j.neuron.2020.11.002. Epub 2020 Nov 24.

Transformative Network Modeling of Multi-omics Data Reveals Detailed Circuits, Key Regulators, and Potential Therapeutics for Alzheimer's Disease

Affiliations

Transformative Network Modeling of Multi-omics Data Reveals Detailed Circuits, Key Regulators, and Potential Therapeutics for Alzheimer's Disease

Minghui Wang et al. Neuron. .

Abstract

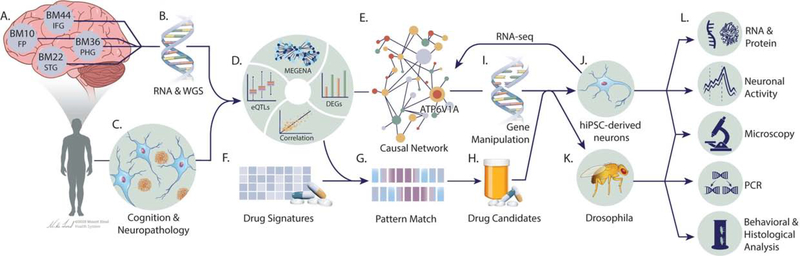
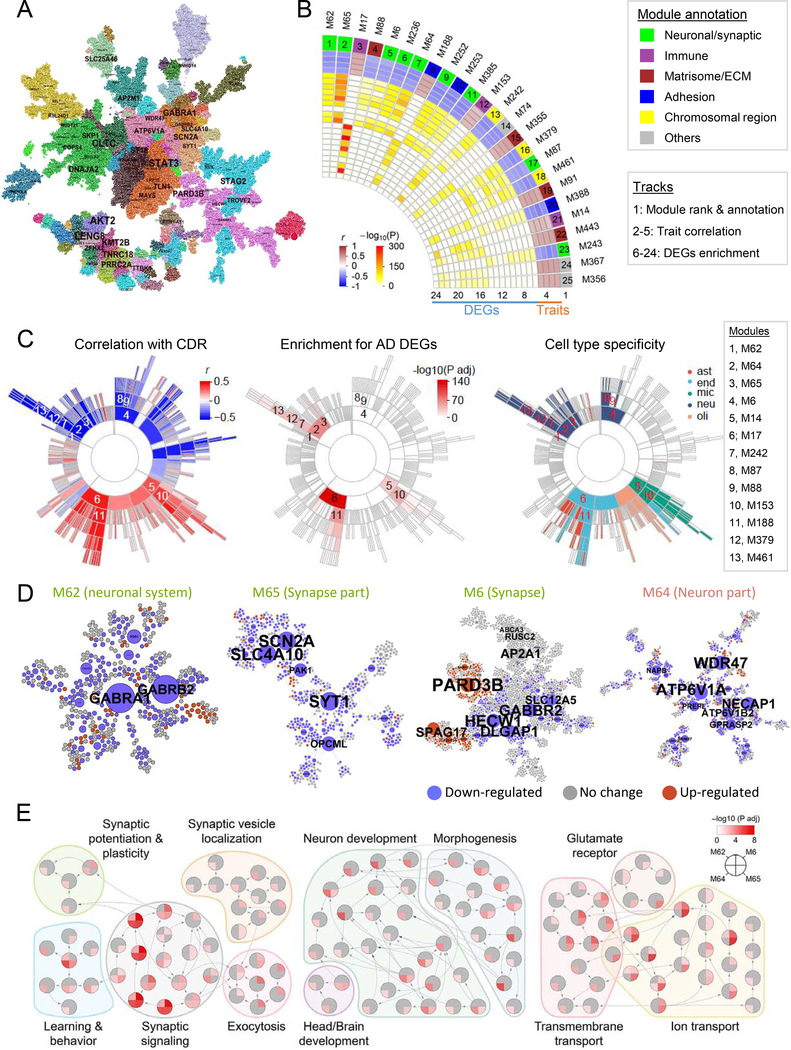
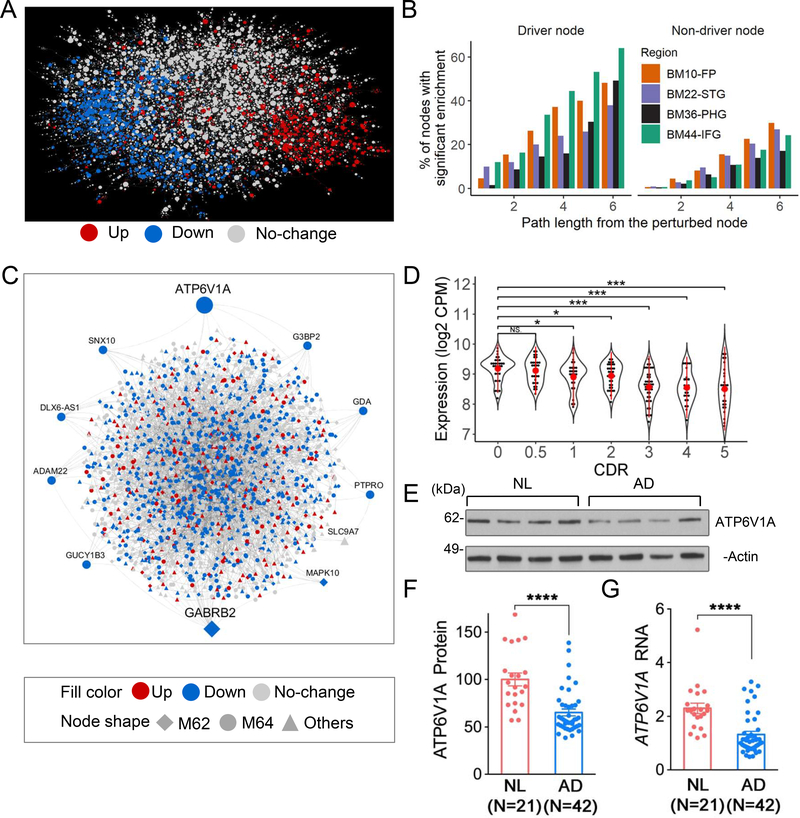
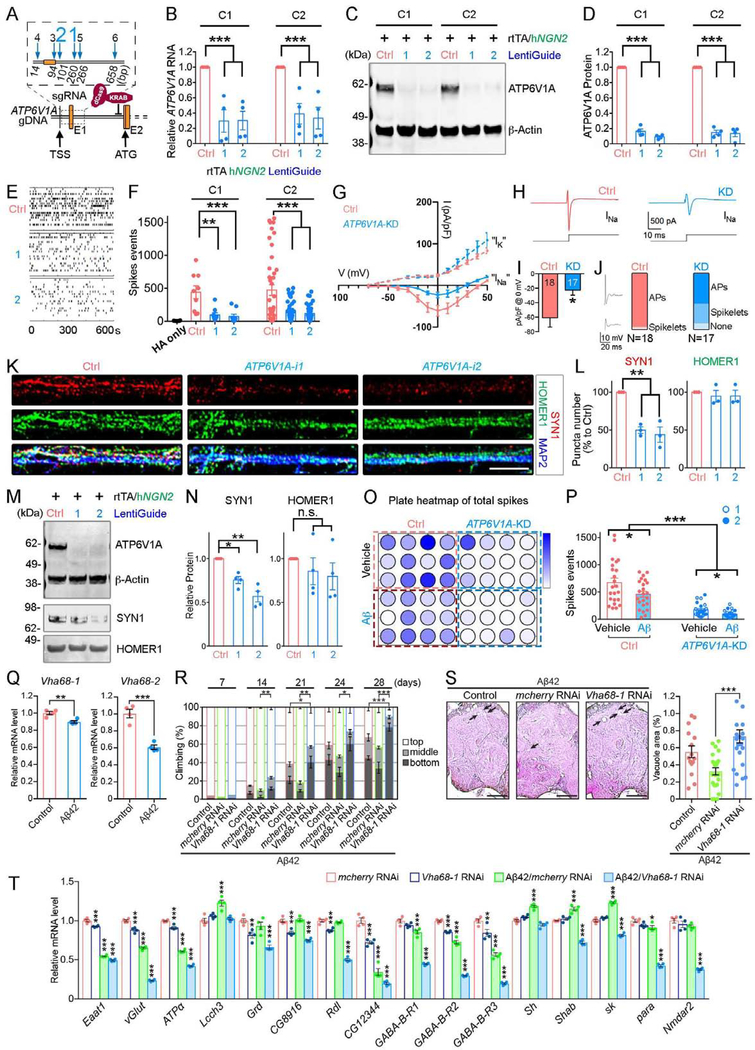
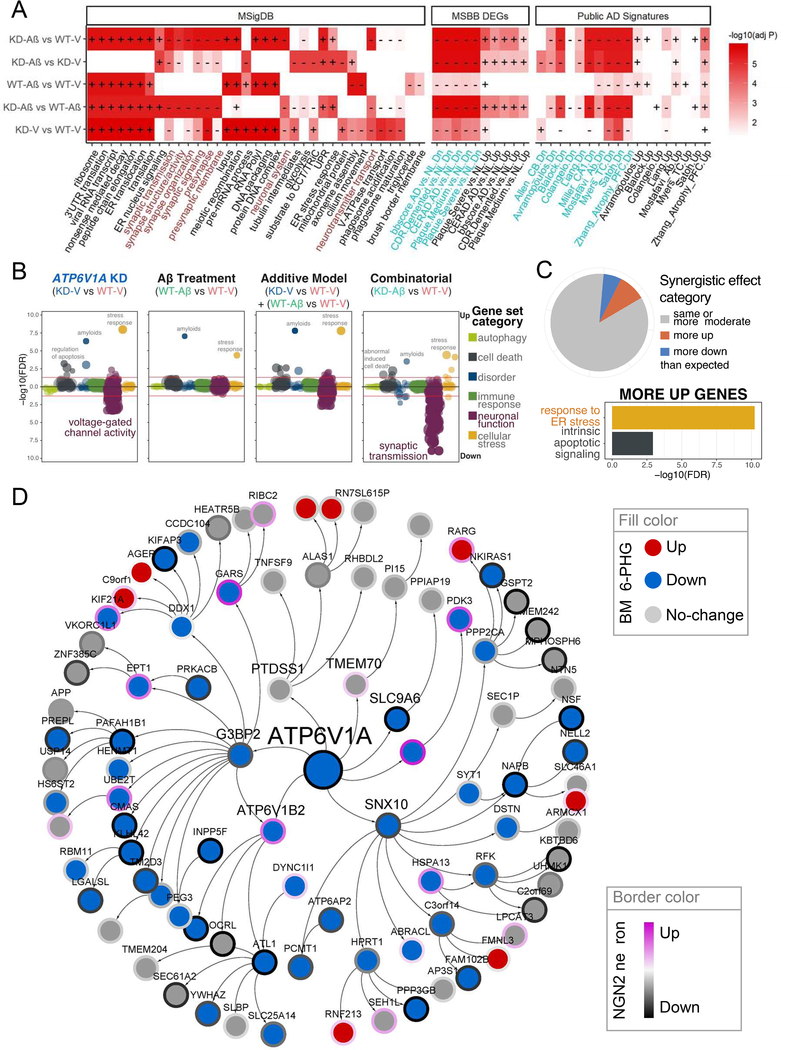
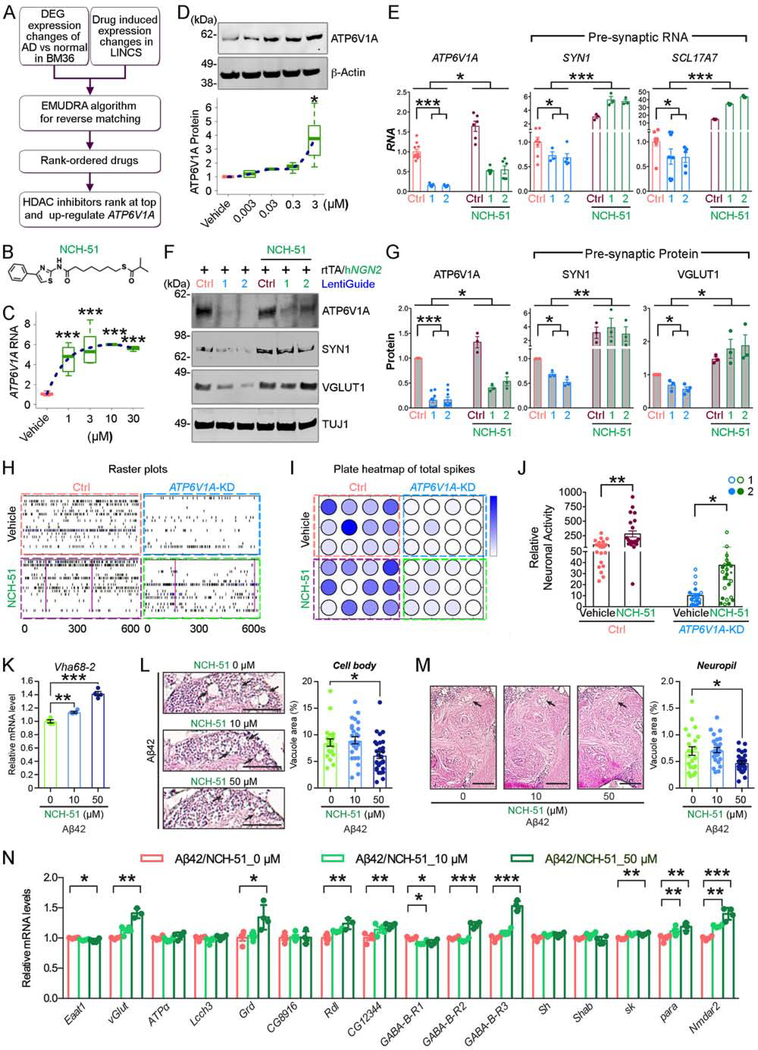
To identify the molecular mechanisms and novel therapeutic targets of late-onset Alzheimer's Disease (LOAD), we performed an integrative network analysis of multi-omics profiling of four cortical areas across 364 donors with varying cognitive and neuropathological phenotypes. Our analyses revealed thousands of molecular changes and uncovered neuronal gene subnetworks as the most dysregulated in LOAD. ATP6V1A was identified as a key regulator of a top-ranked neuronal subnetwork, and its role in disease-related processes was evaluated through CRISPR-based manipulation in human induced pluripotent stem cell-derived neurons and RNAi-based knockdown in Drosophila models. Neuronal impairment and neurodegeneration caused by ATP6V1A deficit were improved by a repositioned compound, NCH-51. This study provides not only a global landscape but also detailed signaling circuits of complex molecular interactions in key brain regions affected by LOAD, and the resulting network models will serve as a blueprint for developing next-generation therapeutic agents against LOAD.

Keywords: ATP6V1A; Alzheimer’s disease; Drosophila; NCH-51; NGN2 neurons; human induced pluripotent stem cell; network biology; neuronal dysregulation; omics.


Conflict of interest statement

Declaration of Interests The authors declare no competing interests.

Figures

Fig. 1.
Fig. 1.. A transformative network modeling platform for mechanism discovery, target identification, and therapeutics development for Alzheimer’s disease.
(A-C) Functional genomic data from disease modified brains and AD-related clinical and pathological phenotypes are collected. (D) The input data are integrated to identify disease gene signatures and co-expressed gene modules using MEGENA. (E) The top modules are projected onto causal networks to identify key driver genes of the disease. (F-H) Candidate drugs that can reverse the disease gene signatures and driver genes are predicted by an advanced pattern matching algorithm. (I-L) The disease relevance of key drivers (e.g., ATP6V1A) is tested in model systems like hiPSC-derived brain cells and Drosophila through (i) gene perturbations and (ii) drug rescue experiments.
Fig. 2.
Fig. 2.. Gene coexpression network analysis prioritizes neuronal modules associated with LOAD.
A, The MEGENA network in BM36-PHG. Node color denotes module membership. Font size of gene name is proportional to degree of connectivity. B, The 25 top-ranked modules. The heatmap shows the module ranking (number) and functional annotation (color) in track 1, the correlations (r) with the traits including bbscore, CDR, CERAD, and PlaqueMean in tracks 2–5, and adjusted P values of enrichment for down-(tracks 6–14) and up-regulated (tracks 15–24) DEGs. C, Sunburst plots showing the module hierarchy and correlation with CDR, enrichment for CDR demented-vs-nondemented DEGs, and enrichment for cell type markers. Numbers 1–13 denote 13 top-ranked modules as listed to the right. ast stands for astrocytes, end for endothelial, mic for microglia, neu for neurons and oli for oligodendrocytes. D, Networks of the top ranked neuronal modules M62, M65, M6, and M64. Node color denotes expression change in demented brains. Node size is proportional to node connectivity. E, Top-ranked neuronal modules enriched for GO biological process (BP) hierarchy in relation to synaptic function, neuronal development, and transportation. Each node denotes a GO/BP term, with a pie-chart displaying the significance of enrichment for the 4 neuronal modules in D. See also Fig. S6 & Table S5–7.
Fig. 3.
Fig. 3.. Bayesian probabilistic causal network (BN) analysis predicts novel key drivers of LOAD.
A, BN in the BM36-PHG. B, Validation of the BN structure. The left panel shows the percentage of the global BN key drivers whose network neighborhoods are enriched for the perturbation signature. The right panel shows the same analysis for the non-driver nodes. C, Projection of the modules M62 and M64 onto the BM36-PHG BN. Node labels are shown for the module key drivers. D-G, A novel network key driver ATP6V1A is down-regulated in LOAD. D, ATP6V1A expression in the RNA-seq data of the BM36-PHG region as stratified by CDR. E-G, Validation of ATP6V1A expression change in MSBB BM36-PHG samples using western blot (WB) (E-F) and qRT-PCR (G) analyses. E, Representative WB of ATP6V1A level. (t-test or ANOVA with Dunnett’s test. Error bars represent SE. *p < 0.05. **p < 0.01. ***p < 0.001. ****p < 0.0001. NS, no significance.). NL, normal control. See also Fig. S12–14 & Table S14–15.
Fig. 4.
Fig. 4.. Repression of ATP6V1A leads to neuronal malfunction in human NGN2-neurons and Aβ42 transgenic flies.
A, ATP6V1A gene editing by the CRISPR/dCas9-KRAB system. 6 different gRNAs are designed for targeting the ATP6V1A promoter. TSS: transcription start site. ATG translation initiation codon is in exon 2. B, qRT-PCR analysis (n = 4) confirms the decreased ATP6V1A RNA by gRNA candidates 1 & 2 (i1 and i2) in 2 independent cell lines of iNs (i.e., C1 and C2). C-D, Representative WB and quantitative analysis (n = 4) of ATP6V1A protein level in iNs. β-Actin is a loading control. E-F, Representative raster plots of spike events over 10 min and analysis (n = 6~45 wells) of D21 iNs. G, Current-voltage (I-V) plot for inward sodium (INa) and outward potassium (IK) currents. Current density (pA/pF) is shown. Holding potential was −80 mV. H, Representative examples of putative inward voltage-gated sodium current at 0 mV. I, Bar plot shows mean inward sodium current densities at 0 mV for ATP6V1A KD (n=17) and control neurons (n=18), (p = 0.015). J, Box plots show the fraction of neurons that displayed a full action potential (AP), spikelets, or no events with a current injection step (0.1 nA) positive to the threshold for control and KD neurons. Inset shows representative examples of AP & spikelet. K, Representative confocal images of synaptic proteins (SYN1, red; HOMER1, green) and pan-neuronal marker MAP2 (blue). Bar, 20 μm. L, Analysis of SYN1 and HOMER1-immunoreactive puncta numbers (n = 3). M-N, Representative WB and quantitative analysis (n = 4) of SYN1 and HOMER1 levels. O-P, Multi-electrode array after exposure to 5 μM Aβ at 24 hours. O, Plate map of total spike events; P, Analysis of spike events (n = 12 wells). Q, mRNA levels of Vha68–1 and Vha68–2 were decreased in the Aβ42 fly heads (n = 4). R, Vha68–1 KD in neurons exacerbated locomotor deficits caused by Aβ42 as revealed by climbing assay. n = 5 except for 7-day (n = 2). S, Neuronal KD of Vha68–1 significantly worsened neurodegeneration in Aβ42 fly brains. Representative images show the central neuropil of 33-day-old fly brains. Scale bars: 50 μm. Percentages of vacuole areas (indicated by arrows) were analyzed. n = 12–24 hemispheres. T, mRNA levels of genes related to synapse biology were significantly reduced in Aβ42-expressing flies with neuronal KD of ATP6V1A/Vha68–1 (n = 4). See also Fig. S16–21. (See Fig. 3 for statistical test and P value annotations).
Fig. 5.
Fig. 5.. RNA-seq analysis of ATP6V1A KD neurons validates ATP6V1A regulated neuronal networks in LOAD brains.
A, Top MSigDB gene sets and human AD signatures enriched in the perturbations of iNs. Plus (+) and minus (−) symbols denote the sign of the GSEA enrichment score (ES). Brown color in the x-axis of the left panel highlights the neuronal related terms. Cyan color in the x-axis of the two right panels highlights the down-regulated signatures. B-C, Analysis of synergistic effect between ATP6V1A KD and Aβ treatment in iNs. B, Summary of the functional categories that are likely to be impacted by the synergistic effect. C, Pie-chart shows percentages of genes that exhibit synergistic difference following combinatorial treatment compared to the expected additive model. Bar-chart shows pathways enriched for genes with “more up” regulation. D, Genes within a path length of 3 from ATP6V1A on the BM36-PHG BN were enriched for down-regulated signals of Aβ-KD vs. V-WT (GSEA normalized ES = 2.3, adjusted P-value = 8.3E-6). See also Fig. S22–23 & Table S16–20.
Fig. 6.
Fig. 6.. A novel compound NCH-51 increases ATP6V1A expression and partially restores neuronal function.
A, The procedure for predicting compounds that could increase ATP6V1A expression and reverse transcriptomic signature of LOAD. B, Chemical structure of NCH-51. C, Effects of NCH-51 at 1, 3, 10, 30 μM on ATP6V1A mRNA level post 24-h exposure. D, Effects of NCH-51 at 0.003, 0.03, 0.3, 3 μM on ATP6V1A protein level post 48-h exposure. β-Actin is a loading control. A blue dotted line is curve fitted for the set of data points. E, mRNA expression of ATP6V1A and the presynaptic SYN1 and SCL17A7 in iNs in the absence and presence of 3 μM NCH-51. n = 3–12. F-G, Representative WB and quantitative analysis (n = 3–8) of ATP6V1A, SYN1, and VGLUT1 proteins. TUJ1 is a loading control. H-J, Multi-electrodes array after exposure to 3 μM NCH-51. H, Representative raster plots of the spike events over 10 minutes. I, plate map of total spike events; J, analysis of spike events (n = 24 wells). K, NCH-51 increased mRNA levels of Vha68–2 in Aβ42 flies. n = 4. L-M, NCH-51 suppressed neurodegeneration in both the cell body (L) and central neuropil regions (M) in 21-day-old Aβ42 fly brains. Scale bars: 200 μm. Percentages of vacuole areas (indicated by arrows) were analyzed. n = 22–28 hemispheres. N, NCH-51 increased mRNA levels of synaptic biology related genes in Aβ42 fly brains in a dose-dependent manner (n = 4). See also Fig. S24–26 & Table S21. (See Fig. 3 for statistical test and P value annotations).

Comment in

References

    1. Abbas YM, Wu D, Bueler SA, Robinson CV, and Rubinstein JL (2020). Structure of V-ATPase from the mammalian brain. Science 367, 1240–1246. - PMC - PubMed
    1. Allen M, Carrasquillo MM, Funk C, Heavner BD, Zou F, Younkin CS, Burgess JD, Chai HS, Crook J, Eddy JA, et al. (2016). Human whole genome genotype and transcriptome data for Alzheimer’s and other neurodegenerative diseases. Scientific Data 3, 160089. - PMC - PubMed
    1. Allen M, Wang X, Burgess JD, Watzlawik J, Serie DJ, Younkin CS, Nguyen T, Malphrus KG, Lincoln S, Carrasquillo MM, et al. (2018). Conserved brain myelination networks are altered in Alzheimer’s and other neurodegenerative diseases. Alzheimer’s & Dementia 14, 352–366. - PMC - PubMed
    1. Ando K, Maruko-Otake A, Ohtake Y, Hayashishita M, Sekiya M, and Iijima KM (2016). Stabilization of Microtubule-Unbound Tau via Tau Phosphorylation at Ser262/356 by Par-1/MARK Contributes to Augmentation of AD-Related Phosphorylation and Aβ42-Induced Tau Toxicity. PLoS Genet 12, e1005917. - PMC - PubMed
    1. Association A.s. (2018). 2018 Alzheimer’s disease facts and figures. Alzheimer’s & Dementia 14, 367–429.

Publication types