. 2020 Dec 7;55(5):574-587.e3.
doi: 10.1016/j.devcel.2020.10.020. Epub 2020 Nov 24.

NLR-1/CASPR Anchors F-Actin to Promote Gap Junction Formation

Affiliations

NLR-1/CASPR Anchors F-Actin to Promote Gap Junction Formation

Lingfeng Meng et al. Dev Cell. .

Abstract

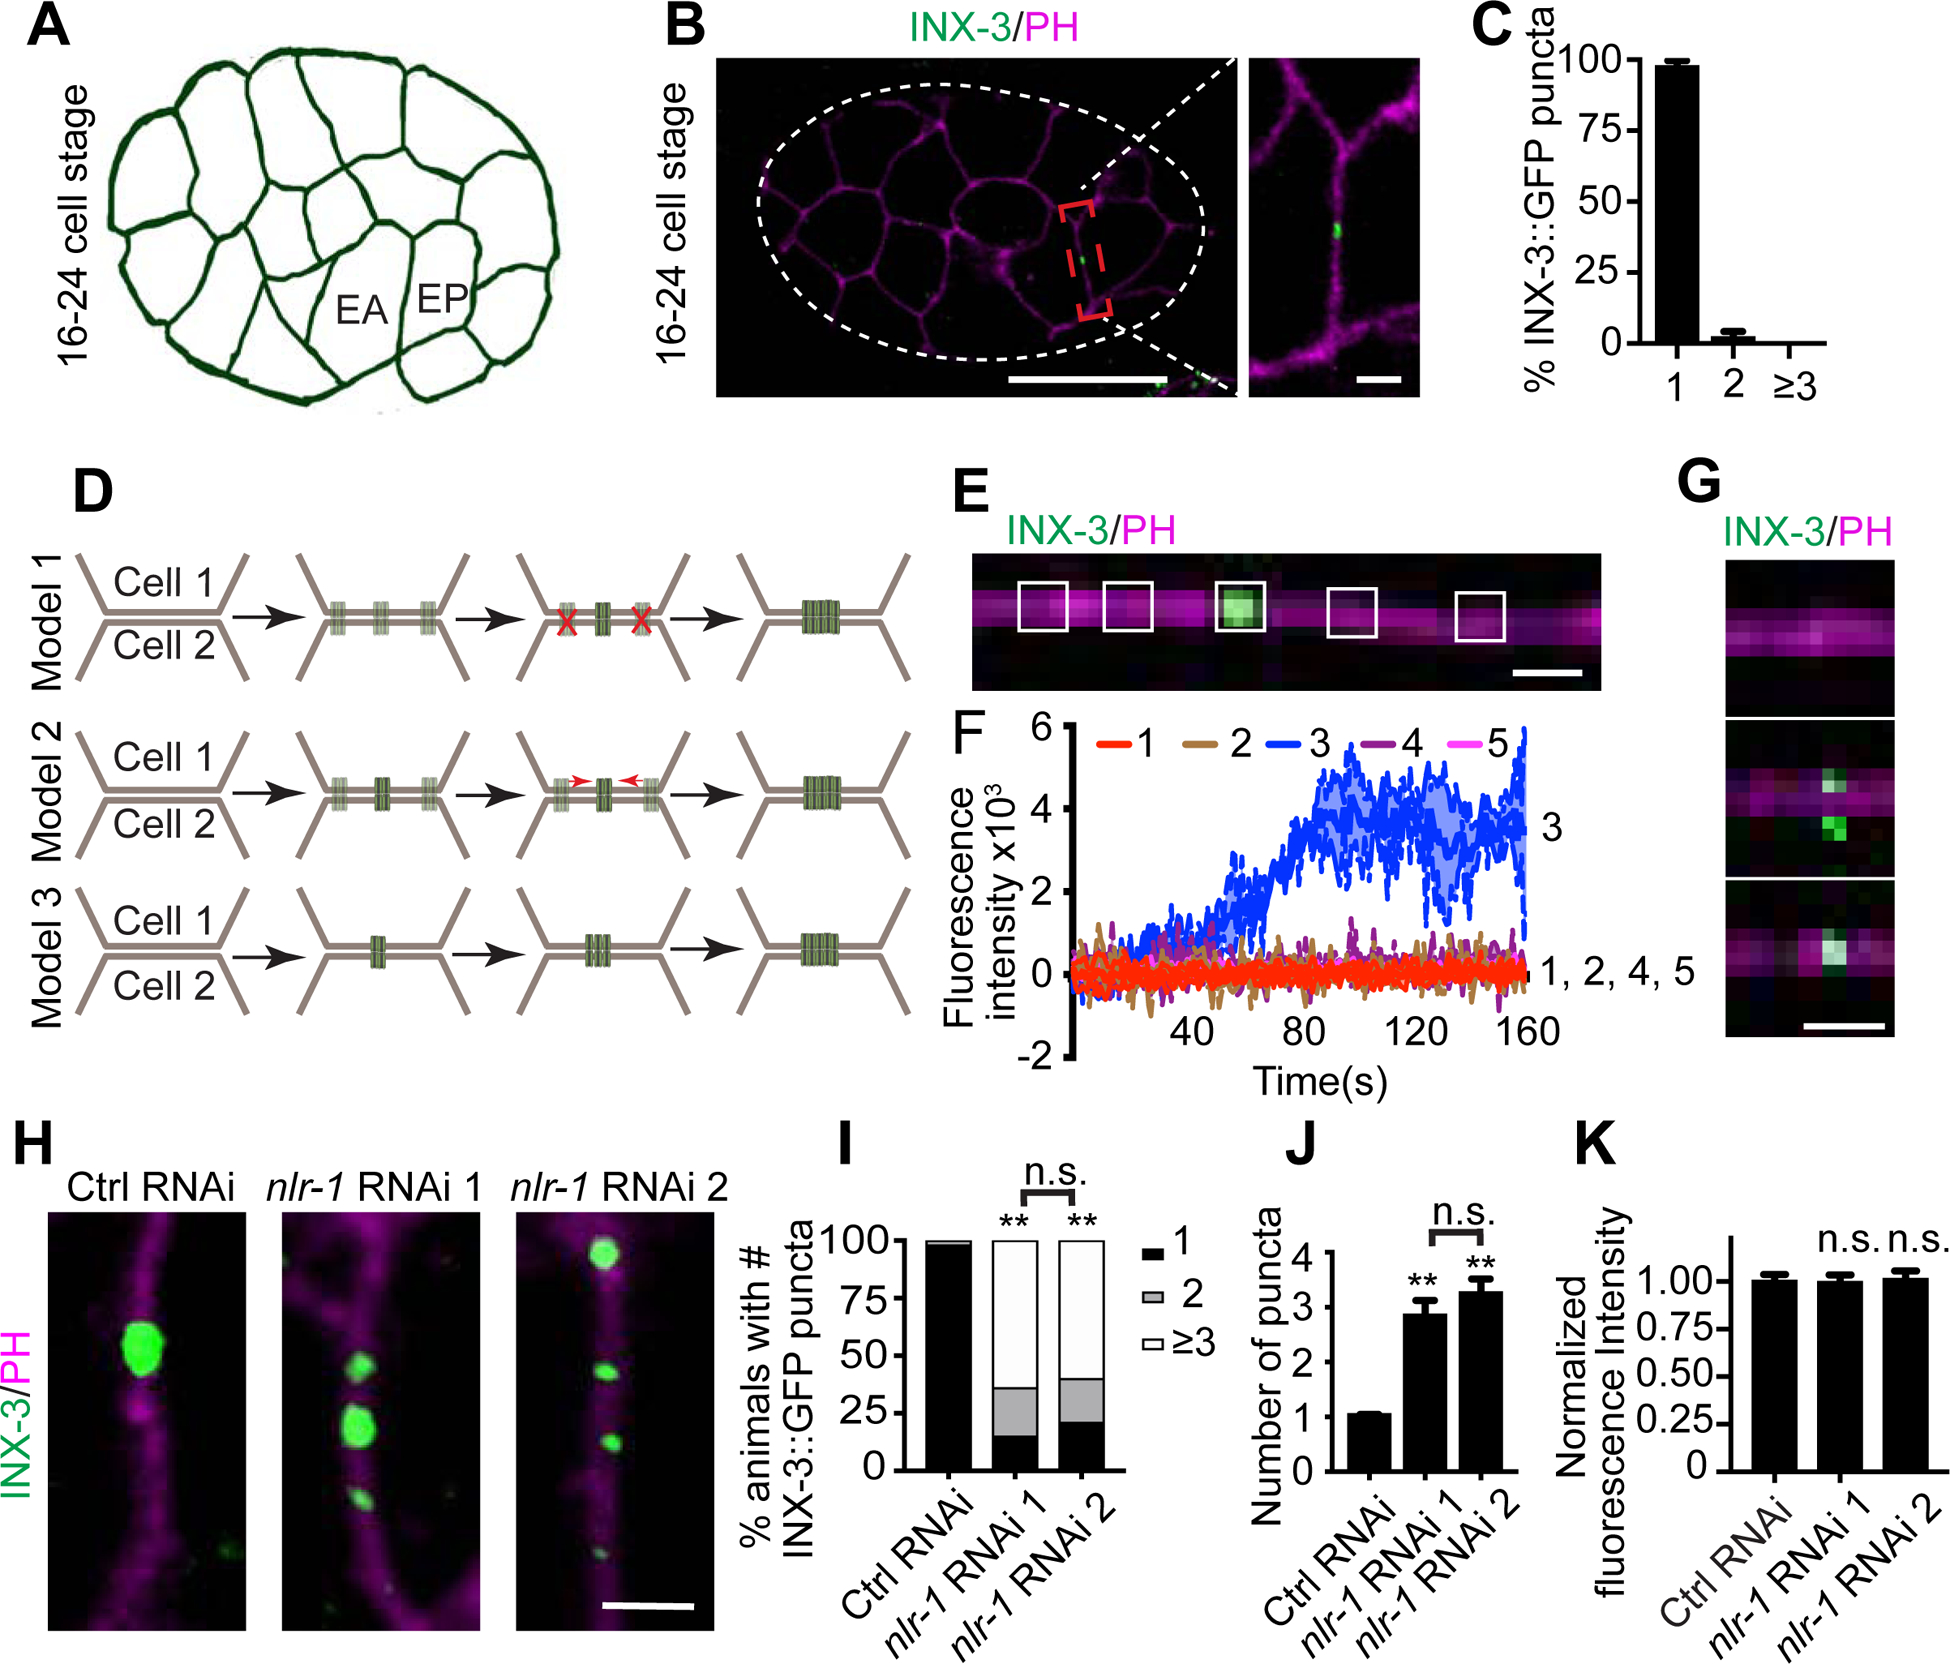
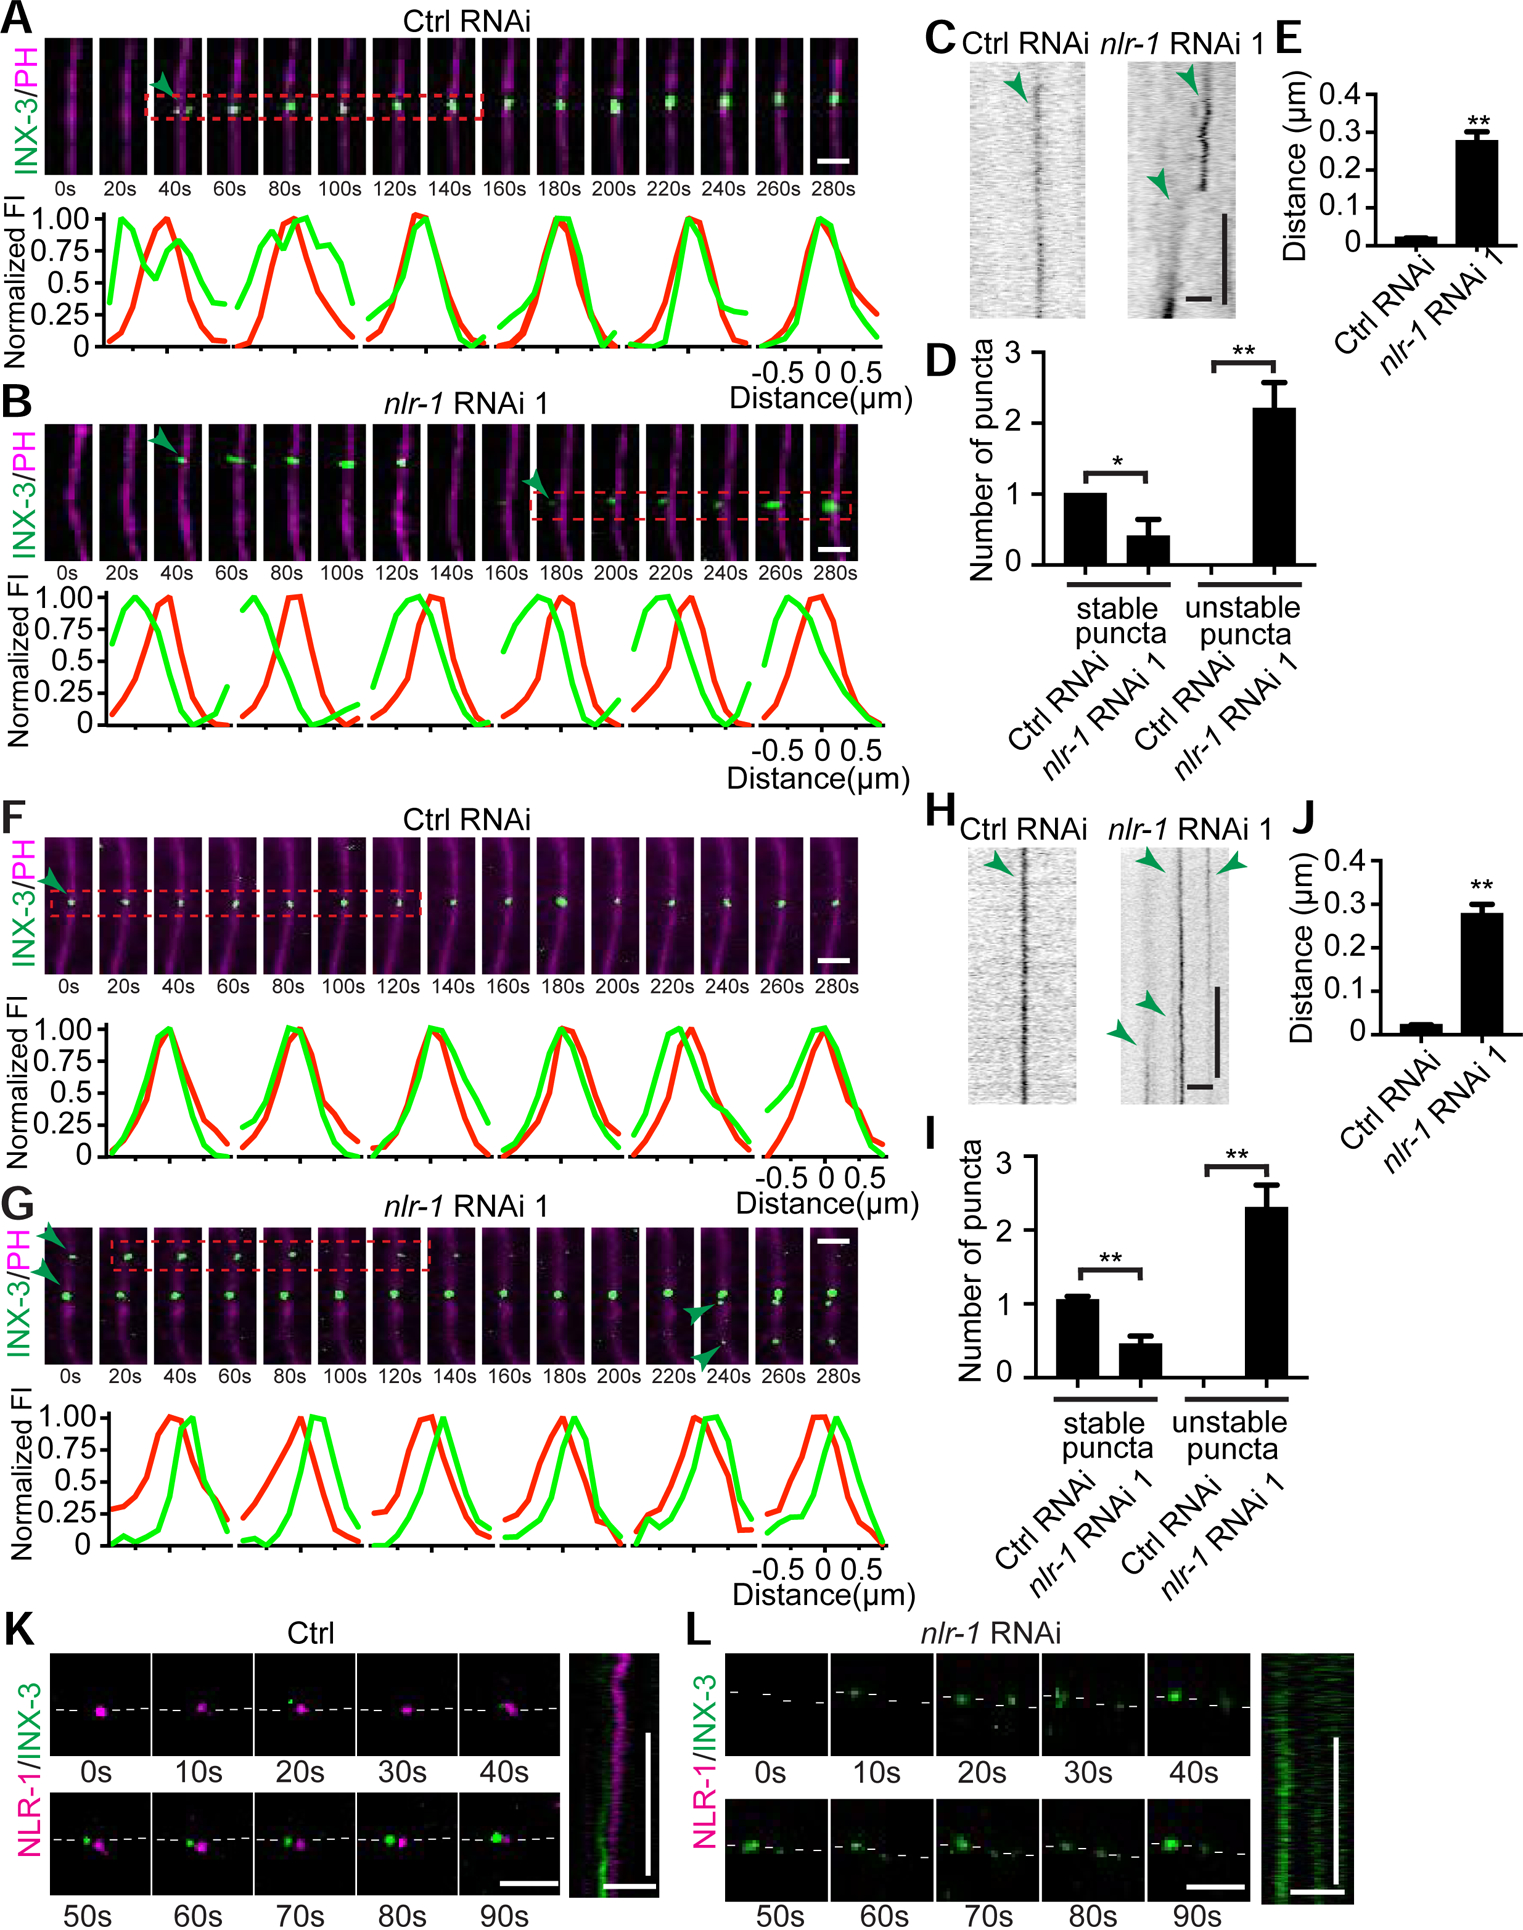
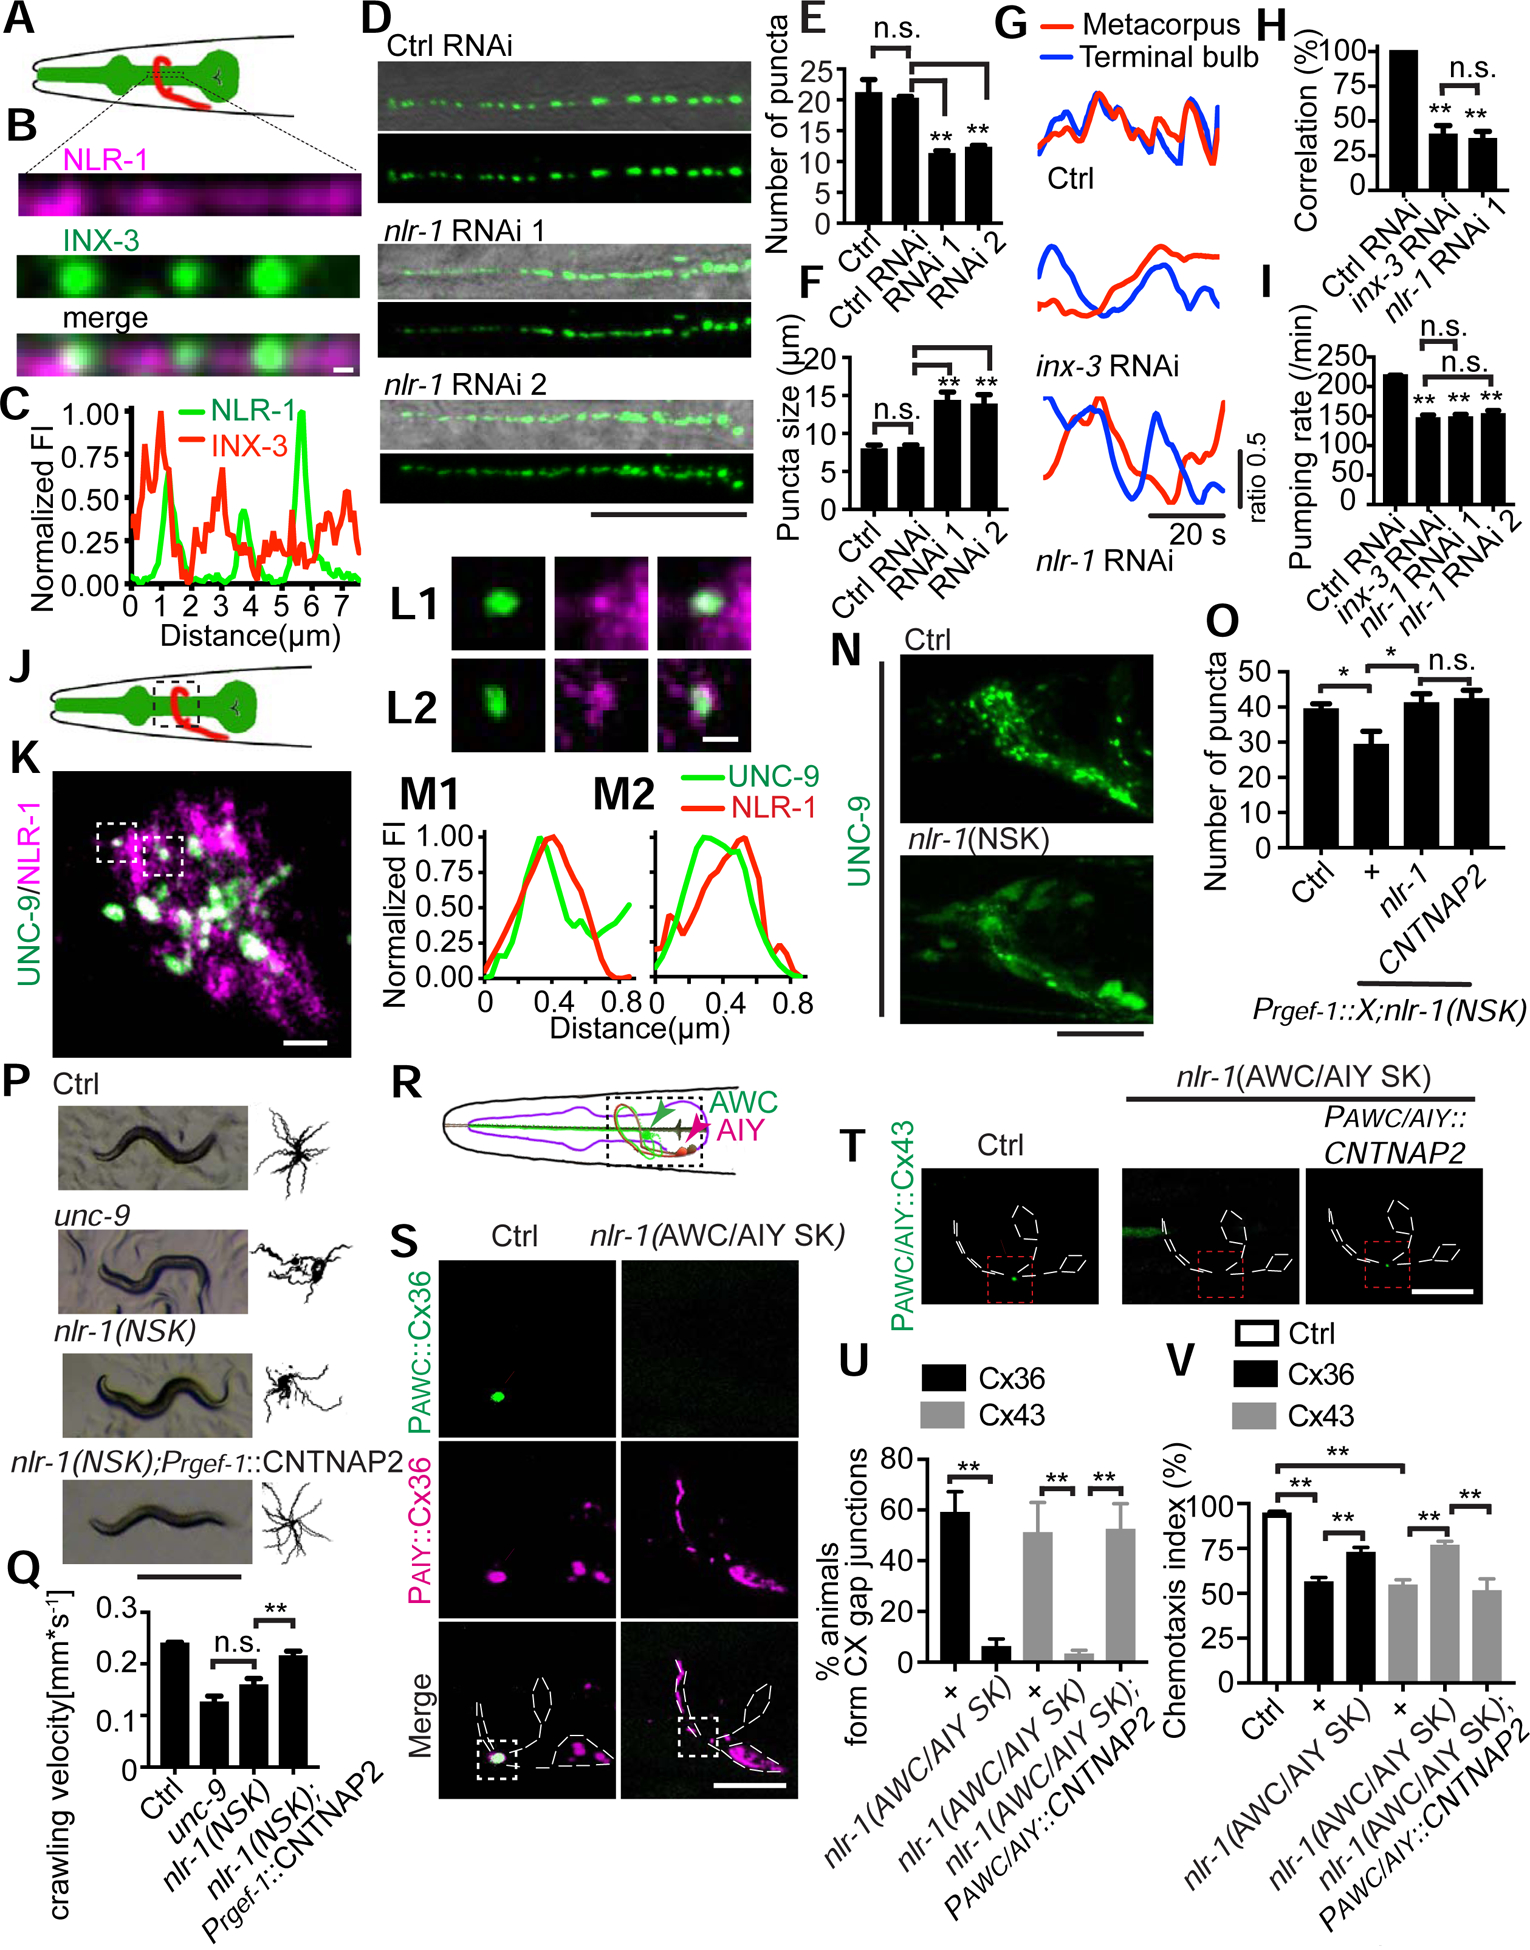
Gap junctions are present in most tissues and play essential roles in various biological processes. However, we know surprisingly little about the molecular mechanisms underlying gap junction formation. Here, we uncover the essential role of a conserved EGF- and laminin-G-domain-containing protein nlr-1/CASPR in the regulation of gap junction formation in multiple tissues across different developmental stages in C. elegans. NLR-1 is located in the gap junction perinexus, a region adjacent to but not overlapping with gap junctions, and forms puncta before the clusters of gap junction channels appear on the membrane. We show that NLR-1 can directly bind to actin to recruit F-actin networks at the gap junction formation plaque, and the formation of F-actin patches plays a critical role in the assembly of gap junction channels. Our findings demonstrate that nlr-1/CASPR acts as an early stage signal for gap junction formation through anchoring of F-actin networks.

Keywords: C. elegans; F-actin; Gap junction; contactin-associated protein.


Conflict of interest statement

Declaration of Interests The authors declare no competing interests.

Figures

Figure 1.
Figure 1.. EA and EP cells form a single gap junction plaque at the center of the adjoining membranes.
(A) A schematic of the 16–24 cell stage in C. elegans embryos. (B) Representative images of localization of INX-3::GFP at the 16–24 cell stage (Scale bar (left): 20 μm; Scale bar (right): 2 μm). Pleckstrin homology domain (PH domain) targeted mCherry was used to visualize the cell membrane. White contours outline the embryo. (C) Quantification of percentage of animals with 1, 2 or ≥3 INX-3::GFP puncta on the adjoining membranes of EA/EP cells. n≥ 85. (D) Potential models for EA/EP gap junction formation. (E) A representative image of INX-3::GFP localization on the adjoining EA/EP membranes with the white boxes showing the five regions of interest (ROI) for fluorescence intensity quantification (Scale bar: 1 μm). (F) Quantification of mean fluorescence intensity of the five ROI in 160 s. n=5 animals. (G) Representative images of INX-3::GFP localization on the adjoining EA/EP membranes during the early stages of gap junction formation (Scale bar: 1 μm). (H) Representative images of localization of INX-3::GFP on the adjoining EA/EP membranes in control and nlr-1 knockdown animals (Scale bar: 2 μm). (I) Quantification of percentage of animals with 1, 2 or ≥3 INX-3::GFP puncta on the adjoining membranes of EA/EP cells in control and nlr-1 knockdown animals. n≥85. Fisher’s exact test, **p < 0.005. (J, K) Quantification of average INX-3::GFP puncta number and normalized INX-3::GFP fluorescence intensity on the adjoining EA/EP membranes. n≥90. One-way ANOVA test; **p < 0.005, n.s: no significant difference.
Figure 2.
Figure 2.. nlr-1 is required for INX-3 plaque formation and maintenance in embryos.
(A-E) nlr-1 is required for EA/EP gap junction formation. (A, B) Representative time-lapse images of INX-3::GFP puncta and profiles of GFP and mCherry fluorescence intensities at the regions indicated (red rectangle) during gap junction formation in control and nlr-1 knockdown animals (Scale bars: 2 μm). The interval between each image is 20s. Green arrows point to INX-3::GFP puncta. (C) Representative kymographs showing the dynamic of INX-3::GFP puncta formation (Scale bars (horizontal): 2 μm; Scale bars (vertical): 20 sec). Green arrows point to INX-3::GFP traces. (D) Quantification of stable and unstable puncta in control and nlr-1 knockdown animals during gap junction formation. (E) Quantification of average distance between the crests of the INX-3::GFP and PH::mCherry intensity profiles. Each point represents 5 experiments of at least 200 events. Student’s t-test, *p < 0.05; **p < 0.005. (F-J) nlr-1 is required for EA/EP gap junction maintenance. (F, G) Representative time-lapse images of INX-3::GFP puncta and GFP and mCherry fluorescence intensity profiles at the regions indicated (red rectangle) after gap junction formation in control and nlr-1 knockdown animals (Scale bars: 2 μm). The interval between each image is 20s. Green arrows point to INX-3::GFP puncta. (H) Representative kymographs showing the dynamic of INX-3::GFP puncta (Scale bars (horizontal): 2 μm; Scale bars (vertical): 20 sec). Green arrows point to INX-3::GFP traces. (I) Quantification of stable and unstable puncta in control and nlr-1 knockdown animals after gap junction formation. (J) Quantification of average distance between the crests of the INX-3::GFP and PH::mCherry intensity profiles. Each point represents 5 experiments of at least 200 events. Student’s t-test, **p < 0.005. (K, L) Representative time-lapse images (Scale bar: 2 μm) and kymographs (Horizontal scale bars: 2 μm; Vertical scale bars: 20 sec) of endogenous NLR-1 and INX-3 in control and nlr-1 knockdown animals during INX-3 plaque formation. White dash lines outline the plasma membrane.
Figure 3.
Figure 3.. nlr-1 regulates gap junction formation and function in muscles and neurons.
(A) A schematic of pharyngeal muscles (green). The black rectangles highlight the region of interest at pharyngeal pm5 muscles. (B, C) Representative images and fluorescence intensity profiles of NLR-1 and INX-3 localization along the adjoining membranes of pharyngeal pm5 muscles (Scale bar: 1 μm). (D) Representative images of INX-3::GFP puncta localization along the adjoining membranes of pm5 muscles. Images at the top show a merge of DIC and GFP images, and images at the bottom show GFP only (Scale bar: 10 μm). (E, F) Quantification of average number, average size of INX-3::GFP puncta in control, control RNAi and nlr-1 knockdown animals. One-way ANOVA test, n≥90. **p < 0.005, n.s: no significant difference. (G, H) Representative images and quantification of correlation between calcium transients in the metacorpus and terminal bulbs in control, inx-3 knockdown and nlr-1 knockdown animals. n≥60. One-way ANOVA test, **p < 0.005, n.s: no significant difference. (I) Quantification of pumping rate in control RNAi, inx-3 knockdown and nlr-1 knockdown animals. n≥30. One-way ANOVA test, **p < 0.005, n.s: no significant difference. (J) A schematic of the nerve ring (red). The black rectangles highlight the region of interest at the nerve ring. (K-M) Representative images of NLR-1 and UNC-9 localization (Scale bar: 2 μm in (K), Scale bar: 1 μm in (L)) and fluorescence intensity profiles of NLR-1 and UNC-9. (N) Representative images of UNC-9::GFP puncta localization in control and nlr-1 neuronal conditional knockout animals (Scale bar: 20 μm). (O) Quantification of UNC-9::GFP puncta localization in control, nlr-1(NSK) and transgenic rescue animals. Pregf-1 was used as a pan-neuronal promoter. n≥30. One-way ANOVA test, *p < 0.05, n.s: no significant difference. (P) Representative images and trajectories (20 animals) of 30 s locomotion are shown for wild type, unc-9(lf), nlr-1(NSK), and CNTNAP2 rescue animals (Scale bar: 0.5 mm). (Q) Quantification of crawling velocity of wild type, unc-9(lf), nlr-1(NSK) and CNTNAP2 rescue animals. n≥80. One-way ANOVA test, **p < 0.005, n.s: no significant difference. (R) A schematic of AWC and AIY neurons. The black rectangles highlight the region of interest. (S) Representative images of AWC::Cx36::GFP;AIY::Cx36::mCherry in control and nlr-1 AWC/AIY specific knockout (AWC/AIY SK) animals (Scale bar: 5 μm). The white dashed lines outline the morphologies of AWC and AIY neurons. White arrowheads point to the Cx36-based gap junctions, which are localized at the contact region of AWC and AIY and are labeled by Cx36 from both AWC (green) and AIY (pink). Podr-1 and Pttx-3 were used as AWC and AIY specific promoters respectively. (T) Representative images of AWC::msfGFP; AIY::Cx43::msfGFP in control, nlr-1(AWC/AIY SK) and CNANAP2 rescue animals (Scale bar: 5 μm). The white dashed lines outline the morphologies of AWC and AIY neurons. White arrowheads point to the Cx43-based gap junctions, which are localized to the contact region between AWC and AIY. Podr-1 and Pttx-3 were used as AWC and AIY specific promoters respectively. (U) Percentage of animals with AWC/AIY gap junctions in control and nlr-1(AWC/AIY SK) conditions. n≥30. Student’s t-test, **p < 0.005. (V) Benzaldehyde chemotaxis behavior of wild type, connexin transgenic, connexin transgenic in nlr-1(AWC/AIY SK), and CNANAP2 rescue animals. n≥300. Student’s t-test, **p < 0.005.
Figure 4.
Figure 4.. F-actin is required for gap junction formation
(A, B) Representative images of localization of and percentage of animals with 1, 2 or ≥3 INX-3::GFP puncta on the adjoining EA/EP membranes in control, wve-1, gex-3, nlr-1, wve-1;nlr-1 and gex-3;nlr-1 knockdown animals (Scale bar: 2 μm). n≥80. Fisher’s exact test, **p < 0.005. (C) Quantification of average INX-3::GFP puncta number on the adjoining EA/EP membranes in control, gex-3, wve-1, nlr-1, gex-3;nlr-1 and wve-1;nlr-1 knockdown animals. n≥90. One-way ANOVA test, **p < 0.005. (D) Representative images of endogenous NLR-1 and INX-3 in control, gex-3 knockdown and wve-1 knockdown animals (Scale bar: 1 μm). (E, F) Representative images (E) and Quantification of puncta number (F) of UNC-9::GFP in control, nlr-1 (NSK), EX(gsnl-1(P40)) transgenes, and EX(gsnl-1(P40));nlr-1 (NSK) animals (Scale bar: 20 μm). n≥20. One-way ANOVA test, *p < 0.05.
Figure 5.
Figure 5.. NLR-1 interacts with actin to instruct gap junction formation
(A-F) INX-3 and NLR-1 bind to actin but not tubulin. Proteins were collected from transgenes expressing GFP, INX-3::GFP (A, B); FLAG, NLR-1::FLAG, ΔNLR-1(C-terminal deletion)::FLAG (C); mNG, NLR-1::mNG (D); GFP;NLR-1::mNG, INX-3::GFP;NLR-1::mNG (E), and mNG;INX-3::GFP, INX-3::GFP;NLR-1::mNG (F) and then subjected to immunoprecipitation (IP) assays using specific antibody-coated beads as indicated. Western blots were done using antibodies presented at the right side of the images. (G-I) nlr-1 is required for F-actin to localize at the gap junction region. Representative images and fluorescence intensity profile along the EA/EP membrane of NLR-1::GFP and UtrCH::mCherry in control embryos (G), and INX-3::GFP and UtrCH::mCherry in control and nlr-1 knockdown animals (H) (Scale bar: 1 μm). (I) Percentage of UtrCh::mCherry fluorescence signal at the center of the EA/EP adjoining membrane. We evenly divided the EA/EP membrane into three sections, and the “center” was defined as the middle section. n≥20. Student’s t-test, **p < 0.005. (J, K) Representative images and quantification of UNC-9::GFP puncta in transgenes expressing either nlr-1::FLAG or Δ nlr-1(C-terminal deletion)::FLAG under the pan-neuronal Prgef-1 promoter in nlr-1 (NSK) animals (Scale bar: 20 μm). n≥20, One-way ANOVA test; *p < 0.05.

References

    1. Albertson DG, and Thomson JN (1976). The pharynx of Caenorhabditis elegans. Philos Trans R Soc Lond B Biol Sci 275, 299–325. - PubMed
    1. Alexopoulos H, Bottger A, Fischer S, Levin A, Wolf A, Fujisawa T, Hayakawa S, Gojobori T, Davies JA, David CN, et al. (2004). Evolution of gap junctions: the missing link? Current biology : CB 14, R879–880. - PubMed
    1. Altun ZF, Chen B, Wang ZW, and Hall DH (2009). High resolution map of Caenorhabditis elegans gap junction proteins. Dev Dyn 238, 1936–1950. - PMC - PubMed
    1. Bauer R, Loer B, Ostrowski K, Martini J, Weimbs A, Lechner H, and Hoch M (2005). Intercellular communication: the Drosophila innexin multiprotein family of gap junction proteins. Chemistry & biology 12, 515–526. - PubMed
    1. Bauer R, Weimbs A, Lechner H, and Hoch M (2006). DE-cadherin, a core component of the adherens junction complex modifies subcellular localization of the Drosophila gap junction protein innexin2. Cell communication & adhesion 13, 103–114. - PubMed

Publication types

MeSH terms