. 2021 Jan 7;81(1):166-182.e6.
doi: 10.1016/j.molcel.2020.10.038. Epub 2020 Nov 24.

Distinct Structures and Dynamics of Chromatosomes with Different Human Linker Histone Isoforms

Affiliations

Distinct Structures and Dynamics of Chromatosomes with Different Human Linker Histone Isoforms

Bing-Rui Zhou et al. Mol Cell. .

Abstract

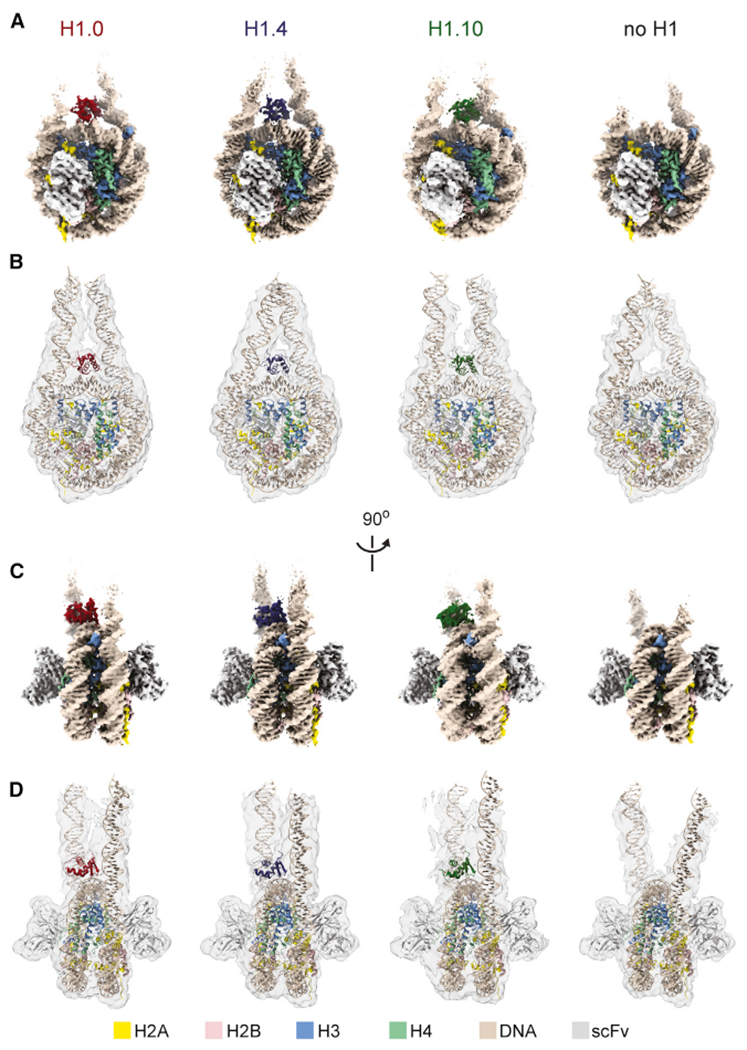
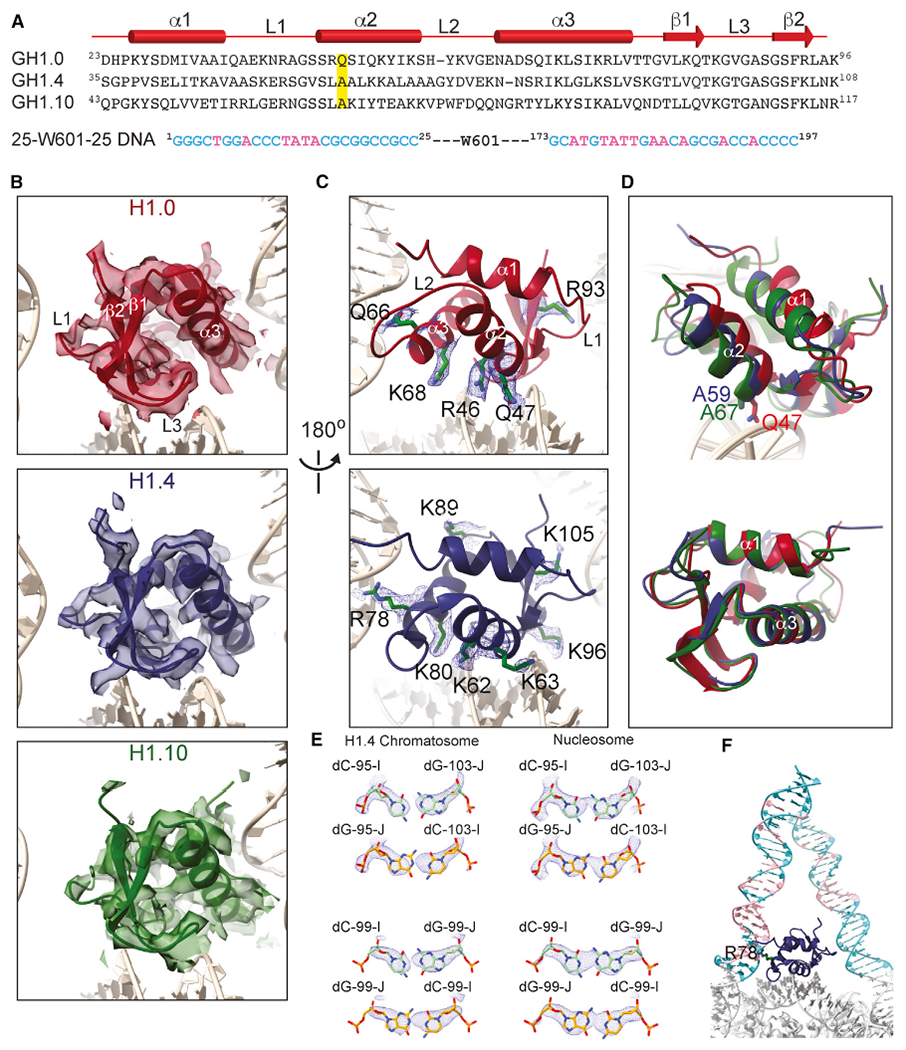
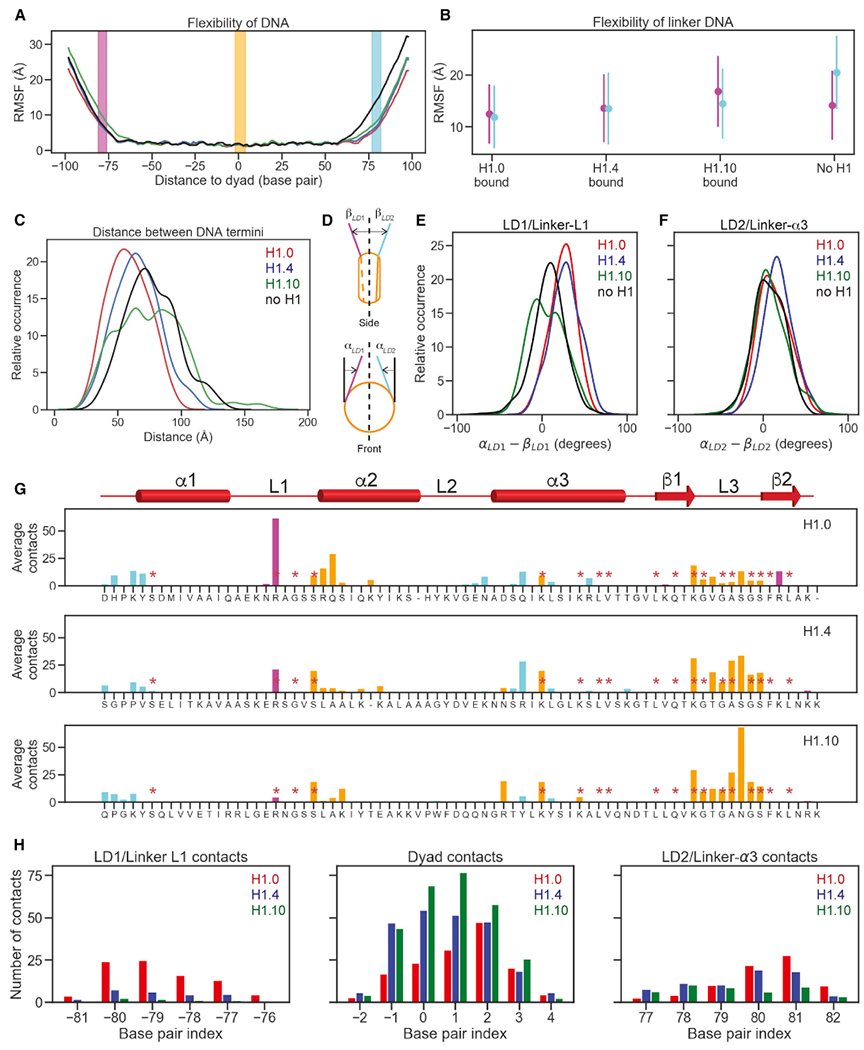
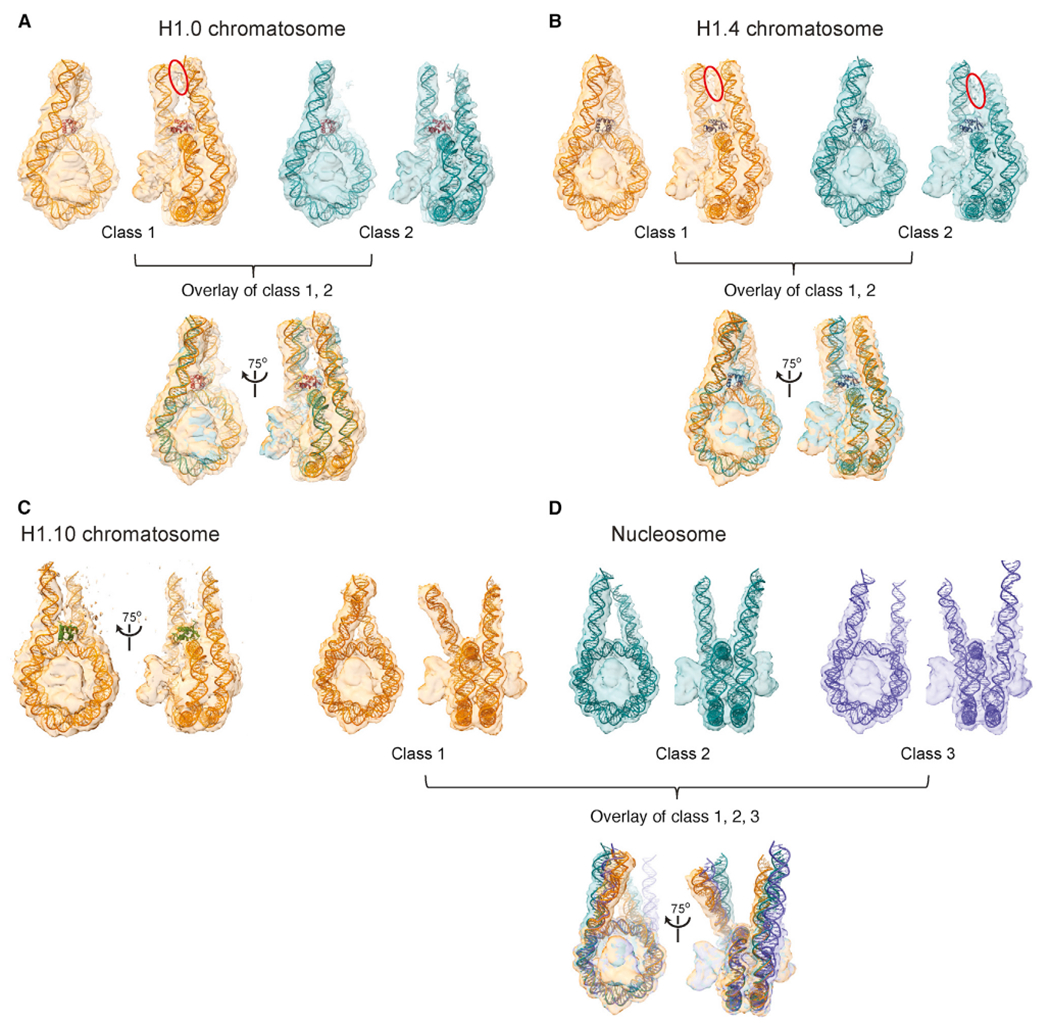
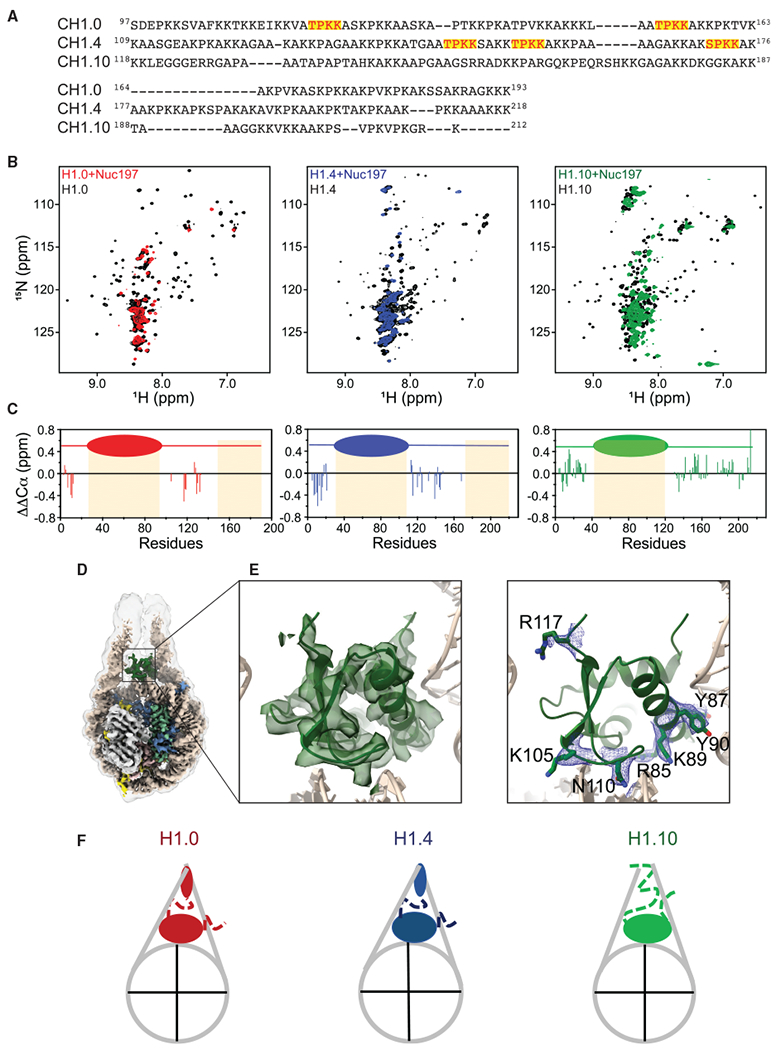
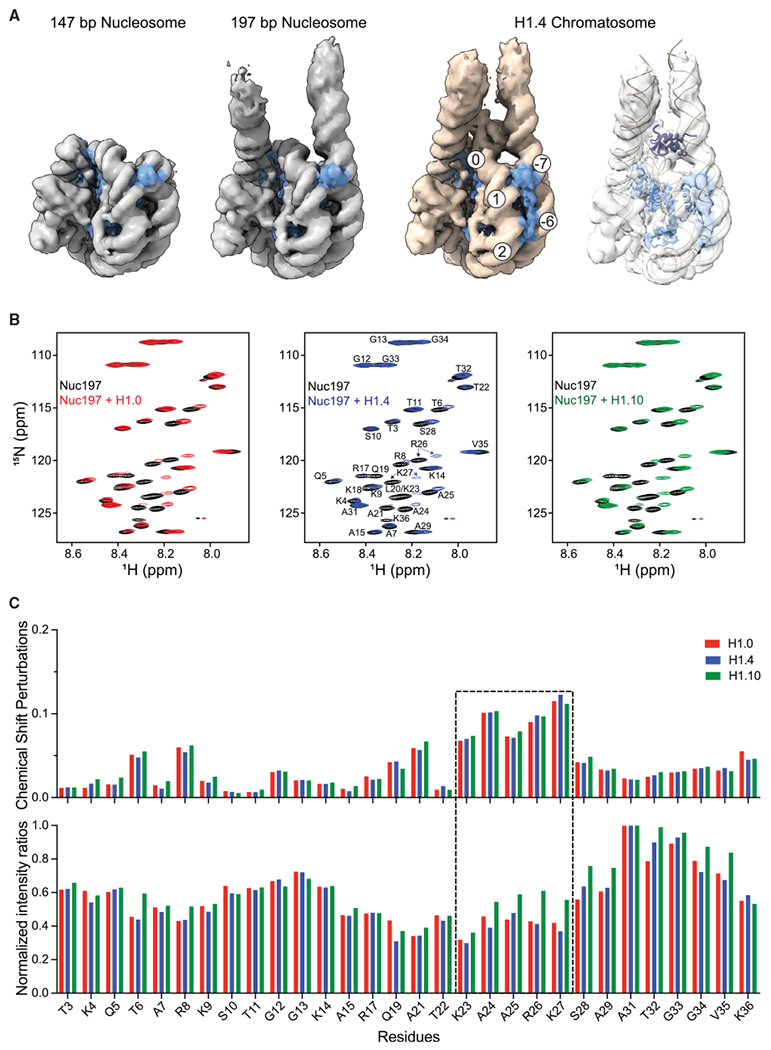
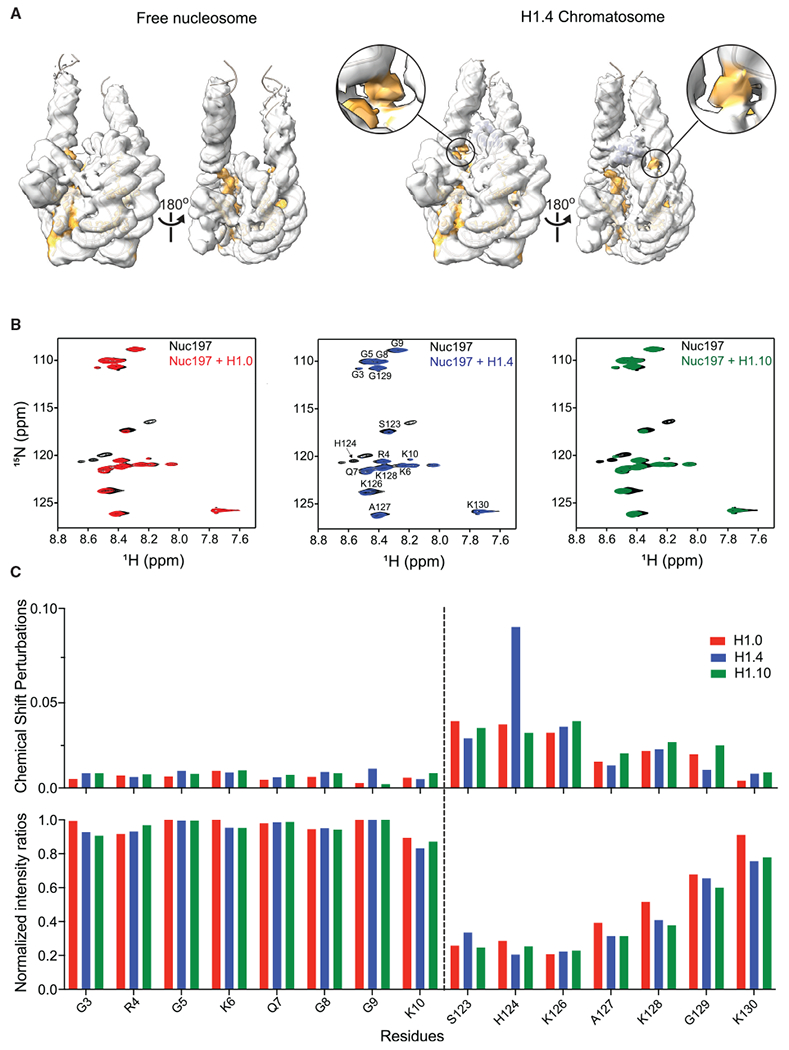
The repeating structural unit of metazoan chromatin is the chromatosome, a nucleosome bound to a linker histone, H1. There are 11 human H1 isoforms with diverse cellular functions, but how they interact with the nucleosome remains elusive. Here, we determined the cryoelectron microscopy (cryo-EM) structures of chromatosomes containing 197 bp DNA and three different human H1 isoforms, respectively. The globular domains of all three H1 isoforms bound to the nucleosome dyad. However, the flanking/linker DNAs displayed substantial distinct dynamic conformations. Nuclear magnetic resonance (NMR) and H1 tail-swapping cryo-EM experiments revealed that the C-terminal tails of the H1 isoforms mainly controlled the flanking DNA orientations. We also observed partial ordering of the core histone H2A C-terminal and H3 N-terminal tails in the chromatosomes. Our results provide insights into the structures and dynamics of the chromatosomes and have implications for the structure and function of chromatin.

Keywords: Cryo-EM; NMR; chromatin structure; chromatosome; chromatosome dynamics; chromatosome structure; linker histone isoform; linker histone tail; nucleosome; single-chain antibody.


Conflict of interest statement

Declaration of Interests The authors declare no competing interests.

Figures

Figure 1.
Figure 1.. Overall Density Maps and Structural Models
(A) Top views of the cryo-EM reconstructions of the H1.0, H1.4, and H1.10 chromatosomes and the free nucleosome. (B) Top views of the low-pass-filtered (6 Å) density maps (transparent surfaces) as in (A) and corresponding atomic structural models. (C) Side views as in (A). (D) Side views as in (B). See also Figures S1 and S2.
Figure 2.
Figure 2.. Interactions between the Globular Domains and DNA
(A) Sequences of the globular domains of H1.0, H1.4, H1.10, and linker DNA. The diagram on the top shows the secondary structures. The residue Gln47 in H1.0 and corresponding Ala residues in H1.4 and H1.10, which are highlighted, interact with dyad DNA. (B) Density maps (transparent surfaces) and cartoon structure models of the globular domains. (C) Densities of the amino acid side chains of the globular domains that interact with the nucleosomal and linker DNAs. (D) Illustration of the difference of the orientation of the globular domain of H1.0 relative to those of H1.4 and H1.10 in the chromatosomes and the residues that are likely responsible for the difference. Structures of the chromatosomes were aligned on core histones in the top panel. The bottom panel showed the alignment of the globular domain structures alone. (E) Illustration of DNA orientation determination in the H1.4 chromatosome by the fitting of cryo-EM densities with DC-95:DG-103 and DC-99:DG-99 pairs in one direction (carbon colored in green), which do not fit when the orientation of the DNA is reversed (carbon colored in gold) (left). In contrast, in the case of free nucleosome, the corresponding cryo-EM densities represent the average of the two positions from opposite DNA orientations (right). (F) The AT-rich base pair region (pink color) in the linker/flanking DNA is bound by the α3 helix through residues Arg78 of H1.4. See also Figures S1 and S2.
Figure 3.
Figure 3.. MD of the Chromatosomes
(A) Flexibility of DNA in the H1.0 (red), H1.4 (blue), H1.10 (green) chromatosomes, and free nucleosome (black) were illustrated via phosphate atom RMSFs over full molecular dynamics (MD) trajectories. Base pairs that contact globular domains are shown by DNA region: linker DNA 1 (LD1)/linker-L1 (magenta), dyad (orange), and linker DNA 2 (LD2)/linker-α3 (cyan). All panels follow this color convention. The dyad is numbered as 0. (B) Mean and standard deviations of DNA RMSF averaged over base pairs. (C) Distribution of distances between the two terminal base pairs of DNA. (D) Cartoon illustrating the definition of linker strand opening angles, αLD1 and αLD2 for in-nucleosomal-plane motion (top), and βLD1 and βLD2 for out-of-nucleosomal-plane motion. (E) Distributions of differences of linker strand angles, α and β for LD1/linker-L1. Higher values point to more compact structures. (F) Distributions of differences of linker strand angles, α and β for LD2/ linker-α3. Higher values point to more compact structures (G) The number of heavy-atom contacts between the globular domain and DNA averaged over MD trajectories. Residues conserved across all three H1 variants are annotated with red asterisks. Residues in contacts with LD1/linker-L1, dyad region, and LD2/linker-α3 are shown in purple, orange, and cyan, respectively. (H) Average numbers of heavy-atom contacts for three DNA regions. See also Figure S3.
Figure 4.
Figure 4.. Multiple Conformations and Interactions of Linker DNA
(A) 3D classification of the H1.0 chromatosome. The blue circle highlights the observation of densities between the two linker DNA. (B) 3D classification of the H1.4 chromatosome. The blue circles highlight the observation of densities between the two linker DNA. (C) The major class of the H1.10 chromatosome. (D) 3D classification of the free nucleosome. See also Figure S4.
Figure 5.
Figure 5.. Linker Histone Tails Control Linker DNA Orientation
(A) Amino acid sequence alignment of the C-terminal tails of H1.0, H1.4, and H1.10. The S/TPKK motifs are highlighted in red with a yellow background. (B) 1H-15N HSQC spectra of the H1 isoforms in the chromatosomes and the free form. (C) Deviation of Cα chemical shifts from random coil values (ΔΔCα). (D) Cryo-EM reconstruction of the gH1.10-ncH1.4 chromatosome. Low-pass-filtered (6 Å) cryo-EM density is shown with a transparent gray surface. (E) Cryo-EM density fitted with the globular domain structural model. Density of the amino acid side chains of the globular domain that interact with the DNA. (F) Cartoons of chromatosomes showing differences in linker DNA and H1 tails. See also Figure S5.
Figure 6.
Figure 6.. Effects of Linker Histone Binding on the Conformation of H3 Tails
(A) Comparison of cryo-EM densities of the free nucleosome and the H1.4 chromatosome. The 147-bp nucleosome density map is from EMD-8938. All maps were low-pass filtered to 6 Å. The density maps were plotted at same intensity levels for core histones. H3 model and densities are zone colored in light blue. Extra densities between the two DNA gyres are colored in light blue, which is connected the H3 N-helix density. Numbers in the circles show the super-helical locations. (B) 1H-15N spectra of H3 tails in the chromatosomes and free nucleosome. (C) Chemical shift perturbations (upper panel) and NMR peak intensity changes (lower panel) for the residues in the H3 N-tails upon addition of H1. See also Figure S6.
Figure 7.
Figure 7.. Effects of Linker Histone Binding on the Conformation of H2A Tails
(A) Comparison of the cryo-EM densities of the free nucleosome and the H1.4 chromatosome. All maps are low-pass filtered to 6 Å. The density maps were plotted at the same intensity levels for core histones. H2A model and density are zone colored in orange. Extra density is also colored in orange, which is closed to one of H2A C-terminal structured region. (B) 1H-15N spectra of H2A tails in the chromatosomes and free nucleosome. The dashed lines separate the N-terminal (left) and C-terminal (right) tail regions. (C) Chemical shift perturbations (upper panel) and NMR peak intensity changes (lower panel) for the residues in the H2A tails upon addition of H1. See also Figure S6.

References

    1. Adams PD, Afonine PV, Bunkóczi G, Chen VB, Davis IW, Echols N, Headd JJ, Hung LW, Kapral GJ, Grosse-Kunstleve RW, et al. (2010). PHENIX: a comprehensive Python-based system for macromolecular structure solution. Acta Crystallogr. D Biol. Crystallogr 66, 213–221. - PMC - PubMed
    1. Allan J, Hartman PG, Crane-Robinson C, and Aviles FX (1980). The structure of histone H1 and its location in chromatin. Nature 288, 675–679. - PubMed
    1. Allan J, Mitchell T, Harborne N, Bohm L, and Crane-Robinson C (1986). Roles of H1 domains in determining higher order chromatin structure and H1 location. J. Mol. Biol 187, 591–601. - PubMed
    1. Arents G, Burlingame RW, Wang BC, Love WE, and Moudrianakis EN (1991). The nucleosomal core histone octamer at 3.1 A resolution: a tripartite protein assembly and a left-handed superhelix. Proc. Natl. Acad. Sci. USA 88, 10148–10152. - PMC - PubMed
    1. Arimura Y, Ikura M, Fujita R, Noda M, Kobayashi W, Horikoshi N, Sun J, Shi L, Kusakabe M, Harata M, et al. (2018). Cancer-associated mutations of histones H2B, H3.1 and H2A.Z.1 affect the structure and stability of the nucleosome. Nucleic Acids Res. 46, 10007–10018. - PMC - PubMed

Publication types