. 2020 Nov 23;12(11):1128.
doi: 10.3390/pharmaceutics12111128.

Oxoglutarate Carrier Inhibition Reduced Melanoma Growth and Invasion by Reducing ATP Production

Affiliations

Oxoglutarate Carrier Inhibition Reduced Melanoma Growth and Invasion by Reducing ATP Production

Jae-Seon Lee et al. Pharmaceutics. .

Abstract

Recent findings indicate that (a) mitochondria in proliferating cancer cells are functional, (b) cancer cells use more oxygen than normal cells for oxidative phosphorylation, and (c) cancer cells critically rely on cytosolic NADH transported into mitochondria via the malate-aspartate shuttle (MAS) for ATP production. In a spontaneous lung cancer model, tumor growth was reduced by 50% in heterozygous oxoglutarate carrier (OGC) knock-out mice compared with wild-type counterparts. To determine the mechanism through which OGC promotes tumor growth, the effects of the OGC inhibitor N-phenylmaleimide (NPM) on mitochondrial activity, oxygen consumption, and ATP production were evaluated in melanoma cell lines. NPM suppressed oxygen consumption and decreased ATP production in melanoma cells in a dose-dependent manner. NPM also reduced the proliferation of melanoma cells. To test the effects of NPM on tumor growth and metastasis in vivo, NPM was administered in a human melanoma xenograft model. NPM reduced tumor growth by approximately 50% and reduced melanoma invasion by 70% at a dose of 20 mg/kg. Therefore, blocking OGC activity may be a useful approach for cancer therapy.

Keywords: ATP production; cancer metabolism; malate-aspartate shuttle; oxoglutarate carrier.


Conflict of interest statement

The authors declare no conflict of interest.

Figures

Figure 1
Figure 1
Important binding interactions for the docked conformations of NPM using the OGC homology model. (A) The MAS for NADH transport into the mitochondrial matrix. NPM, N-phenylmaleimide; OGC, oxoglutarate carrier; AGC1, aspartate-glutamate carrier isoform 1; OAA, oxaloacetate; α-KG, α-ketoglutarate. (B) The binding site in the OGC model is shown as a light orange ribbon; NPM is shown in green in a stick-ball structure. (C) Detailed interactions between NPM and OGC are shown with a stick model, and residues involved in the interaction with NPM are presented in the stick-ball style colored by atom type (C, cyan; N, blue; O, red). H-bonds are indicated by red dashed lines. (D) Close-up left-hand view of the predicted binding of NPM to OGC. The ligand is depicted in the stick-ball style. Figures were drawn in Maestro (Schrödinger, LLC, New York, NY, USA, 2020).
Figure 2
Figure 2
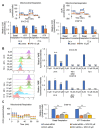
NPM reduced ATP production by decreasing the OCR and the mitochondrial membrane potential. (A) OCR was measured in UACC-62 and B16F10 cells treated with 10 µM of NPM for 24 h and 72 h using a Seahorse XFe96 analyzer. (B) The mitochondrial membrane potential was determined by tetramethylrodamine ester (TMRE) staining in UACC-62 and B16F10 cells treated with 10 or 20 µM of NPM for the indicated times. (C) The OCR and ATP production were analyzed by Seahorse XF analyzer after treatment of wild-type or OGC knock-down B16F10 cells with 20 µM of NPM for 24 h. Data represent the mean and standard deviation of three independent experiments. * p < 0.05, ** p < 0.01, and *** p < 0.001 compared with the vehicle control.
Figure 3
Figure 3
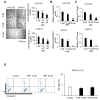
Cancer cell proliferation was regulated by NPM. (A) Cancer cell proliferation was determined by SRB assay in UACC-62 and B16F10 TSs treated with the indicated concentration of NPM for 72 h. (B) The NADH/NAD+ ratio was measured in UACC-62 and B16F10 cells treated with the indicated concentration of NPM for 72 h. (C) The ATP level was measured using luminescent ATP assay kit in UACC-62 and B16F10 cells following to the treatment of NPM for 72 h. (D) Cell death was determined by annexin V and propidium iodide (PI) staining in B16F10 cells treated with 10 and 20 µM NPM for 72 h. Data represent the mean and standard deviation of three independent experiments. * p < 0.05, ** p < 0.01, and *** p < 0.001 compared with the vehicle control.
Figure 4
Figure 4
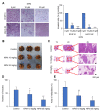
Tumor growth in a melanoma xenograft model was inhibited by NPM treatment. (A) The graph represents the tumor growth, as measured using calipers. (B) The weight of subcutaneous UACC-62 tumors from mice with or without NPM treatment. (C) Representative images of the removed tumors. (D) Immunohistochemical analysis of Ki-67 in UACC-62 xenografts from mice with or without NPM treatment. Quantification was measured by positive cell counting using Image J. Data represent the mean and standard deviation of three independent experiments. * p < 0.05 and ** p < 0.01 compared with the vehicle control. KI-67 positive cell was checked by arrow.
Figure 5
Figure 5
NPM reduces lung metastasis of B16F10 melanoma cells in immunocompetent mice. (A) Invasion assay performed with B16F10 and UACC-62 cell lines following NPM treatment for 16 h. Representative images of the invasion assay using B16F10 and UACC-62 cells (left). The numbers of invasive B16F10 and UACC-62 cells were measured using ImageJ (right). (B) Representative photographs of formalin-fixed lungs. (C) Metastatic lesions were observed with hematoxylin and eosin (H&E) staining. (D) Statistical analysis of the number of metastatic nodules. (E) Statistical analysis of the total metastatic area using ImageJ. Data represent the mean and standard deviation of three independent experiments. * p < 0.05, ** p < 0.01, and *** p < 0.001 compared with the vehicle control.

References

    1. Lee J.S., Lee H., Lee S., Kang J.H., Lee S.H., Kim S.G., Cho E.S., Kim N.H., Yook J.I., Kim S.Y. Loss of SLC25A11 causes suppression of NSCLC and melanoma tumor formation. EBioMedicine. 2019;40:184–197. doi: 10.1016/j.ebiom.2019.01.036. - DOI - PMC - PubMed
    1. Lee J.S., Oh S.J., Choi H.J., Kang J.H., Lee S.H., Ha J.S., Woo S.M., Jang H., Lee H., Kim S.Y. ATP Production Relies on Fatty Acid Oxidation Rather than Glycolysis in Pancreatic Ductal Adenocarcinoma. Cancers. 2020;12:2477. doi: 10.3390/cancers12092477. - DOI - PMC - PubMed
    1. Kim S.Y. Cancer Energy Metabolism: Shutting Power off Cancer Factory. Biomol. Ther. (Seoul) 2018;26:39–44. doi: 10.4062/biomolther.2017.184. - DOI - PMC - PubMed
    1. Greenhouse W.V., Lehninger A.L. Occurrence of the malate-aspartate shuttle in various tumor types. Cancer Res. 1976;36:1392–1396. - PubMed
    1. Kang J.H., Lee S.H., Hong D., Lee J.S., Ahn H.S., Ahn J.H., Seong T.W., Lee C.H., Jang H., Hong K.M., et al. Aldehyde dehydrogenase is used by cancer cells for energy metabolism. Exp. Mol. Med. 2016;48:e272. doi: 10.1038/emm.2016.103. - DOI - PMC - PubMed

LinkOut - more resources