No Change in Medial Olivocochlear Efferent Activity during an Auditory or Visual Task: Dual Evidence from Otoacoustic Emissions and Event-Related Potentials
- PMID: 33238438
- PMCID: PMC7700184
- DOI: 10.3390/brainsci10110894
No Change in Medial Olivocochlear Efferent Activity during an Auditory or Visual Task: Dual Evidence from Otoacoustic Emissions and Event-Related Potentials
Abstract
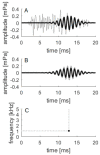
The medial olivocochlear (MOC) system is thought to be responsible for modulation of peripheral hearing through descending (efferent) pathways. This study investigated the connection between peripheral hearing function and conscious attention during two different modality tasks, auditory and visual. Peripheral hearing function was evaluated by analyzing the amount of suppression of otoacoustic emissions (OAEs) by contralateral acoustic stimulation (CAS), a well-known effect of the MOC. Simultaneously, attention was evaluated by event-related potentials (ERPs). Although the ERPs showed clear differences in processing of auditory and visual tasks, there were no differences in the levels of OAE suppression. We also analyzed OAEs for the highest magnitude resonant mode signal detected by the matching pursuit method, but again did not find a significant effect of task, and no difference in noise level or number of rejected trials. However, for auditory tasks, the amplitude of the P3 cognitive wave negatively correlated with the level of OAE suppression. We conclude that there seems to be no change in MOC function when performing different modality tasks, although the cortex still remains able to modulate some aspects of MOC activity.
Keywords: EEG; P3; attention; contralateral acoustic stimulation; event-related potentials; medial olivocochlear efferent system; otoacoustic emissions.
Conflict of interest statement
The authors declare no conflict of interest.
Figures


Similar articles
-
Easy and Hard Auditory Tasks Distinguished by Otoacoustic Emissions and Event-related Potentials: Insights into Efferent System Activity.Neuroscience. 2022 May 21;491:87-97. doi: 10.1016/j.neuroscience.2022.03.029. Epub 2022 Apr 6. Neuroscience. 2022. PMID: 35398177
-
Olivocochlear Efferent Activity Is Associated With the Slope of the Psychometric Function of Speech Recognition in Noise.Ear Hear. 2018 May/Jun;39(3):583-593. doi: 10.1097/AUD.0000000000000514. Ear Hear. 2018. PMID: 29135685 Free PMC article.
-
Investigating Influences of Medial Olivocochlear Efferent System on Central Auditory Processing and Listening in Noise: A Behavioral and Event-Related Potential Study.Brain Sci. 2020 Jul 4;10(7):428. doi: 10.3390/brainsci10070428. Brain Sci. 2020. PMID: 32635442 Free PMC article.
-
Olivocochlear efferents: anatomy, physiology, function, and the measurement of efferent effects in humans.Ear Hear. 2006 Dec;27(6):589-607. doi: 10.1097/01.aud.0000240507.83072.e7. Ear Hear. 2006. PMID: 17086072 Review.
-
Olivocochlear efferents: Their action, effects, measurement and uses, and the impact of the new conception of cochlear mechanical responses.Hear Res. 2018 May;362:38-47. doi: 10.1016/j.heares.2017.12.012. Epub 2017 Dec 21. Hear Res. 2018. PMID: 29291948 Free PMC article. Review.
Cited by
-
Fluctuations of Otoacoustic Emissions and Medial Olivocochlear Reflexes: Tracking One Subject over a Year.Audiol Res. 2022 Sep 14;12(5):508-517. doi: 10.3390/audiolres12050051. Audiol Res. 2022. PMID: 36136858 Free PMC article.
-
Auditory efferent suppression during alternate auditory attention in schizophrenia patients with auditory hallucinations.Sci Rep. 2025 Mar 20;15(1):9662. doi: 10.1038/s41598-025-94412-4. Sci Rep. 2025. PMID: 40113860 Free PMC article.
-
Rapid Enhancement of Subcortical Neural Responses to Sine-Wave Speech.Front Neurosci. 2021 Dec 20;15:747303. doi: 10.3389/fnins.2021.747303. eCollection 2021. Front Neurosci. 2021. PMID: 34987356 Free PMC article.
-
The Reliability of Contralateral Suppression of Otoacoustic Emissions Is Greater in Women than in Men.Audiol Res. 2022 Jan 19;12(1):79-86. doi: 10.3390/audiolres12010008. Audiol Res. 2022. PMID: 35200258 Free PMC article.
References
Grants and funding
LinkOut - more resources
Full Text Sources

