. 2020 Nov 25;12(571):eaay4145.
doi: 10.1126/scitranslmed.aay4145.

PAPPA-mediated adipose tissue remodeling mitigates insulin resistance and protects against gestational diabetes in mice and humans

Affiliations

PAPPA-mediated adipose tissue remodeling mitigates insulin resistance and protects against gestational diabetes in mice and humans

Raziel Rojas-Rodriguez et al. Sci Transl Med. .

Abstract

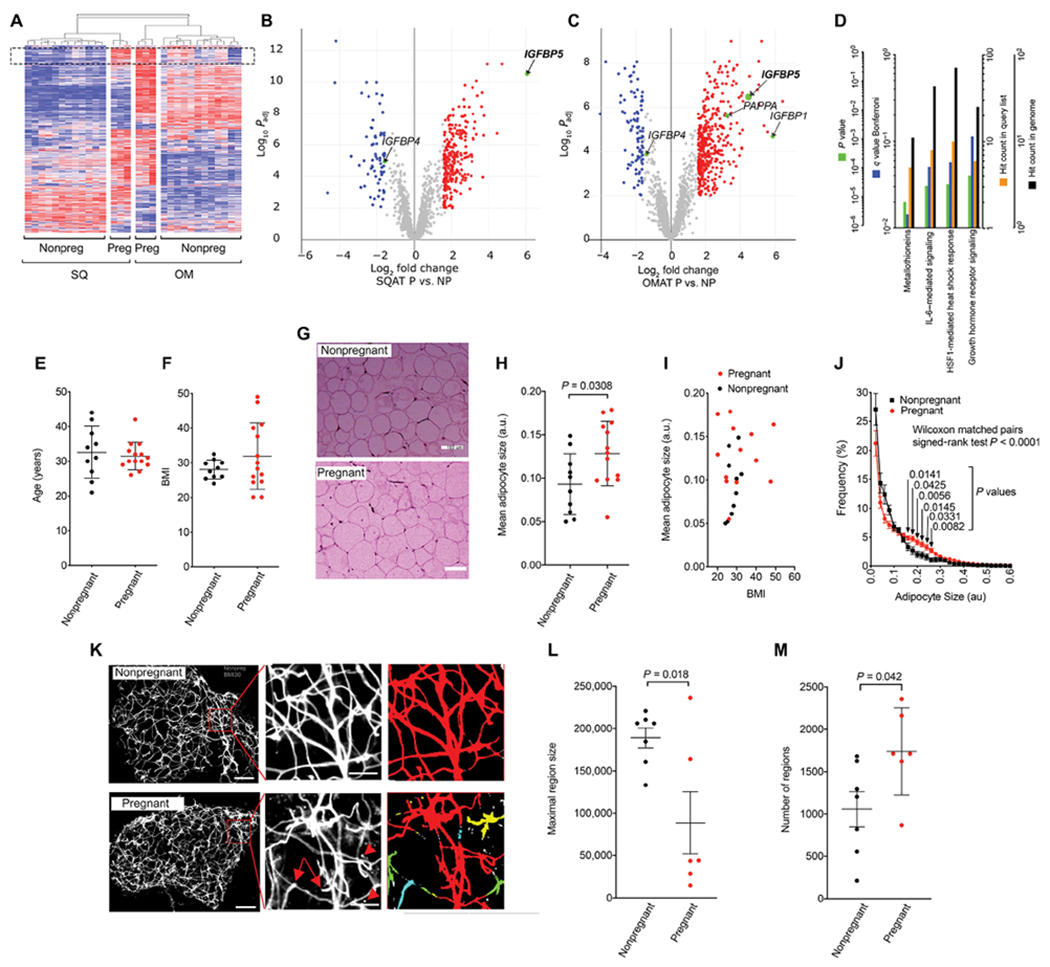
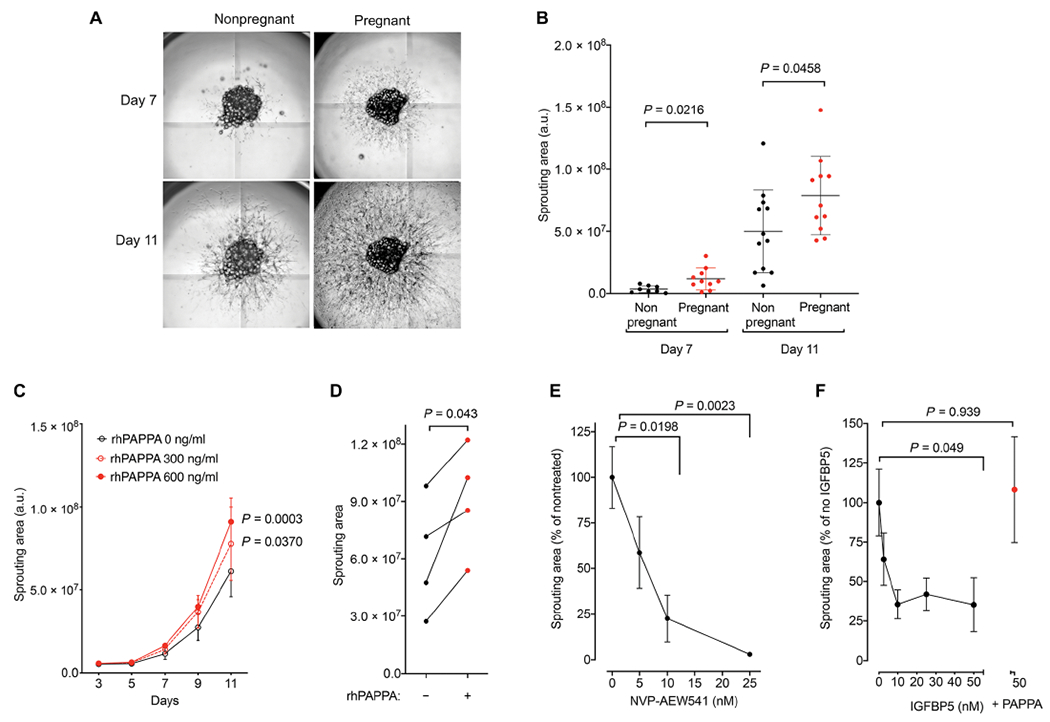
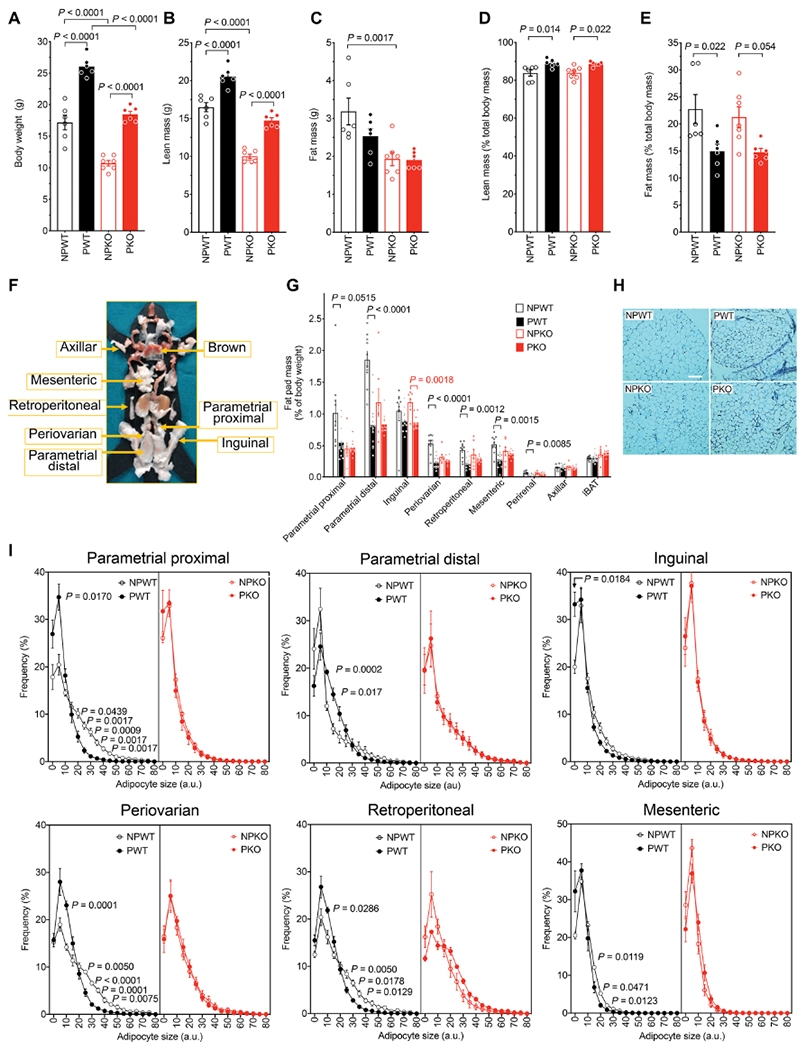
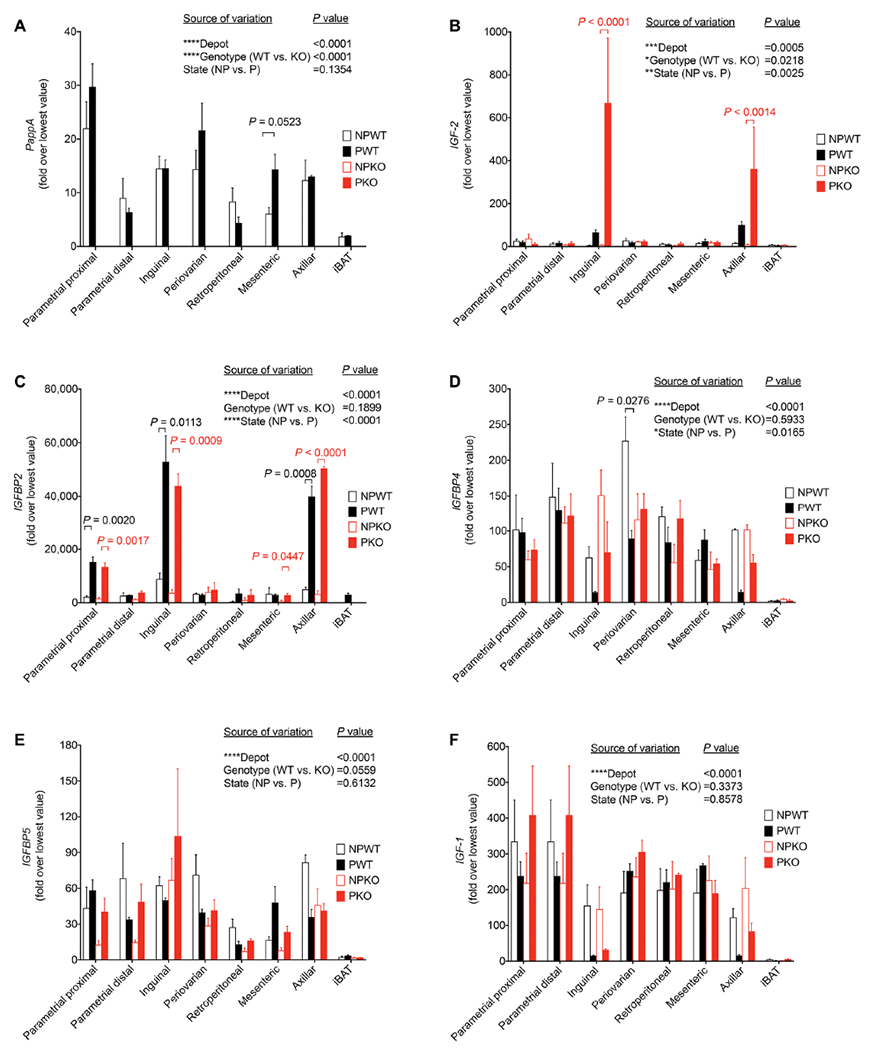
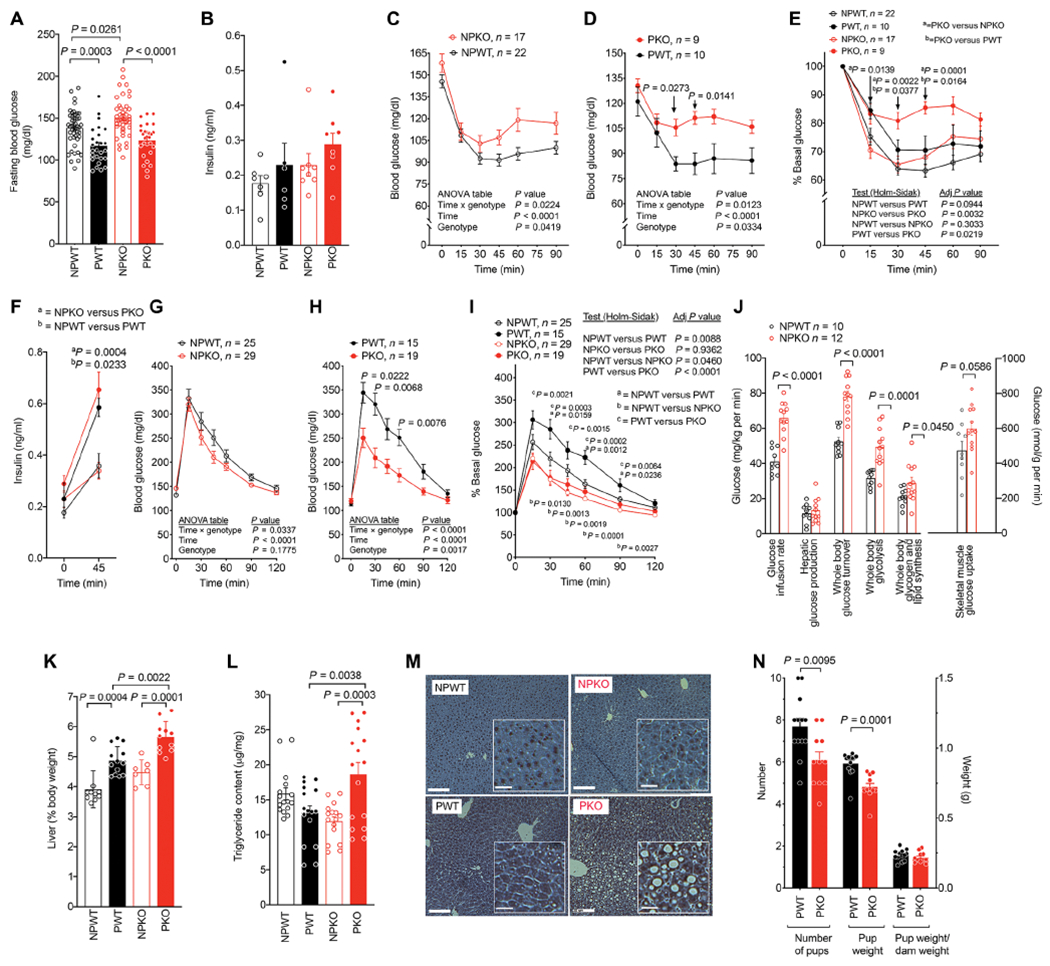
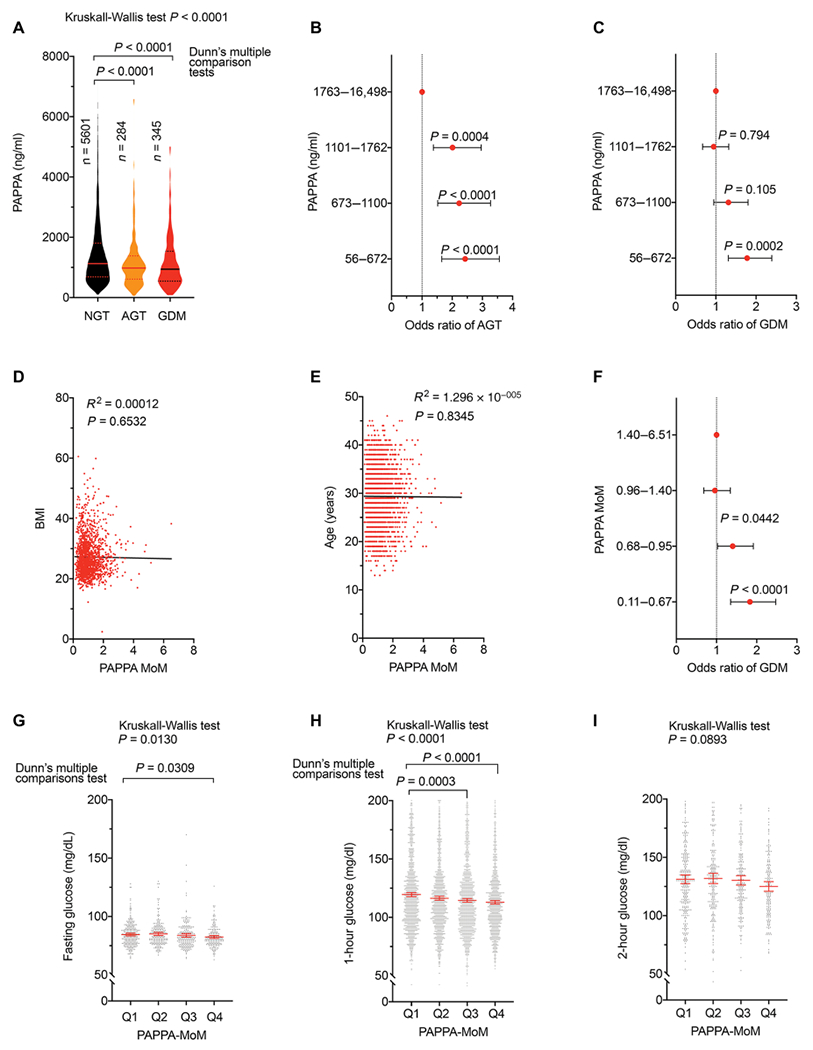
Pregnancy is a physiological state of continuous adaptation to changing maternal and fetal nutritional needs, including a reduction of maternal insulin sensitivity allowing for appropriately enhanced glucose availability to the fetus. However, excessive insulin resistance in conjunction with insufficient insulin secretion results in gestational diabetes mellitus (GDM), greatly increasing the risk for pregnancy complications and predisposing both mothers and offspring to future metabolic disease. Here, we report a signaling pathway connecting pregnancy-associated plasma protein A (PAPPA) with adipose tissue expansion in pregnancy. Adipose tissue plays a central role in the regulation of insulin sensitivity, and we show that, in both mice and humans, pregnancy caused remodeling of adipose tissue evidenced by altered adipocyte size, vascularization, and in vitro expansion capacity. PAPPA is known to be a metalloprotease secreted by human placenta that modulates insulin-like growth factor (IGF) bioavailability through prolteolysis of IGF binding proteins (IGFBPs) 2, 4, and 5. We demonstrate that recombinant PAPPA can stimulate ex vivo human adipose tissue expansion in an IGFBP-5- and IGF-1-dependent manner. Moreover, mice lacking PAPPA displayed impaired adipose tissue remodeling, pregnancy-induced insulin resistance, and hepatic steatosis, recapitulating multiple aspects of human GDM. In a cohort of 6361 pregnant women, concentrations of circulating PAPPA are inversely correlated with glycemia and odds of developing GDM. These data identify PAPPA and the IGF signaling pathway as necessary for the regulation of maternal adipose tissue physiology and systemic glucose homeostasis, with consequences for long-term metabolic risk and potential for therapeutic use.


Conflict of interest statement

Competing interests: The authors declare that they have no competing interests.

Figures

Fig. 1.
Fig. 1.. Adaptations of human adipose tissue to pregnancy.
(A) Hierarchical clustering of genes expressed in subcutaneous (SQ) or omental (OM) adipose tissue of nonpregnant (NP) or pregnant (P) women. (B and C) Volcano plots of gene expression modulated by pregnancy in both depots. IGFBP-encoding genes detected are highlighted. (D) KEGG enrichment analysis of genes modulated by pregnancy in both depots. (E and F) Scatter plots of age and BMI of cohort of nonpregnant and pregnant women from whom samples were obtained for histological analysis. (G) Representative hematoxylin and eosin (H&E) stains of subcutaneous adipose tissue from a nonpregnant (above) and a pregnant (below) subject with equivalent BMIs of 26. Scale bars, 100 μm. (H and I) Mean adipocyte size in nonpregnant and pregnant women cohorts, and adipocyte size as a function of BMI in both cohorts. a.u., arbitrary units. (J) Frequency size distributions from H&E stains of adipose tissue. Adipocyte was measured in 5 to 10 slides from each subject, and the mean and SEM of each subject depicted in the plots. Difference of histograms, Wilcoxon matched pairs test; P values for differences at each size range, multiplicity-adjusted (Sidak) Studen’s t tests. (K) Whole mount isolectin staining of adipose tissue from a nonpregnant (above) and a pregnant (below) subject with similar BMIs (BMI = 30). Scale bars, 200 μm. Arrows in magnified areas in middle panels indicate vessel discontinuity, and arrowheads isolectinpositive cells separated from vessel structures, only seen in images from pregnant subjects. Scale bars, 50 μm. Left panels are pseudocolored images where each color comprises a continuous region defined using ImageJ connected regions algorithm. (L and M) Maximal region size and number of regions are measured in 5 to 10 whole mount images from each subject, and the mean and SEM of each subject are depicted in the plots. Statistical significance of the difference between pregnant and nonpregnant was calculated using Studen’s t tests.
Fig. 2.
Fig. 2.. PAPPA stimulates human adipose tissue expandability in vitro.
(A) Representative images of sprouts emerging from adipose tissue explants embedded in 96-mm wells obtained from normoglycemic nonpregnant or pregnant women. Images were taken at 7 (top) and 11 (bottom) days of culture. (B) Quantification of sprouting area from AT explants at indicated time points. Between 10 and 30 explants were embedded for each subject, and each symbol represents the mean sprouting area of all explants per subject. Means and SEM of nonpregnant (n = 12) and pregnant (n = 11) subjects are plotted. Unpaired, two-tailed Studen’s t tests. (C) Mean and SEM of the sprouting area of 5 to 10 explants from four separate subjects (n = 4 for each time point) treated in the absence or presence of the indicated concentration of recombinant human PAPPA (rhPAPPA) for the times shown. Statistical significance of differences between doses at each time point was calculated using repeated measures two-way ANOVA with Dunnet’s correction for multiple comparisons. (D) Explants from four pregnant women (n = 5 to 10 explants per subject) were cultured in the absence or presence of recombinant human PAPPA [rhPAPPA (1200 ng/ml)]. Two-tailed paired Studen’s t tests. (E) Mean and SEM of the sprouting area of n = 10 explants cultured in the presence of the indicated concentration of the IGF-1 receptor inhibitor NVP-AEW541. Statistical comparisons between no inhibitor and each dose were made using one-way ANOVA with Dunnet’s correction for multiple comparisons. (F) Mean and SEM of the sprouting area of n = 10 explants cultured in the presence of the indicated concentration of recombinant human IGFBP5 in the absence or presence of rhPAPPA. Statistical comparisons between no inhibitor and each dose were made using one-way ANOVA with the Dunnet’s correction for multiple comparisons.
Fig. 3.
Fig. 3.. Adaptations of adipose tissue to pregnancy in mice require Pappa.
(A) Body weight, total lean mass (B), and total fat mass (C) from nonpregnant or pregnant wild-type (NPWT, n = 6; PWT, n = 6) or nonpregnant or pregnant PappA KO mice (NPKO, n = 7; PKO, n = 6). Lean mass percent (D) and fat mass percent (E) were calculated by normalizing to lean + fat mass. For (A) to (E), statistical significance was assessed using ordinary one-way ANOVA corrected with the Sidak test for multiple comparisons. (F) Representative figure of the anatomical localization for the fat pads analyzed [adapted from (70)]. (G) Mass of individual fat depots from NPWT (n=10), PWT (n = 13), NPKO (n = 7), and PKO (n = 11), expressed as % body weight. Statistical significance of differences between nonpregnant and pregnant state within each depot was measured using multiplicity (Holm-Sidak) adjusted Studen’s t tests. (H) Representative image of H&E staining displaying the proximal parametrial fat pads. Scale bar, 100 μm. (I) Frequency distribution of adipocyte sizes measured in H&E-stained sections (~10 images per depot per mouse) from n = 6 mice per group. Statistical significance of differences in frequency at each bin between nonpregnant and pregnant states measured using multiplicity (Holm-Sidak) adjusted Studen’s t tests.
Fig. 4.
Fig. 4.. Gene expression reveals compensation for Pappa deficiency in specific depots.
Real-time quantitative polymerase chain reaction for PappA (A), Igf-2 (B), Igfbp-2 (C), Igfbp-4 (D), Igfbp-5 (E), and Igf-1 (F) in fat depots from nonpregnant or pregnant wild-type (NPWT n = 3, PWT n = 3) or nonpregnant or pregnant Pappa KO mice (NPKO n = 3, PKO n = 3). Fold expression values were calculated by normalization to the lowest expression value in the dataset for each gene. For each gene, minimum and maximum Ct values were 26 and 29 for Pappa, 22 and 35 for Igf-2, 22 and 37 for Igfbp-2, 20 and 27 for Igfbp-4 20 and 28 for Igfbp-5, and 18 and 26 for Igf-1. Graphs show mean and SEM of n = 3 mice per group, where the value for each mouse was the mean of three technical replicates. Statistical significance of the differences between fat depot, genotype, and pregnant state for each gene was calculated using three-way ANOVA corrected for multiple comparisons using the Tukey’s test. In (A) to (C), statistical significance of differences in gene expression between states within individual depots was measured using multiplicity-adjusted t tests.
Fig. 5.
Fig. 5.. Pappa deficiency results in insulin resistance during pregnancy.
(A) Blood glucose after a 6-hour fast of nonpregnant wild-type (NPWT, n = 47), pregnant wild-type (PWT, n = 26), nonpregnant Pappa KO mice (NPKO, n = 46), or pregnant Pappa KO mice (PKO, n = 28) mice at 10 to 12 weeks of age. (B) Plasma insulin after a 4.5-hour fast of nonpregnant wild-type (NPWT, n = 7), pregnant wild-type (PWT, n = 6), nonpregnant Pappa KO mice (NPKO, n = 8), or pregnant Pappa KO mice (PKO, n = 8) mice at 12 weeks of age. Comparisons between groups in (A) and (B) were made using one-way ANOVA corrected for multiple comparisons using the Sidak test. (C to E) Insulin tolerance tests (0.65 units of insulin/kg body weight) after a 4.5-hour fast of nonpregnant wild-type (NPWT, n = 22), pregnant wild-type (PWT, n = 10), nonpregnant Pappa KO mice (NPKO, n = 17), or pregnant Pappa KO mice (PKO, n = 9). Panels (C) and (D) are raw values, and panel (E) is the percent of basal value. Variance between groups in (C) and (D) was assessed using one-way ANOVA corrected for multiple comparisons using the Holm-Sidak test and in (E) using repeated measures ANOVA corrected for multiple comparisons using the Holm-Sidak test. Significance of the differences at each time point was calculated using multiplicity adjusted t tests. (F) Plasma insulin before (t = 0) and after (t = 45 min) administration of glucose (2 g/kg body weight) after a 6-hour fast to NPWT (n = 7), PWT (n = 6), NPKO (n = 9), and PKO (n = 8) mice. Statistical significance was assessed using ordinary one-way ANOVA corrected with the Sidak test for multiple comparisons. (G to I) Glucose tolerance test (2 g of glucose/kg body weight) after 6-hour fast of NPWT (n = 25), PWT (n = 15), NPKO (n = 29), and PKO (n = 19) mice. Panels (G) and (H) are raw values, and panel (I) is the percent of basal value. Variance between groups in (G) and (H) was assessed using one-way ANOVA corrected for multiple comparisons using the Holm-Sidak test and in (I) using repeated measures ANOVA corrected for multiple comparisons using the Holm-Sidak test, and differences at each time point measured using multiplicity adjusted t tests. (J) Glucose values and muscle glucose uptake during hyperinsulinemic-euglycemic clamps for each parameter measured (x axis) for NPWT (n = 10) and NPKO (n = 12) mice. Bars indicate mean and SEM, and symbols are the values for each individual animal. Statistical significance of the differences for each parameter was calculated using two-tailed, unpaired Studen’s t tests and exact P values are shown. (K and L) Liver mass (K) and triglyceride (L) content from NPWT (n = 10), PWT (n = 13), NPKO (n = 7), and PKO (n = 11) mice. Variance between groups was assessed using one-way ANOVA corrected for multiple comparisons using the Sidak test (M). Representative images of H&E liver sections. Scale bars, 20 μm. Insets contain magnified sections of each image. Scale bars, 5 μm. (N) Average number of pups and average weight per pup from 13 liters from PWT and 11 liters from PKO mice. Shown are means and SEM, and statistical difference between groups was calculated using two-tailed unpaired Studen’s t tests.
Fig. 6.
Fig. 6.. Association between PAPPA and glycemia in pregnancy.
(A) Violin plots of PAPPA values at 10 to 14 weeks of gestation in women categorized with normal glucose tolerance (NGT n = 5601), abnormal glucose tolerance (AGT n = 284), and gestational diabetes mellitus (GDM n = 345) at week 24 to 28 of gestation. Statistical significance was estimated using ordinary one-way ANOVA corrected for multiple comparisons using the Sidak test. Median and quartile values are indicated. (B and C) Odds ratio and 95% confidence interval (CI) for AGT (B) or GDM (C). (D) Linear regression between PAPPA MoM and BMI (n = 1620). (E) Linear regression between PAPPA MoM and age (n = 3465). (F) Odds ratio and 95% CI of GDM at different quartiles of PAPPA MoM. For (B), (C), and (F), statistical significance between comparisons to the highest quartile was done using Fisher’s exact test. (G to I) Fasting (n = 932) (G), 1 hour (n = 5294) (H), and 2 hours (n = 909) (I) glucose values at each PAPPA MoM quartile. Analysis of variance was performed using the Kruskall-Wallis test, and difference between the first quartile (Q1) and others was calculated using the Dunn’s multiple comparison test.

Comment in

Similar articles

Cited by

References

    1. Zhang C, Olsen SF, Hinkle SN, Gore-Langton RE, Vaag A, Grunnet LG, Yeung EH, Bao W, Bowers K, Liu A, Mills JL, Sherman S, Gaskins AJ, Ley SH, Madsen CM, Chavarro JE, Hu FB; Diabetes & Women’s Health Study team, Diabetes & Women’s Health (DWH) Study: An observational study of long-term health consequences of gestational diabetes, their determinants and underlying mechanisms in the USA and Denmark. BMJ Open 9, e025517 (2019). - PMC - PubMed
    1. McIntyre HD, Catalano P, Zhang C, Desoye G, Mathiesen ER, Damm P, Gestational diabetes mellitus. Nat. Rev. Dis. Primers 5, 47 (2019). - PubMed
    1. Kjos SL, Peters RK, Xiang A, Henry OA, Montoro M, Buchanan TA, Predicting future diabetes in Latino women with gestational diabetes. Utility of early postpartum glucose tolerance testing. Diabetes 44, 586–591 (1995). - PubMed
    1. Bellamy L, Casas J-P, Hingorani AD, Williams D, Type 2 diabetes mellitus after gestational diabetes: A systematic review and meta-analysis. Lancet 373, 1773–1779 (2009). - PubMed
    1. Kwak SH, Choi SH, Kim K, Jung HS, Cho YM, Lim S, Cho NH, Kim SY, Park KS, Jang HC, Prediction of type 2 diabetes in women with a history of gestational diabetes using a genetic risk score. Diabetologia 56, 2556–2563 (2013). - PubMed

Publication types

Substances