. 2020 Nov 25;12(571):eaay7713.
doi: 10.1126/scitranslmed.aay7713.

Obesity induces gut microbiota alterations and augments acute graft-versus-host disease after allogeneic stem cell transplantation

Affiliations

Obesity induces gut microbiota alterations and augments acute graft-versus-host disease after allogeneic stem cell transplantation

Lam T Khuat et al. Sci Transl Med. .

Abstract

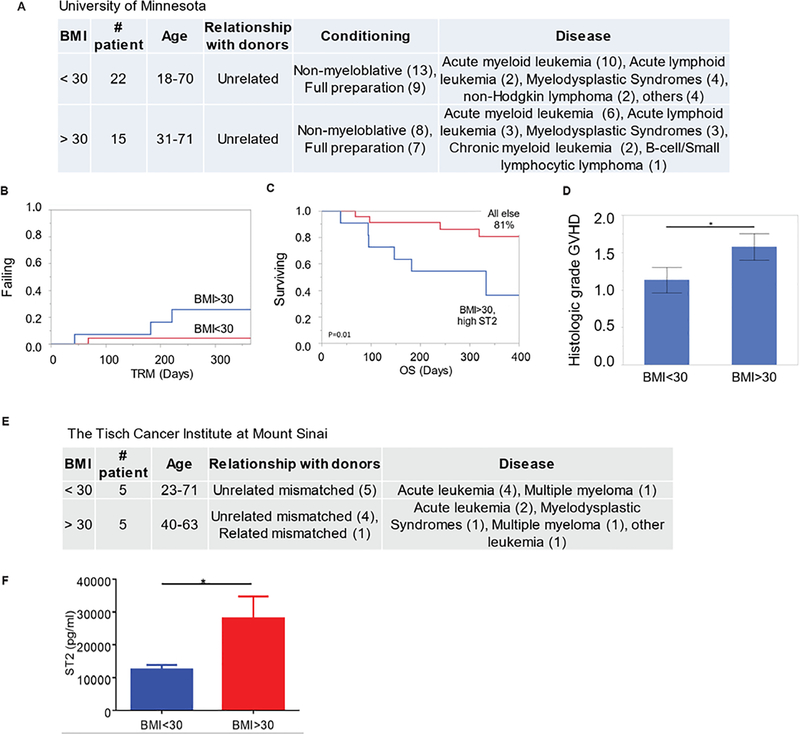
The efficacy of allogeneic hematopoietic stem cell transplantation (allo-HSCT) is limited by acute and chronic graft-versus-host disease (GVHD). The impact of obesity on allo-HSCT outcomes is poorly understood. Here, we report that obesity had a negative and selective impact on acute gut GVHD after allo-HSCT in mice with diet-induced obesity (DIO). These animals exhibited increased gut permeability, endotoxin translocation across the gut, and radiation-induced gastrointestinal damage after allo-HSCT. After allo-HSCT, both male and female DIO mouse recipients showed increased proinflammatory cytokine production and expression of the GVHD marker ST2 (IL-33R) and MHC class II molecules; they also exhibited decreased survival associated with acute severe gut GVHD. This rapid-onset, obesity-associated gut GVHD depended on donor CD4+ T cells and occurred even with a minor MHC mismatch between donor and recipient animals. Retrospective analysis of clinical cohorts receiving allo-HSCT transplants from unrelated donors revealed that recipients with a high body mass index (BMI, >30) had reduced survival and higher serum ST2 concentrations compared with nonobese transplant recipients. Assessment of both DIO mice and allo-HSCT recipients with a high BMI revealed reduced gut microbiota diversity and decreased Clostridiaceae abundance. Prophylactic antibiotic treatment protected DIO mouse recipients from endotoxin translocation across the gut and increased inflammatory cytokine production, as well as gut pathology and mortality, but did not protect against later development of chronic skin GVHD. These results suggest that obesity-induced alterations of the gut microbiota may affect GVHD after allo-HSCT in DIO mice, which could be ameliorated by prophylactic antibiotic treatment.


Figures

Figure 1.
Figure 1.. Obesity accelerates acute GVHD in a major mismatched mouse model.
C57BL/6 male mice (H2b) received total body irradiation (TBI) (1050 cGy) and T cell-depleted bone marrow (BM) cells with or without purified T cells (4.5 – 9 × 10⁶) from donor BALB/c mice (H2d). Control + T, control mice transplanted with BM and T cells; DIO + T, DIO mice transplanted with BM and T cells. (A) Magnetic resonance images (MRI) of nontransplant control and DIO C57BL/6 mice. (B) Survival rates (n = 10–12 mice/group) displayed as Kaplan-Meier curves analyzed by a log-rank test. (C) Acute GVHD (aGVHD) clinical scores (n = 10–12 mice/group). Statistical significance was determined by two-way analysis of variance (ANOVA) with Tukey’s post hoc test for comparison among groups. (D-F) Hematoxylin and eosin (H&E) staining of small intestine samples, colon samples, and liver samples at day 6 post allo-HSCT. Black arrows indicates mucosal necrosis. Scale bars: 200μm, 50μm. (G) Pathology scores for GI tract and liver at day 6 post allo-HSCT (n = 5 mice/group). (H) Serum IL-6 and TNF concentrations at day 6 post allo-HSCT (n = 6–7 mice/group). (I) Relative expression of the genes encoding IL-6 and TNF in the small intestine at day 6 post allo-HSCT (n = 7– 8 mice/group). (J) Serum ST2 concentration at day 6 post allo-HSCT (n = 4 mice/group). (K) Number of donor CD4+ T cells in the mesenteric lymph nodes at day 8 post allo-HSCT (n = 4 mice/group). Bar graphs depict mean ± standard error of mean (s.e.m). Each experiment was performed at least twice. In panel G – K, nonparametric Mann-Whitney test was used to compare two unpaired groups. *p < 0.05, **p < 0.01, ***p < 0.001, ****p < 0.0001, ns, not significant.
Figure 2.
Figure 2.. Obesity induces GI tract acute GVHD in a mouse model of sclerodermatous chronic GVHD.
Lean (control) or obese (DIO) female BALB/c mice (H2d) received total body irradiation (TBI) 800 cGy and underwent transplantation with bone marrow (BM) cells with or without splenocytes (10–25 × 106) from donor B10.D2 (H2d) mice. Control mice were a healthy weight. BM only, recipient of bone marrow cells without splenocytes; 25M SC, recipient of bone marrow cells + 25 × 106 splenocytes; 10M SC, recipient of bone marrow cells + 10 × 106 splenocytes. (A) Chronic GVHD (cGVHD) score of control mice with sclerodermatous GVHD. (B, C) Representative images of trichrome staining of the skin from control mice transplanted with bone marrow cells only and control mice transplanted with bone marrow cells + splenocytes showing evidence of sclerodermatous cGVHD. Tissues were from mice at day 55 post allo-HSCT. Black arrow indicates collagen deposition. Scale bars, 200μm or 50μm. (D) Survival rates of control and DIO mice receiving 10 × 106 or 25 × 106 splenocytes, shown as Kaplan-Meier curves (n = 9–12 mice/group). (E) Acute GVHD (aGVHD) clinical scores (n = 9 −12 mice/group). (F) Survival rates of control and DIO mice of different sexes (n = 4 mice/group), shown as Kaplan-Meier curves. (G-I) Hematoxylin and eosin (H&E) staining of small intestine samples, colon samples, and liver samples at day 6 post allo-HSCT. Black arrows indicate the destruction of crypt structures in the gut. Scale bars, 200μm or 50μm. (J) Pathology scores for GI tract and liver at day 6 post allo-HSCT (n = 6–8 mice/group). (K) Serum IL-6 and TNF concentrations at day 6 post allo-HSCT (n = 6 mice/group). (L) Relative expression of genes encoding IL-6 and TNF in the small intestine at day 6 post allo-HSCT (n = 5–6 mice/group). (M) Serum ST2 concentrations at day 6 post allo-HSCT (n = 6–7 mice/group). (N) Number of donor CD4+ T cells in the mesenteric lymph nodes at day 7 post allo-HSCT (n = 7 mice/group). Bar graphs depict mean ± s.e.m. Each experiment was performed at least twice. In D and F, Kaplan-Meier survival curves were analyzed by a log-rank test. In E, clinical scores were analyzed by 2-way analysis of variance (ANOVA) with Tukey’s post hoc test for comparison among groups. In panels J and K, nonparametric Mann-Whitney tests were used to compare two unpaired groups. *p < 0.05, **p < 0.01, ***p < 0.001, ****p < 0.0001.
Figure 3.
Figure 3.. Obesity correlates with lower survival rate after mismatched allo-HSCT in human patients.
(A) Patient characteristics from one cohort at University of Minnesota stratified by BMI above or below 30. The numbers of patients with each characteristic are indicated in parentheses. (B) Shown is transplant-related mortality (TRM) in the days after mismatched allo-HSCT for the cohort described in A. (C) Shown is survival outcome for patients after allo-HSCT; 11 of 37 patients had a BMI > 30 and high ST2 serum concentrations. Kaplan-Meier survival curves were analyzed by a log-rank test. (D) Pathology scores for intestinal biopsies of patients in the cohort described in A are. shown. Statistical significance was analyzed by nonparametric Mann-Whitney test. (E) Patient characteristics for the cohort from the Tisch Cancer Institute stratified by BMI are shown. (F) Shown are serum ST2 concentrations at day 7 post allo-HSCT for the 10 patients described in panel E. Statistical significance was analyzed by nonparametric Mann-Whitney test. *p < 0.05.
Figure 4.
Figure 4.. Acute GVHD in obese mouse recipients is mediated by donor CD4+ T cells.
(A, B) Female BALB/c lean (control) and obese (DIO) mice received total body irradiation (TBI) 800 cGy and underwent transplantation with bone marrow (BM) cells and with either whole splenocytes (SC) or purified CD8+ T cells from B10.D2 mice. Shown are survival rates (A) and serum IL-6 and TNF concentrations at day 6 post allo-HSCT (B) (n = 3–4 mice/group). Kaplan-Meier survival curves were analyzed by a log-rank test. (C-H) Female lean (control) and obese (DIO) C57BL/6 mice (H2b) received TBI (1050 cGy) and T cell-depleted bone marrow cells with either purified T cells or purified CD8+ T cells (3 × 10⁶) from C3H.SW (H2b) mice. (C) Representative images of control and DIO mice developing skin GVHD at day 33 post allo-HSCT. (D) Hematoxylin and eosin (H&E) staining of skin samples from control and DIO mice transplanted with purified CD8+ T cells at day 36 post allo-HSCT. Black arrows indicate inflammatory cell infiltration. Scale bar, 200μm. (E) Pathology scores of skin samples from control and DIO mice transplanted with purified CD8+ T cells at day 36 post allo-HSCT (n = 5 – 6 mice/group). (F) H&E staining of GI tract samples from control and DIO mice transplanted with purified CD8+ T cells at day 36 post allo-HSCT. Scale bar, 200μm. (G) Pathology scores of GI tract samples from control and DIO mice transplanted with purified CD8+ T cells at day 36 post allo-HSCT (n = 3–4 mice/group). (H) Comparison of pathology scores of GI tract samples for CD8+ T cell-dependent minor MHC mismatch model (C3H.SW into C57BL/6) and CD4+ T cell-dependent major MHC mismatch model (BALB/c into C57BL/6) (n = 3 – 5 mice/group). Bar graphs depict mean ± s.e.m. Each experiment was performed at least twice. In B, E, G, and H, nonparametric Mann-Whitney test was used to compare two unpaired groups. *p < 0.05, **p < 0.01, ***p<0.001, ns, not significant.
Figure 5.
Figure 5.. Increased intestinal permeability and apoptosis in obese mice after irradiation.
(A-F) Control lean and obese DIO BALB/c mice received 800 cGy of total body irradiation (TBI). (A) LPS-binding protein (LBP) serum concentrations for control and DIO mice at day 2 post-irradiation (7–8 mice/group). (B) Endotoxin serum concentrations for control and DIO mice at day 2 post-irradiation (3 mice/group). (C) Relative gene expression at day 2 post-irradiation (normalized to control mice + 800 cGy). (D) Percentage of Annexin V+ PI- cells in the intestine at day 2 post-irradiation (n = 7–8 mice/group). (E) Representative images of TUNEL-positive cells in the colon of nonirradiated control and DIO mice, and irradiated control and DIO mice. Black arrows indicate apoptotic cells revealed by TUNEL staining. Scale bar, 50μm. (F) Quantification of TUNEL-positive apoptotic bodies/mm2 in control and DIO mice at day 2 post-irradiation (4 mice/group). (G) Representative immunohistochemical images of MHC II abundance in the intestine of control and DIO BALB/c mice transplanted with B10.D2 mouse bone marrow (BM) + splenocytes at day 6 post allo-HSCT. Scale bars, 300μm (left) and 200μm (right). (H) Representative histogram and quantification of mean fluorescence intensity (MFI) of the MHC II+ cell population gated on CD45+ CD19- CD11c+ cells in the mesenteric lymph nodes at day 4 post allo-HSCT (n = 3–4 mice/group). Bar graphs depict mean ± s.e.m. Each experiment was performed at least twice. Nonparametric Mann-Whitney tests were used to compare two unpaired groups. *p < 0.05.
Figure 6.
Figure 6.. Obesity correlates with restricted gut microbiota diversity and GVHD-associated bacterial taxa.
(A) Taxonomic profiles of fecal samples from nonirradiated control and DIO C57BL/6 mice (n = 4 mice/group) and nonirradiated control and DIO BALB/c (n = 6 mice/group). Each row represents an operational taxonomic unit (OTU). (B) Operational taxonomic units in control and DIO BALB/c mice. (C) Operational taxonomic units in control and DIO C57BL/6 mice. (D) Fold change in family Clostridiaceae for control and DIO BALB/c mice. (E) Fold change in family Clostridiaceae for control and DIO C57BL/6 mice (n = 5–6 mice/group). (F) Fold change in Enterococcus abundance in control and DIO BALB/c mice at day 4 post allo-HSCT (B10.D2→BALB/c + SC model, n = 7 – 8 mice/group). (G) Gut microbiota α-diversity for patients in the University of Minnesota cohort with a BMI<25 (n=4) or a BMI>30 (n=14) before allo-HSCT, shown by Pielou’s evenness index. (H) Abundance of Clostridium in lean and obese patients in the University of Minnesota cohort before allo-HSCT. Nonparametric Mann-Whitney tests were used to compare two unpaired groups. *p < 0.05, **p < 0.01.
Figure 7.
Figure 7.. Antibiotic administration before transplant ameliorates acute GVHD in obese recipients.
BALB/c mouse recipients were transplanted with bone marrow (BM) cells and 25 × 106 splenocytes from B10.D2 donor mice. Where indicated, the antibiotics (Abx) ampicillin, neomycin, and vancomycin (0.5 mg/ml) were added to drinking water for 14 days before allo-HSCT. (A) Kaplan-Meier survival curves after allo-HSCT were analyzed by a log-rank test (n = 7 mice/group). (B) aGVHD and cGVHD clinical scores are shown (n = 7 mice/group). Data were analyzed by 2-way analysis of variance (ANOVA) with Tukey’s post hoc test for comparison among groups. (C) Principal component (PC) analysis of weighted and normalized UniFrac distances of fecal microbiota from control, DIO, and antibiotic-treated DIO mice. (D) Relative abundance of Akkermansia muciniphila in fecal samples of control, DIO, and antibiotic-treated DIO BALB/c mice before allo-HSCT and at day 4 after allo-HSCT (n = 3–6 mice/group). (E) Bacterial load comparison and bacterial taxa of fecal microbiota from untreated DIO and antibiotic-treated DIO BALB/c mice. Chart for antibiotic-treated mice is shown to scale and enlarged. (F) Serum IL-6 and TNF concentrations at day 6 post allo-HSCT (n = 5–7 mice/ group). (G) Serum ST2 concentrations at day 6 post allo-HSCT (n = 6–8 mice/group). (H) Endotoxin serum concentrations at day 4 post allo-HSCT (n = 6–8 mice/group). Bar graphs depict mean ± s.e.m. Each experiment was performed at least twice. In D, F, G, and H, nonparametric Mann-Whitney tests were used to compare two unpaired groups. *p < 0.05, **p < 0.01, ***p < 0.001, ****p < 0.0001.

References

    1. Blazar BR, Murphy WJ, Abedi M, Advances in graft-versus-host disease biology and therapy. Nat Rev Immunol 12, 443–458 (2012). - PMC - PubMed
    1. Flegal KM, Carroll MD, Kit BK, Ogden CL, Prevalence of obesity and trends in the distribution of body mass index among US adults, 1999–2010. JAMA 307, 491–497 (2012). - PubMed
    1. Navarro WH et al., Effect of body mass index on mortality of patients with lymphoma undergoing autologous hematopoietic cell transplantation. Biol Blood Marrow Transplant 12, 541–551 (2006). - PubMed
    1. Fuji S et al., Possible association between obesity and posttransplantation complications including infectious diseases and acute graft-versus-host disease. Biol Blood Marrow Transplant 15, 73–82 (2009). - PubMed
    1. Jaime-Perez JC et al., Obesity is associated with higher overall survival in patients undergoing an outpatient reduced-intensity conditioning hematopoietic stem cell transplant. Blood Cells Mol Dis 51, 61–65 (2013). - PubMed

Publication types