Observational Study
. 2021 Jan 1;206(1):23-36.
doi: 10.4049/jimmunol.2001088. Epub 2020 Nov 25.

A Whole Blood Enzyme-Linked Immunospot Assay for Functional Immune Endotyping of Septic Patients

Affiliations
Observational Study

A Whole Blood Enzyme-Linked Immunospot Assay for Functional Immune Endotyping of Septic Patients

Monty B Mazer et al. J Immunol. .

Abstract

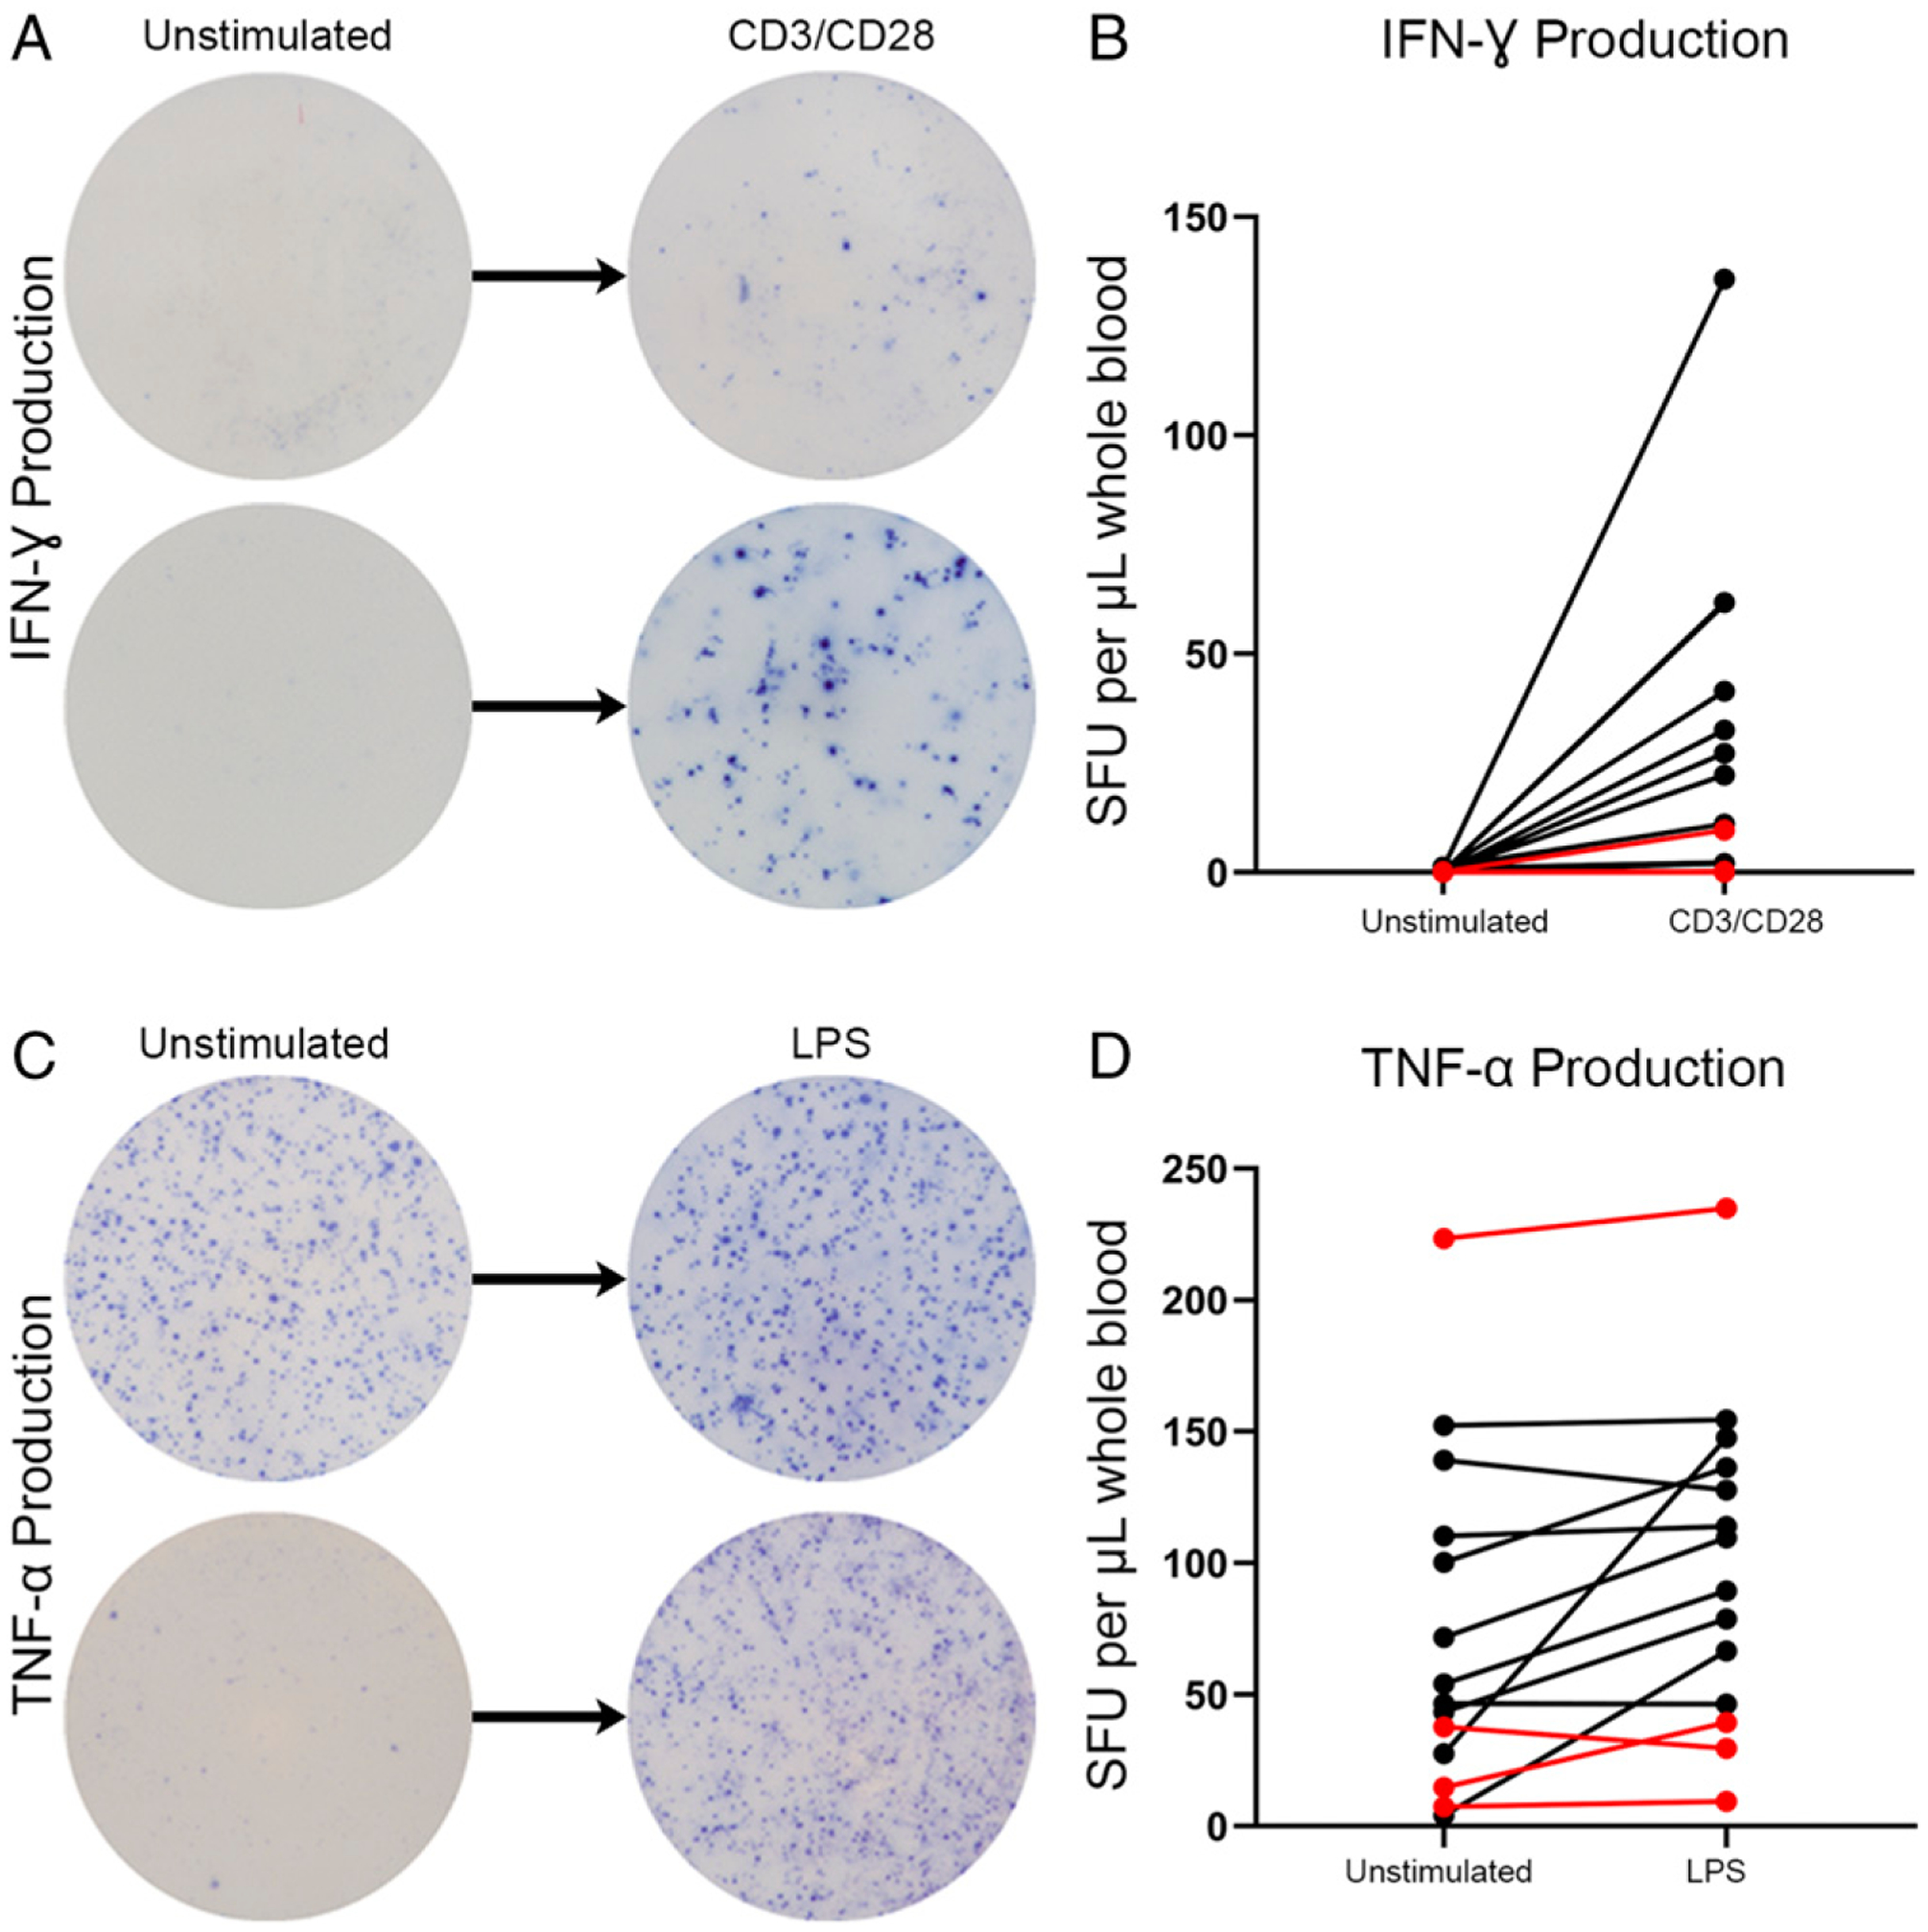
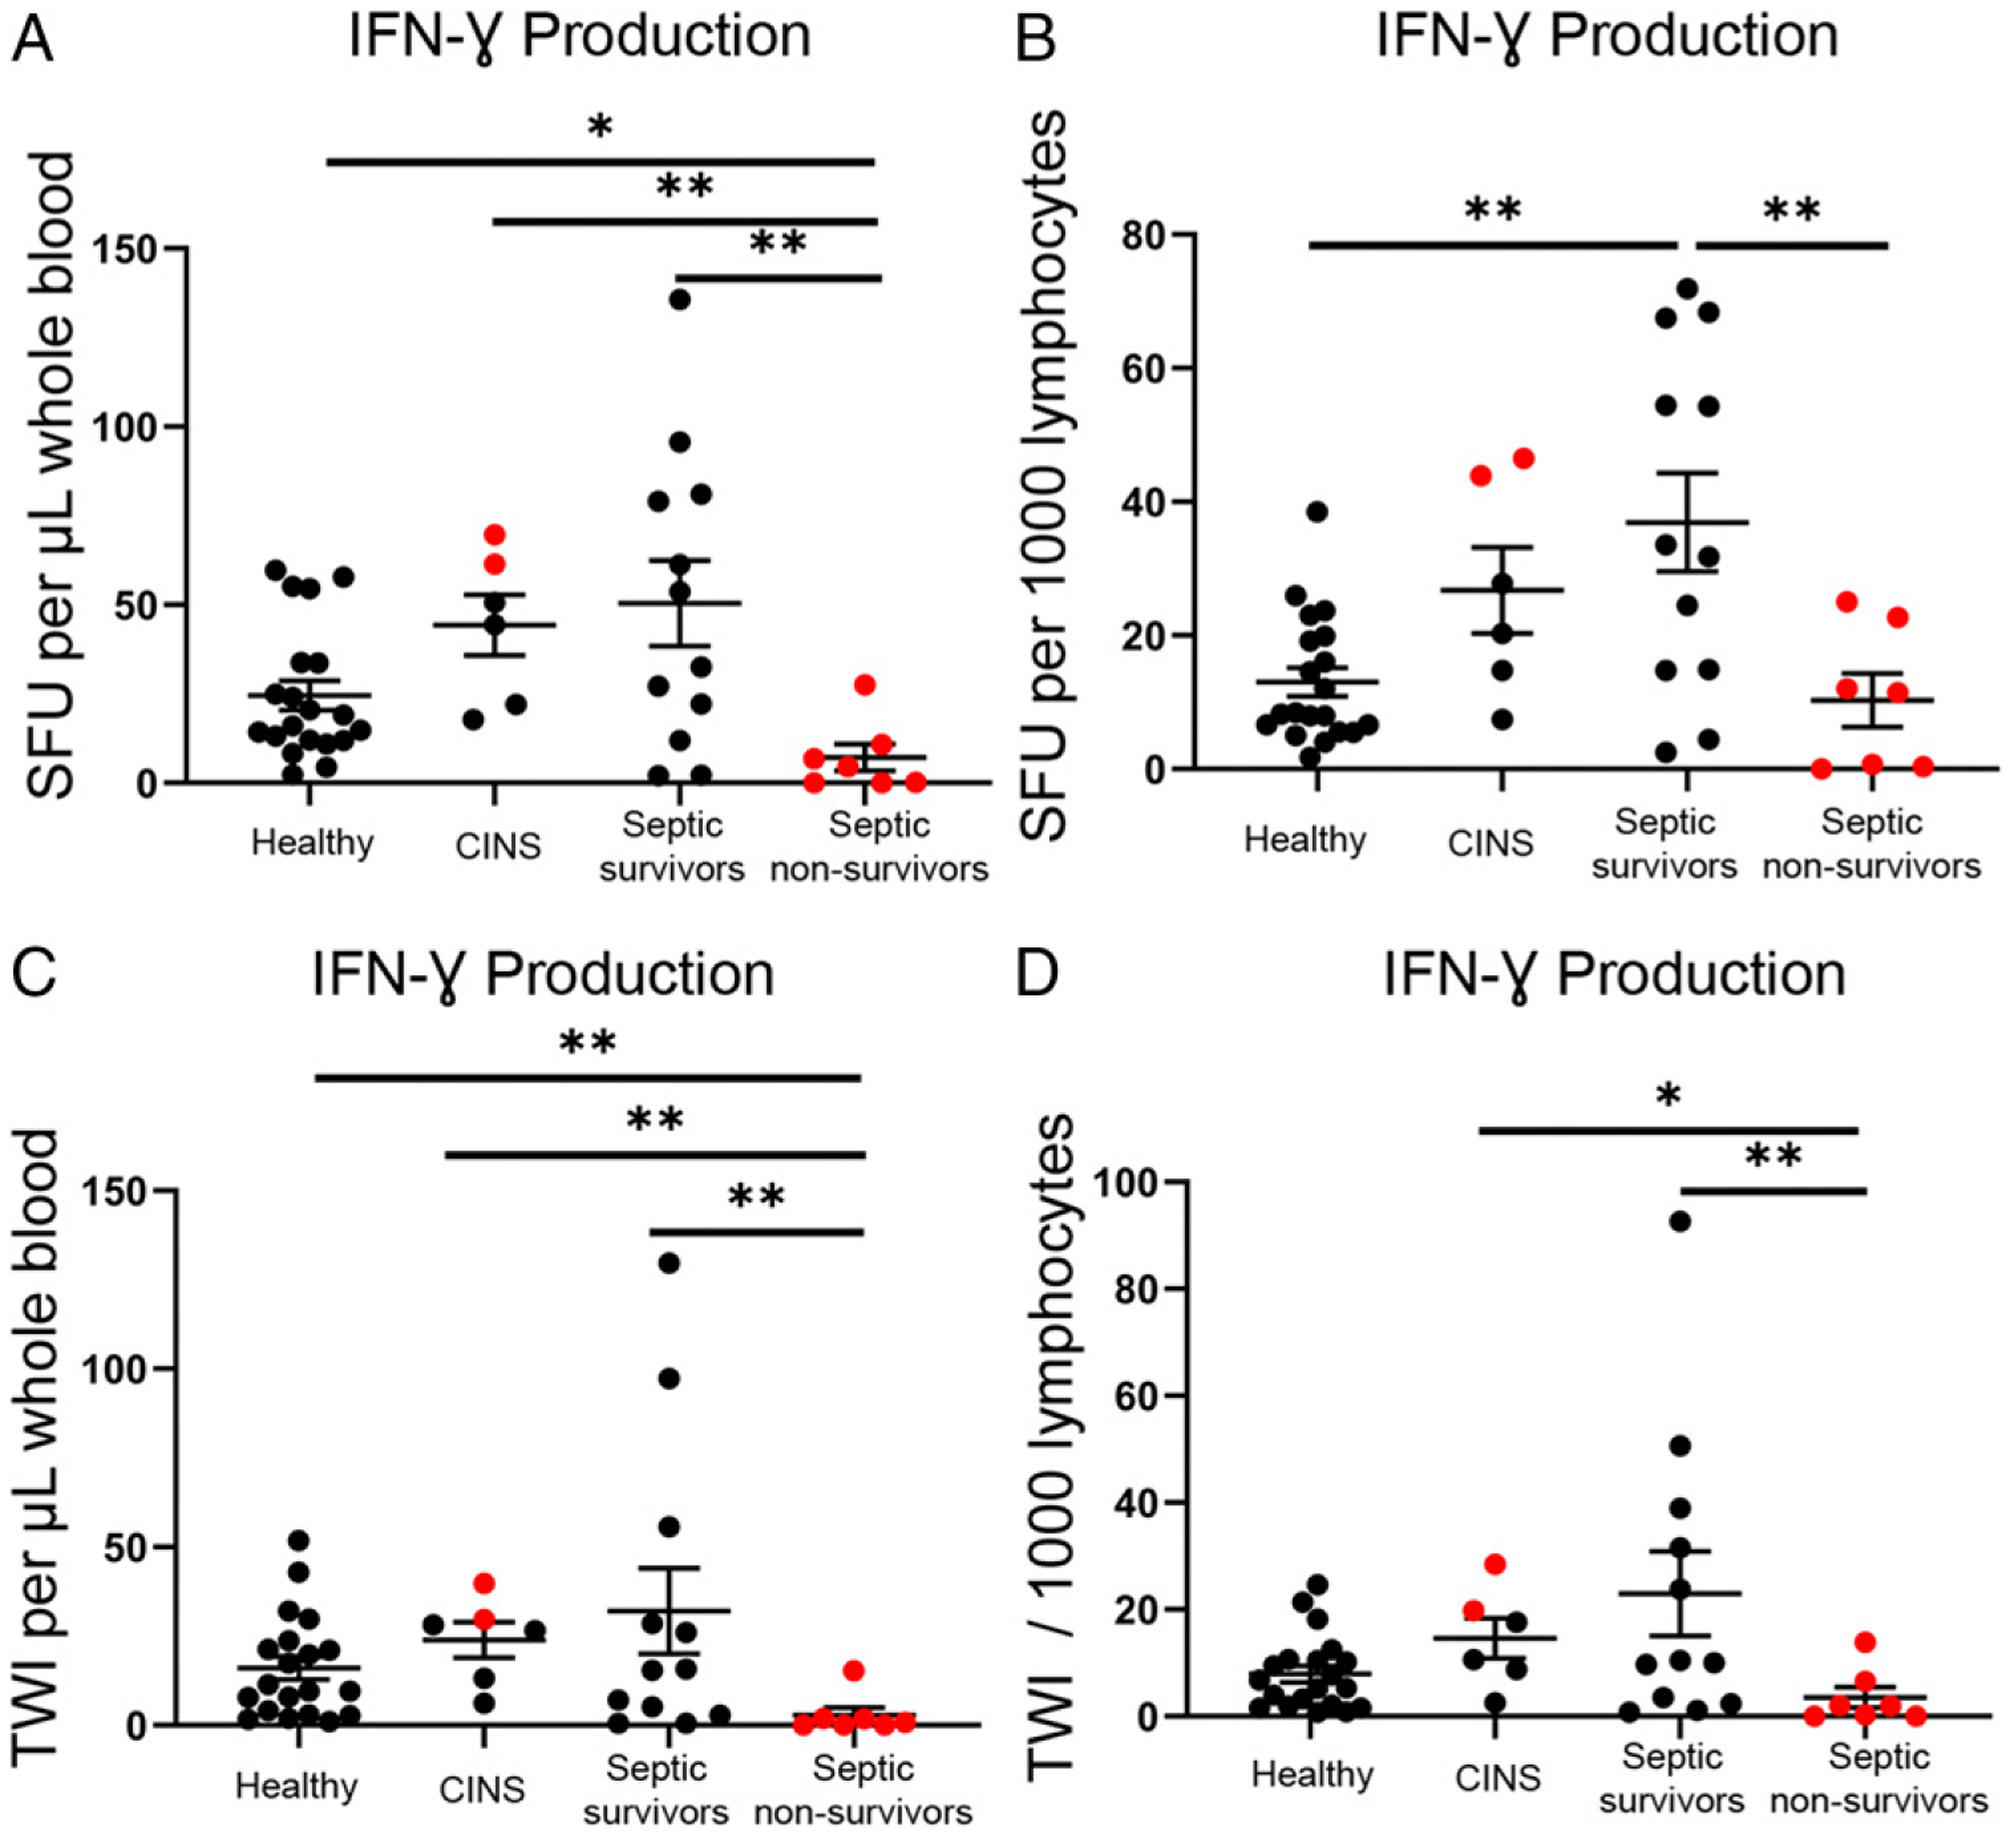
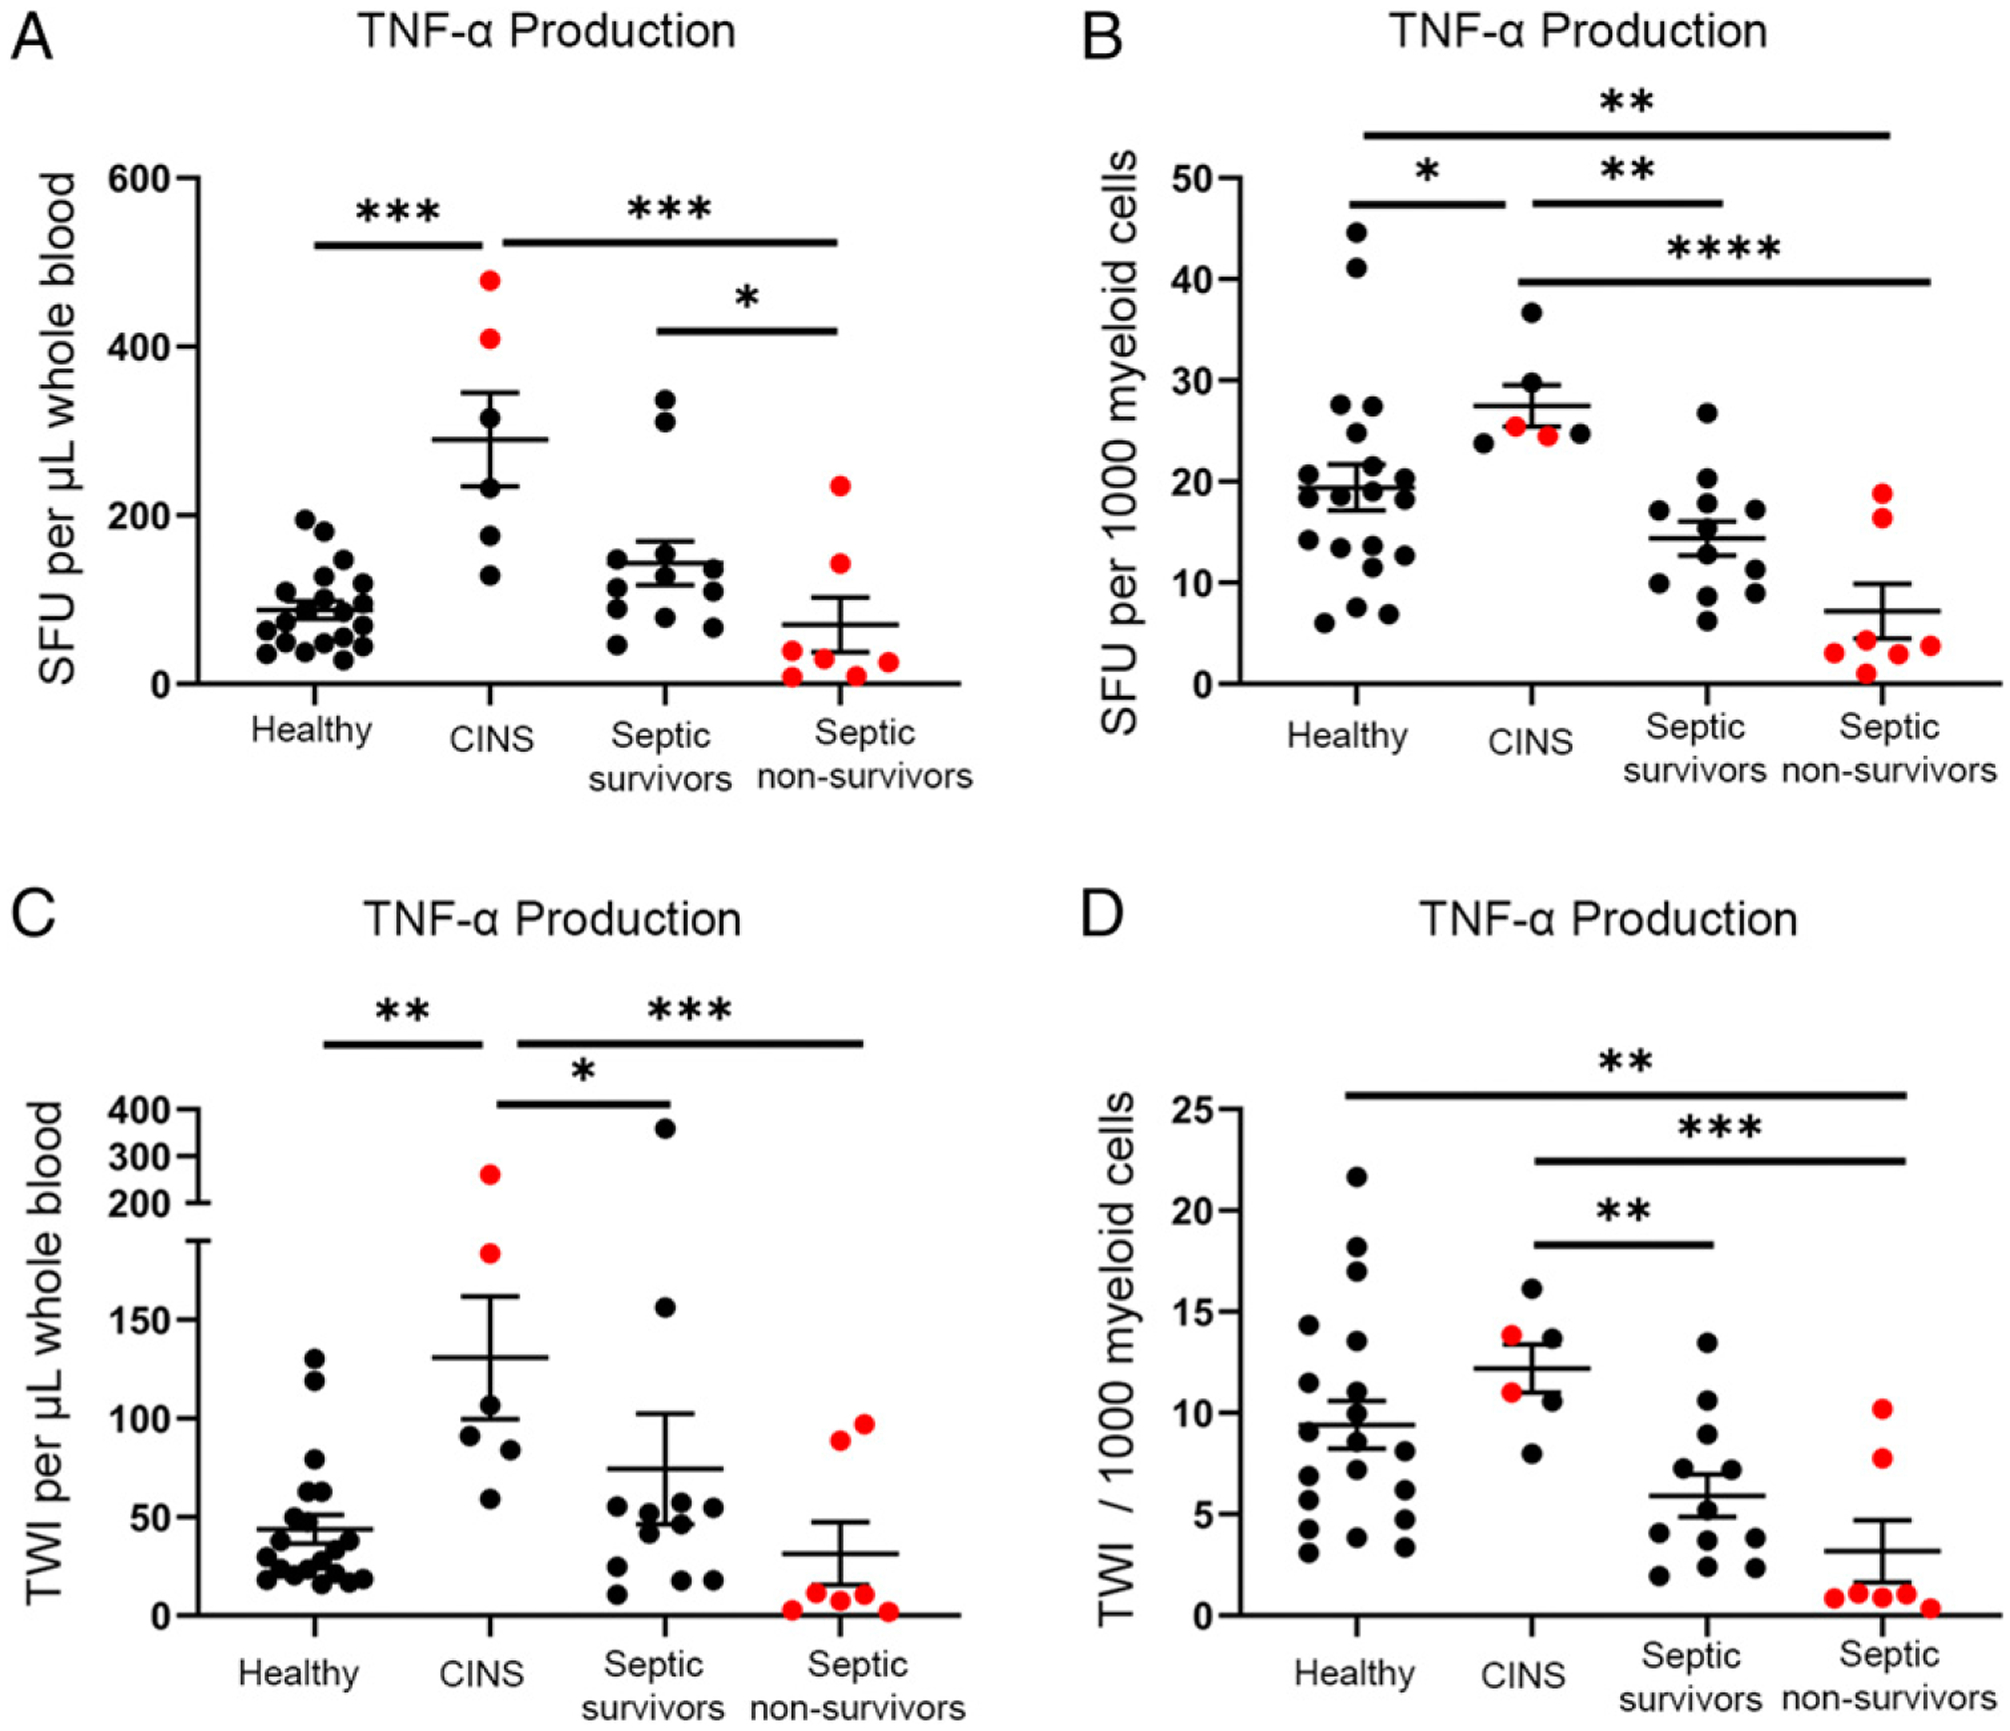
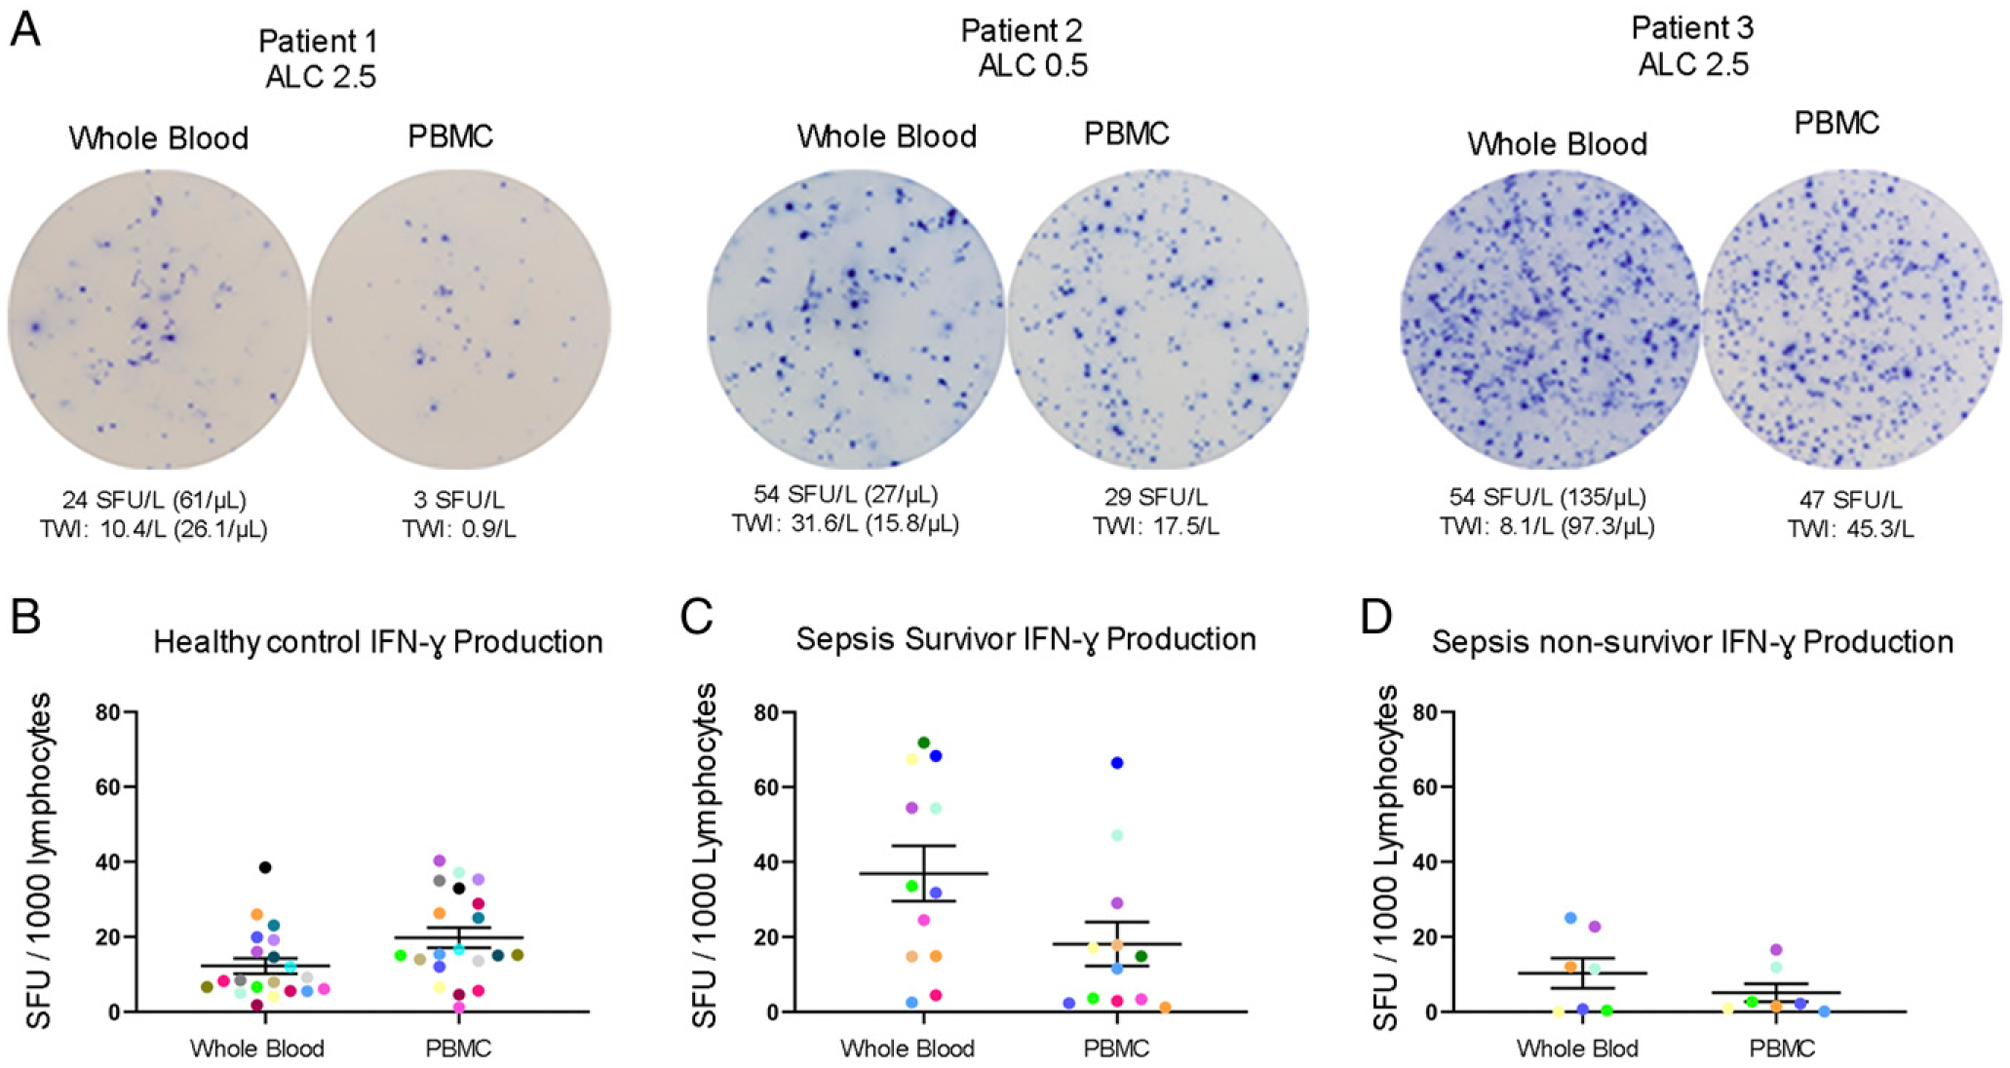
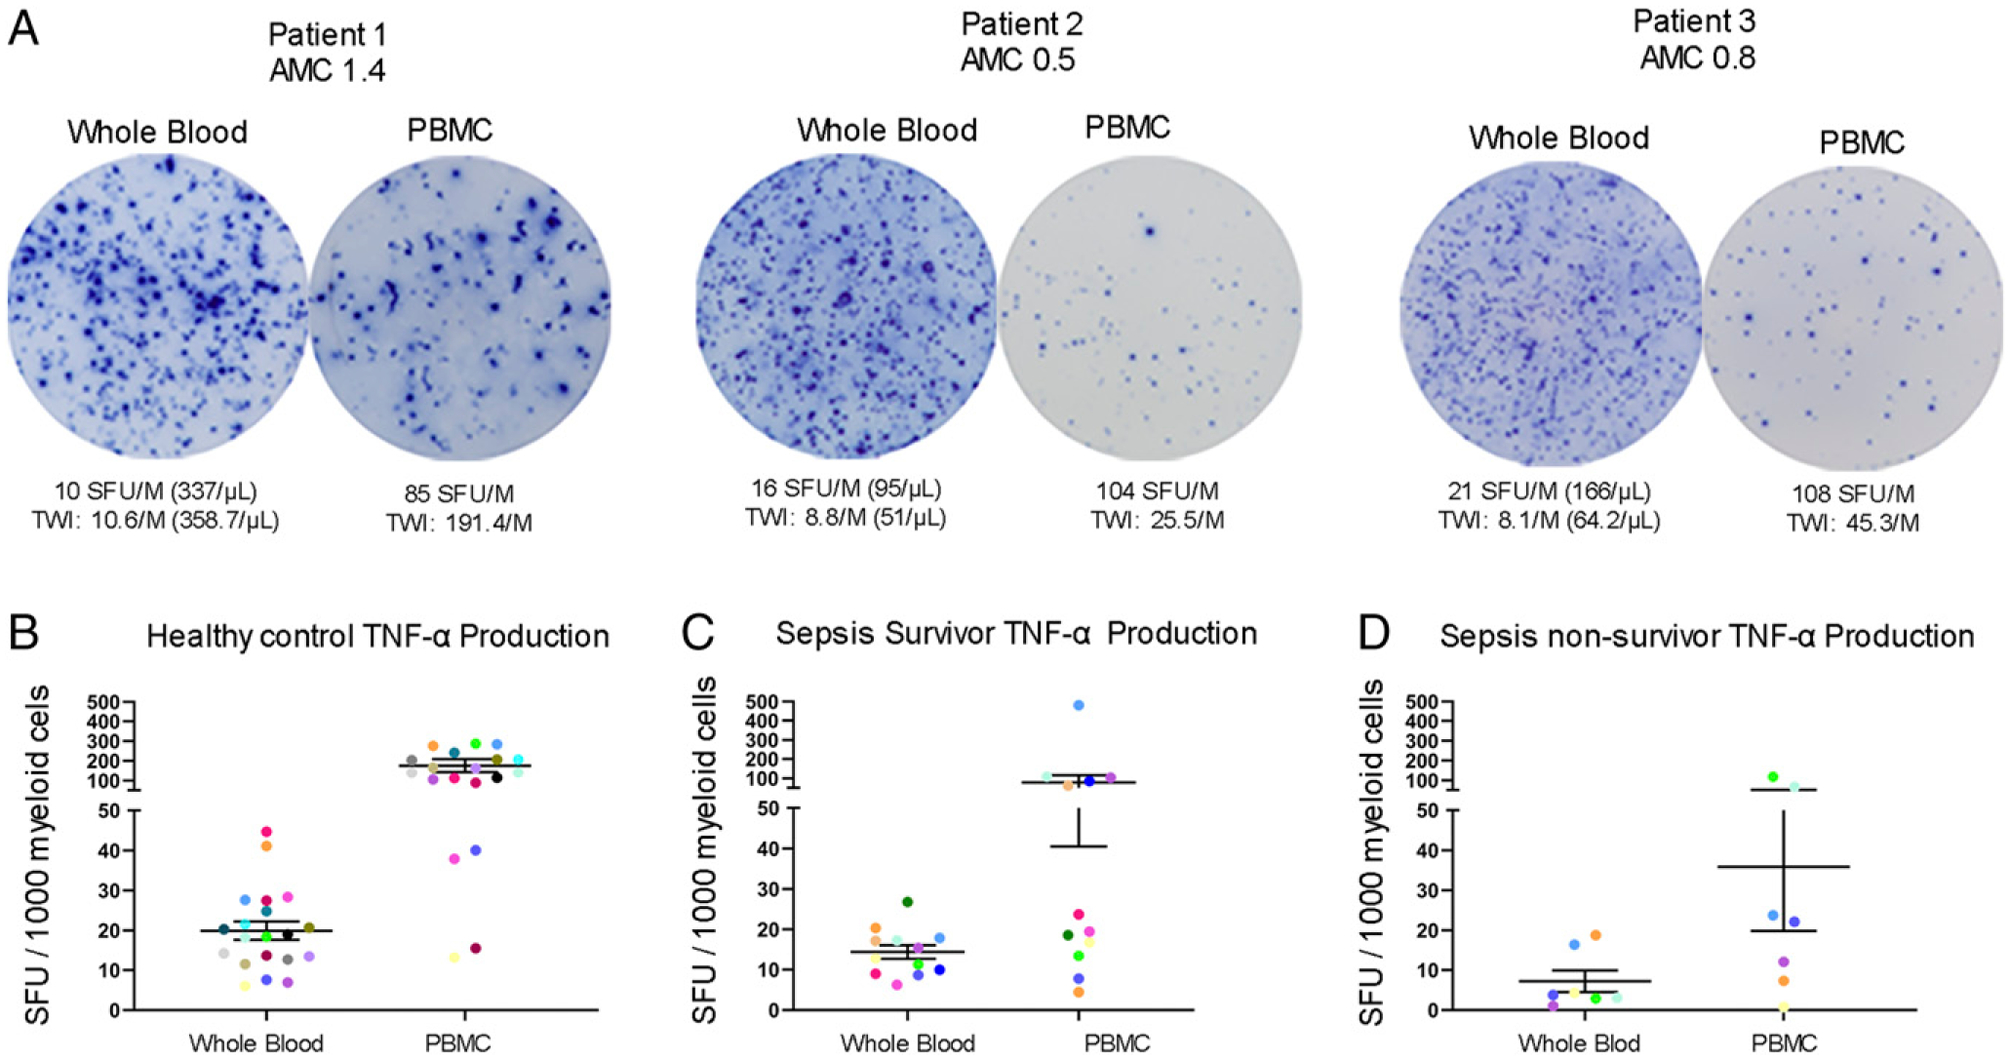
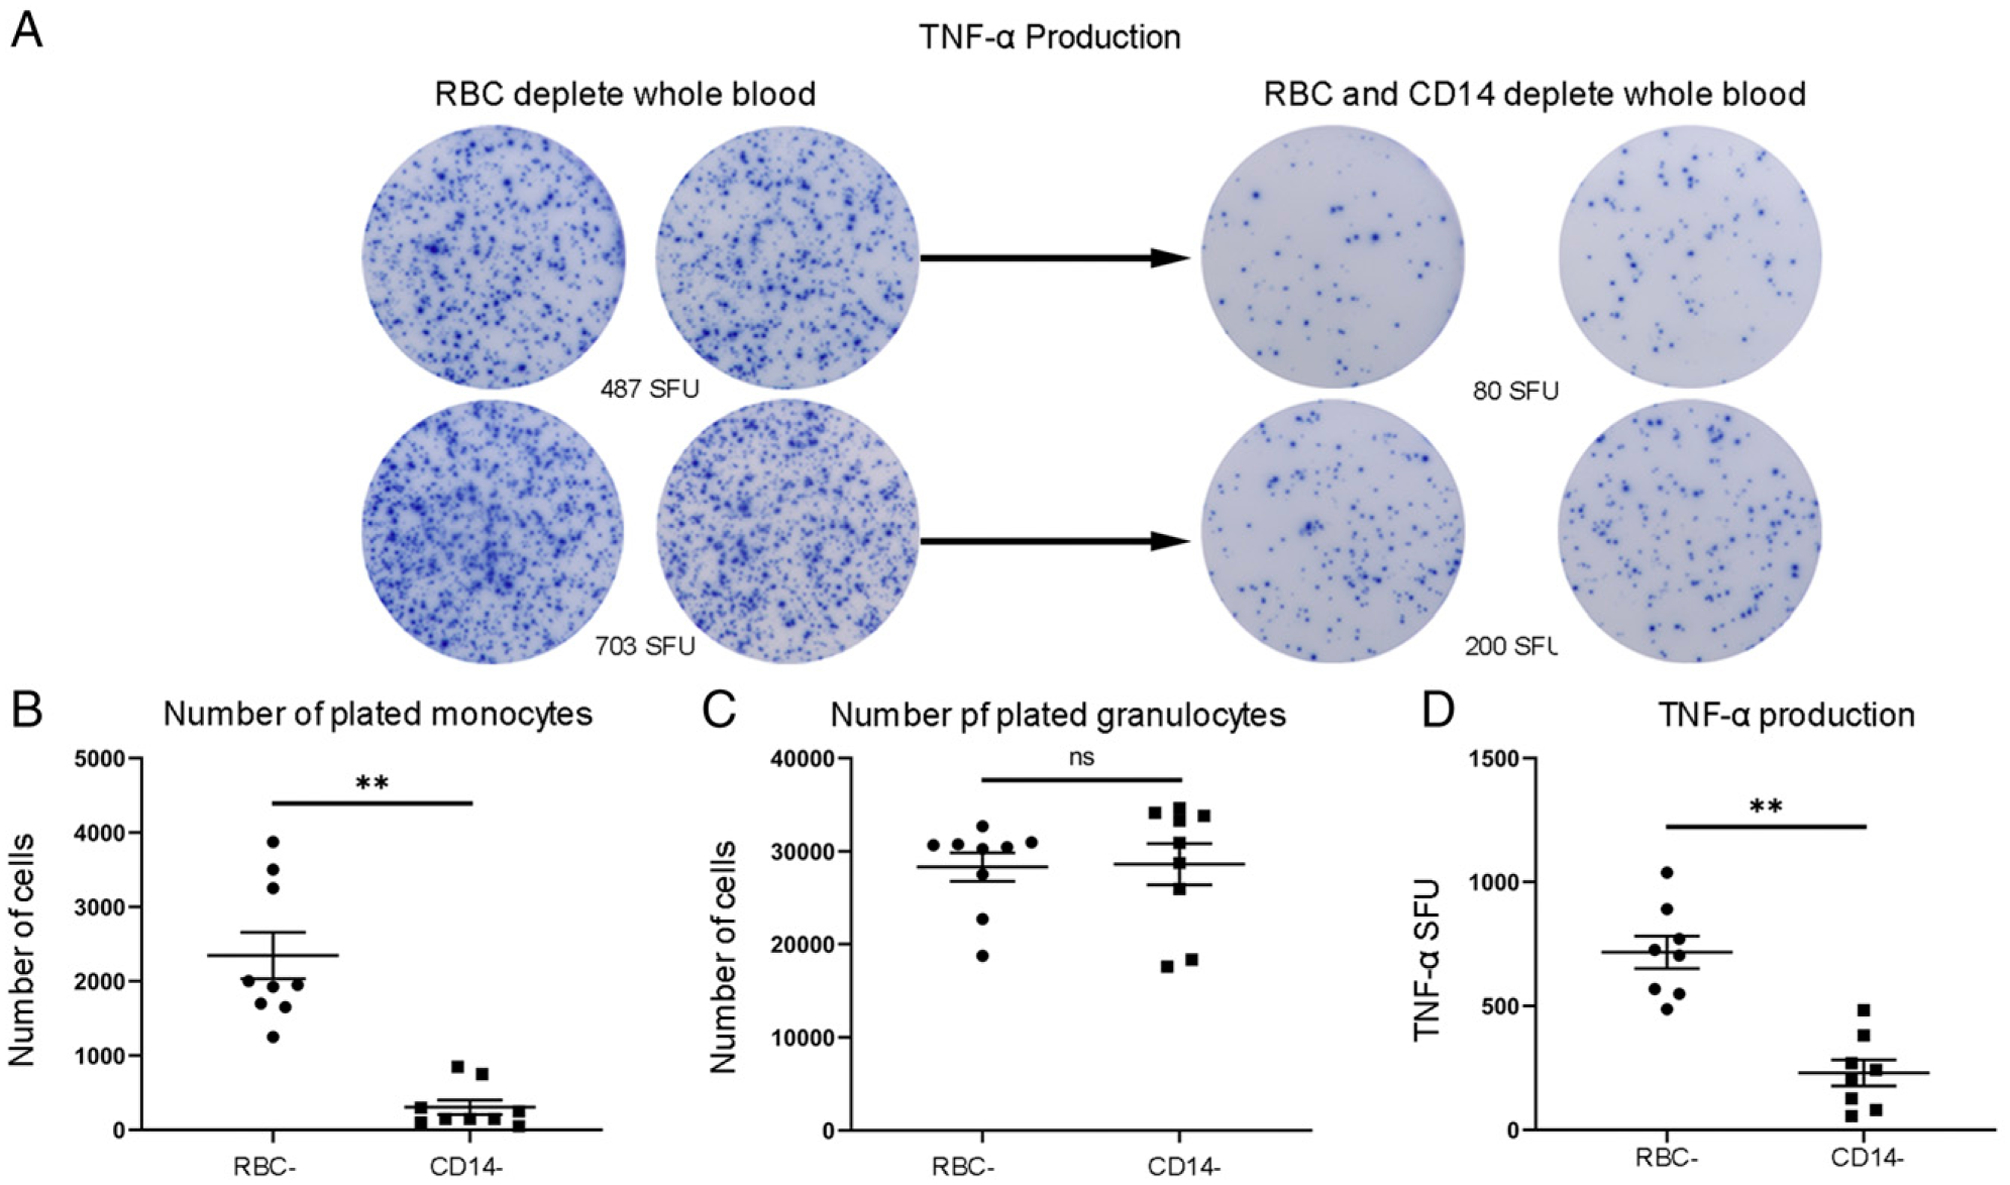
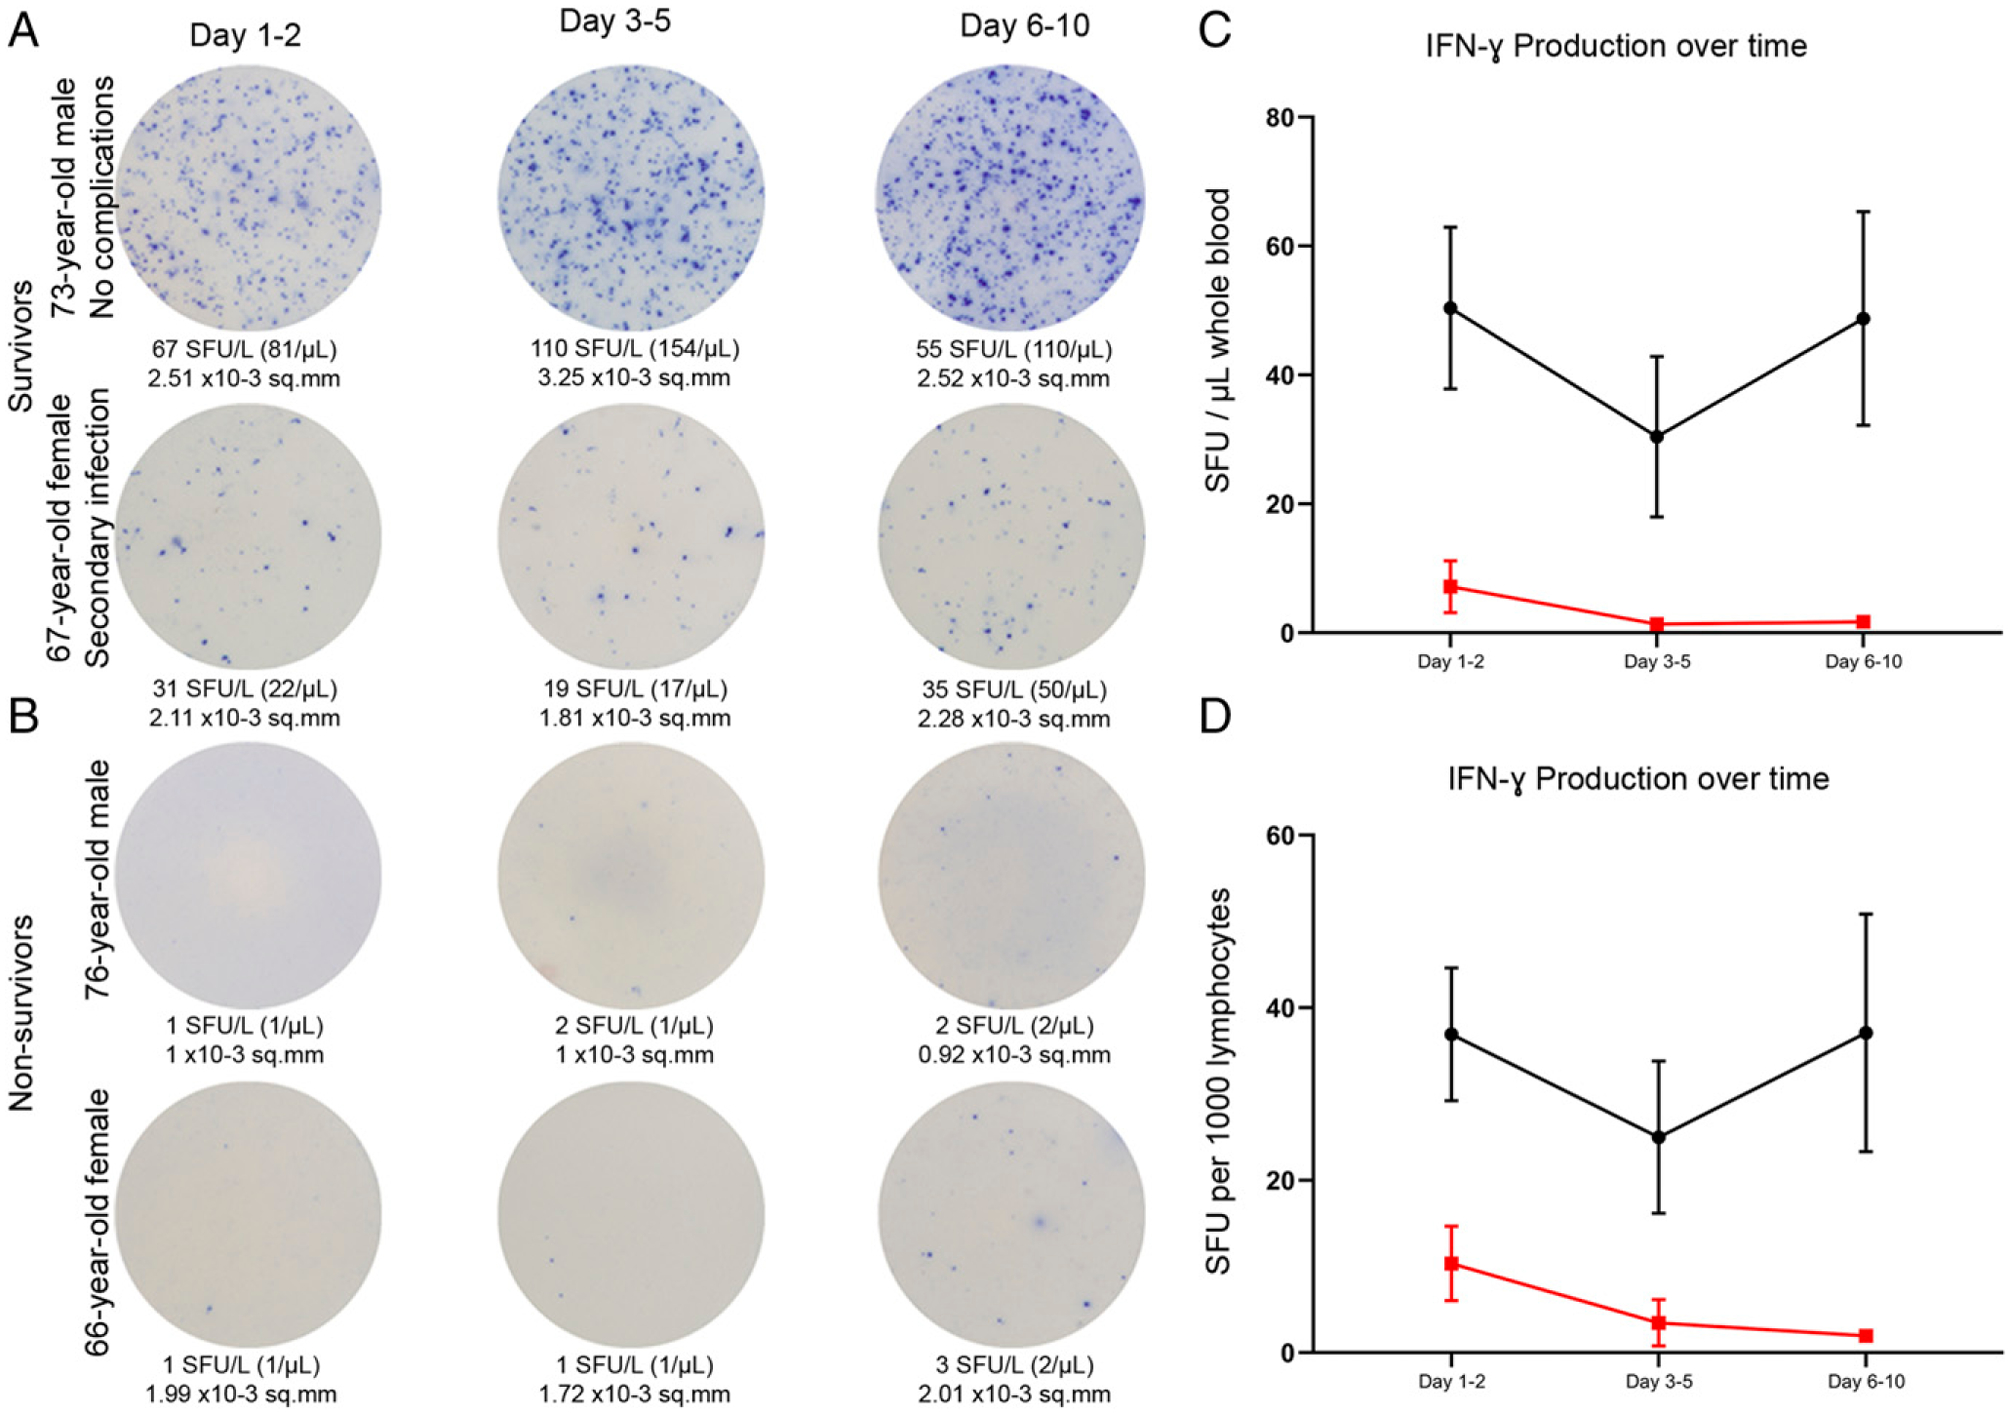
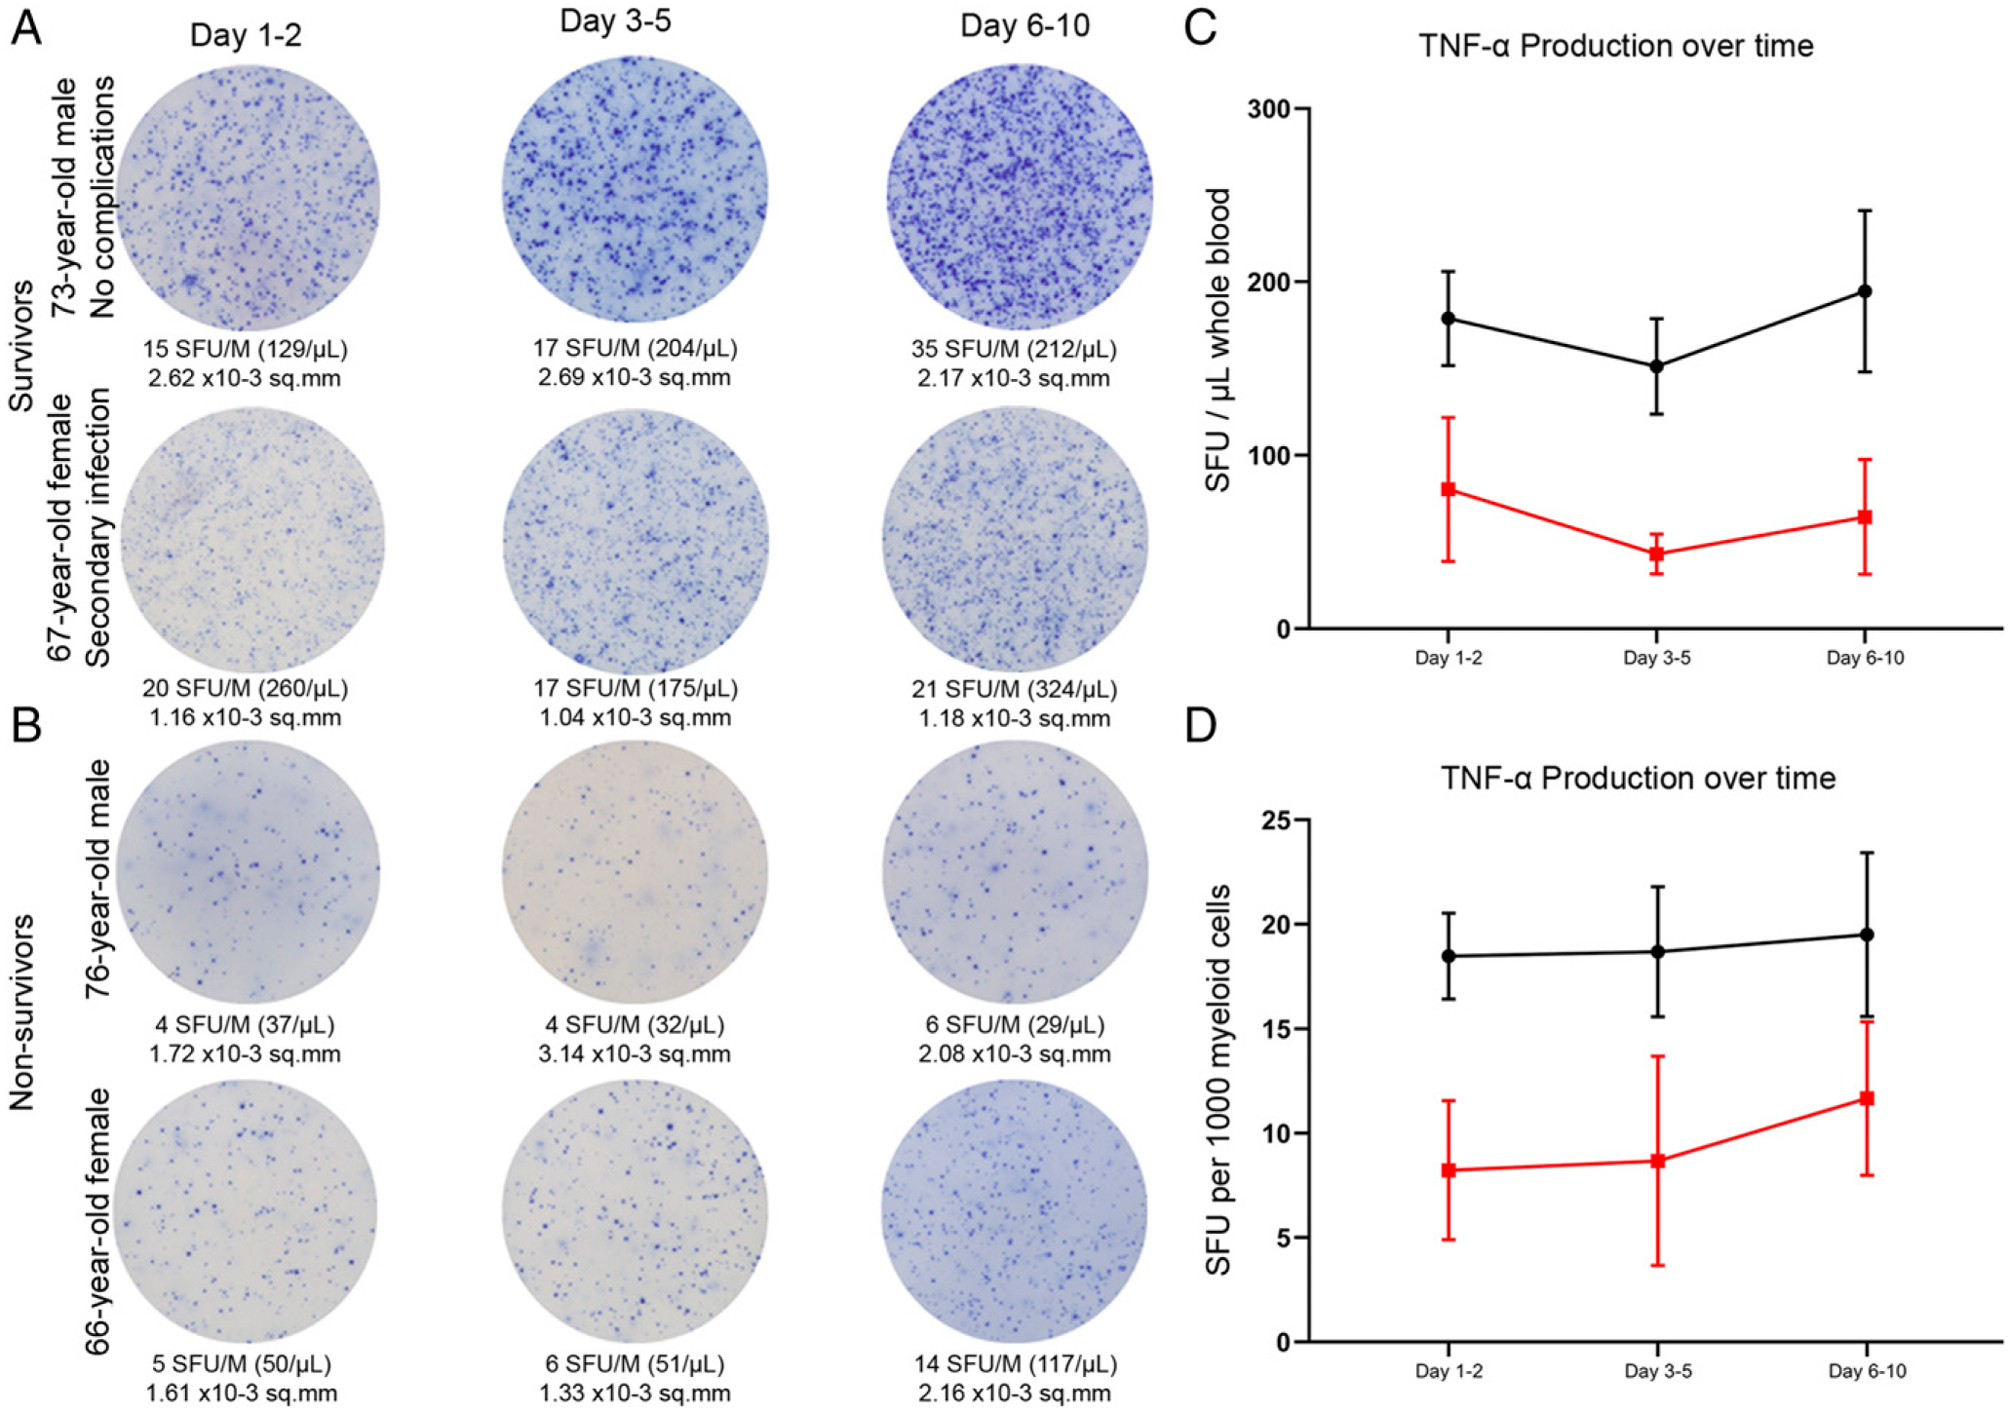
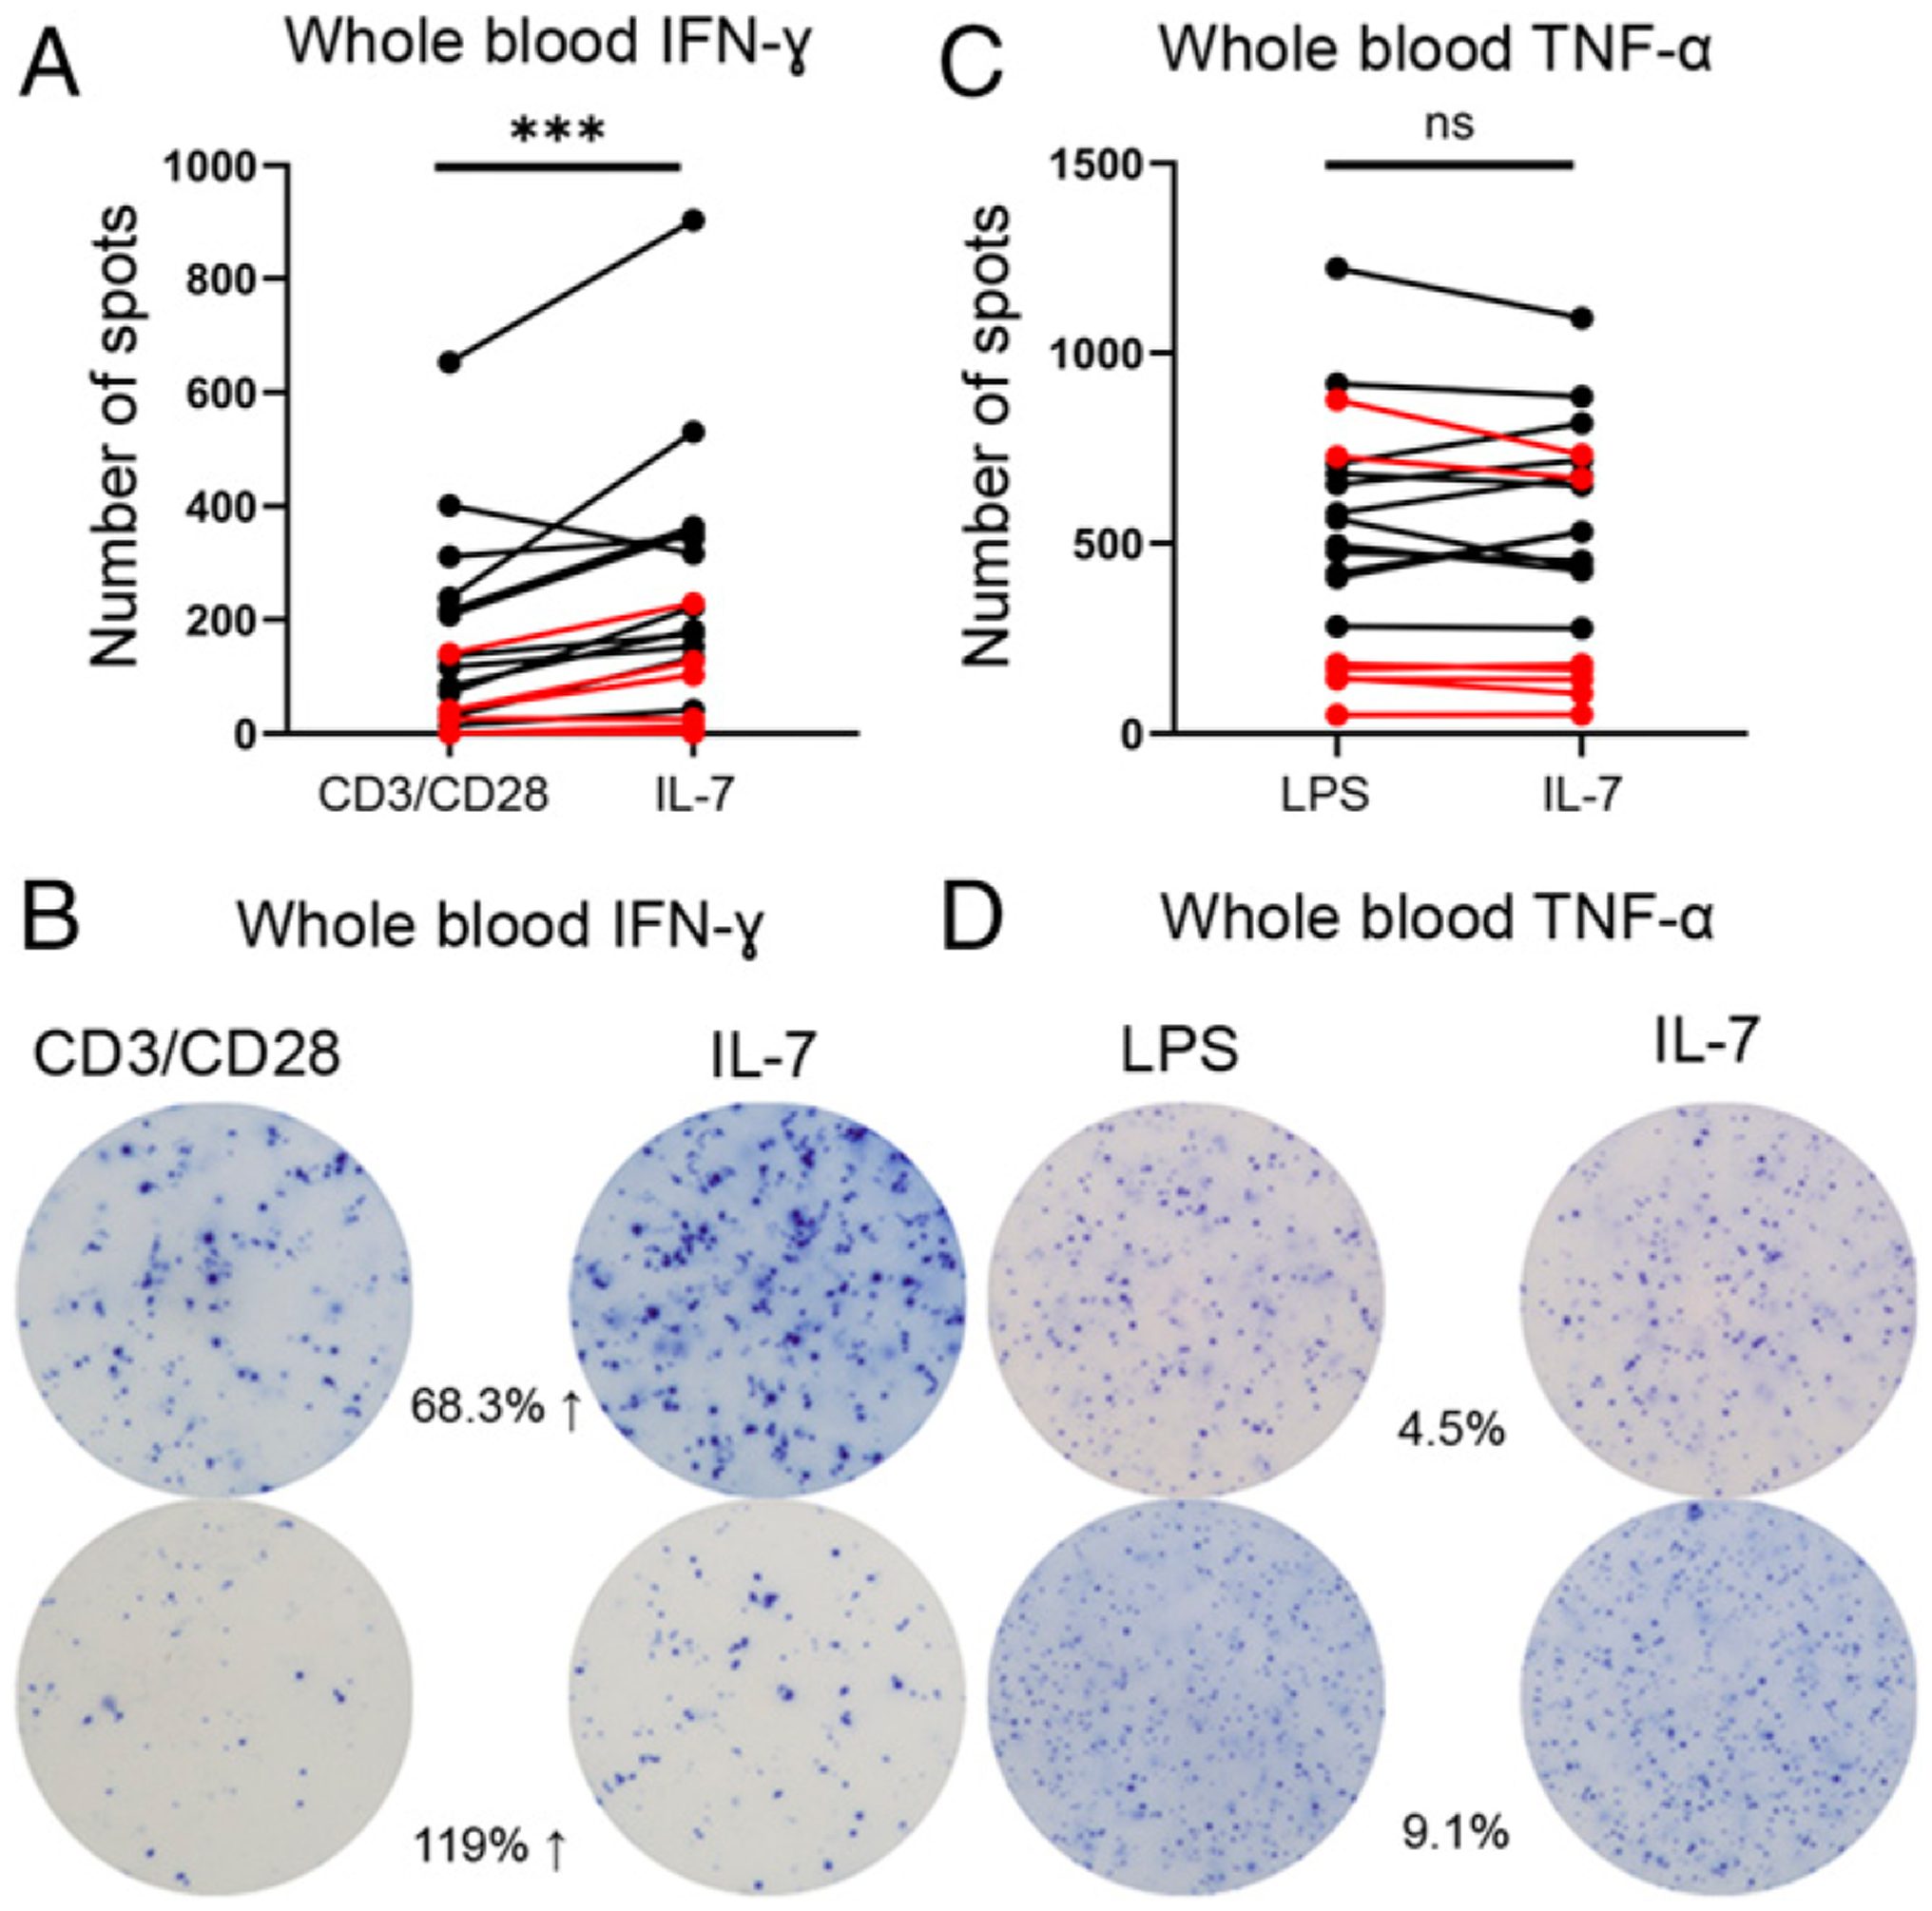
Sepsis initiates simultaneous pro- and anti-inflammatory processes, the pattern and intensity of which vary over time. The inability to evaluate the immune status of patients with sepsis in a rapid and quantifiable manner has undoubtedly been a major reason for the failure of many therapeutic trials. Although there has been considerable effort to immunophenotype septic patients, these methods have often not accurately assessed the functional state of host immunity, lack dynamic range, and are more reflective of molecular processes rather than host immunity. In contrast, ELISpot assay measures the number and intensity of cytokine-secreting cells and has excellent dynamic range with rapid turnaround. We investigated the ability of a (to our knowledge) novel whole blood ELISpot assay and compared it with a more traditional ELISpot assay using PBMCs in sepsis. IFN-γ and TNF-α ELISpot assays on whole blood and PBMCs were undertaken in control, critically ill nonseptic, and septic patients. Whole blood ELISpot was easy to perform, and results were generally comparable to PBMC-based ELISpot. However, the whole blood ELISpot assay revealed that nonmonocyte, myeloid populations are a significant source of ex vivo TNF-α production. Septic patients who died had early, profound, and sustained suppression of innate and adaptive immunity. A cohort of septic patients had increased cytokine production compared with controls consistent with either an appropriate or excessive immune response. IL-7 restored ex vivo IFN-γ production in septic patients. The whole blood ELISpot assay offers a significant advance in the ability to immunophenotype patients with sepsis and to guide potential new immunotherapies.


Conflict of interest statement

Disclosures

Patent pending for intellectual property for whole blood ELISpot immune phenotyping for R.S.H., M.B.M., C.C.C., I.R.T., K.E.R. The other authors have no financial conflicts of interest.

Figures

FIGURE 1.
FIGURE 1.
Unstimulated ex vivo production of IFN-γ and TNF-α in whole blood from septic patients using ELISpot assay. (A) Representative ELISpot images depicting IFN-γ production in media alone versus with CD3/CD28 Ab. (B) Graphic representation of n = 15 septic patient responses between unstimulated and stimulated ex vivo cytokine production of IFN-γ. (C) Representative ELISpot images depicting TNF-α production in media alone versus with LPS. (D) Graphic representation of n = 15 septic patient responses between unstimulated and stimulated ex vivo cytokine production of TNF-α. Red lines represent mortalities.
FIGURE 2.
FIGURE 2.
Spot number and TWI of CD3/CD28-stimulated IFN-γ–producing cells using whole blood ELISpot assay. Graphic representation comparing the differential cytokine production, in terms of the number of activated cells, in healthy control (n = 20), CINS (n = 6), sepsis survivors (n = 12), and sepsis nonsurvivors (n = 7). The number of cells is represented as SFU, and the quantity of cytokine production is represented as TWI. (A) Whole blood IFN-γ production as SFU per microliter of blood. (B) IFN-γ production as SFU per 1000 lymphocytes. (C) TWI per microliter of whole blood. (D) TWI per 1000 lymphocytes. Each ELISpot assay was performed in duplicates. Bars represent mean ± SEM. Group comparison using Kruskal–Wallis test with multiple comparisons corrected for FDR. Red dots represent mortalities. *p < 0.05, **p < 0.01.
FIGURE 3.
FIGURE 3.
Spot number and TWI of LPS-stimulated TNF-α–producing cells using whole blood ELISpot assay. Graphic representation comparing the differential cytokine production, in terms of the number of activated cells, in healthy control (n = 20), CINS (n = 6), sepsis survivors (n = 12), and sepsis nonsurvivors (n = 7). The number of cells is represented as SFU, and the quantity of cytokine production is shown as TWI. (A) Whole blood TNF-α production as SFU per microliter of blood. (B) TNF-α production as SFU per 1000 lymphocytes plated. (C) TWI per microliter of blood. (D) TWI per 1000 lymphocytes. Each ELISpot assay is performed in duplicates. Bars represent mean ± SEM. Group comparison using Kruskal–Wallis test with multiple comparisons corrected for FDR. Red dots represent mortalities. *p < 0.05, **p < 0.01, ***p < 0.001, ****p < 0.0001.
FIGURE 4.
FIGURE 4.
Comparison of T cell IFN-γ production in whole blood versus PBMCs ELISpot assay. (A) Representative figures depicting IFN-γ production of three individual patients using both whole blood and PBMC assays. (B–D) Dot plot graphs comparing data between whole blood and PBMC assays in healthy controls (n = 20), sepsis survivors (n = 12), and sepsis nonsurvivors (n = 7). Colored dots represent individual patients for comparison between assays. Each ELISpot assay was performed in duplicates. Bars represent mean ± SEM.
FIGURE 5.
FIGURE 5.
Comparison of myeloid cell TNF-α production in whole blood versus PBMCs ELISpot assay. (A) Representative figures depicting TNF-α production for three individual patients using both whole blood and PBMC assays. (B–D) Dot plot graphs compares data between whole blood and PBMC assays in healthy controls (n = 20), sepsis survivors (n = 12), and sepsis nonsurvivors (n = 7). Colored dots represent individual patients used for comparison between assays. Each ELISpot assay was performed in duplicates. Bars represent mean ± SEM.
FIGURE 6.
FIGURE 6.
TNF-α production in whole blood ELISpot assay following depletion of monocytes in healthy volunteers. (A) Graphic depiction representing TNF-α production in RBC-depleted blood versus RBC- and monocyte-depleted blood. (B) The number of monocytes plated per individual experiment (n = 9) for RBC-depleted blood and RBC- plus monocyte-depleted blood. (C) The number of granulocytes/neutrophils plated per individual experiment (n = 9) for RBC-depleted blood and RBC- plus monocyte-depleted blood. (D) The number of SFU for TNF-α production for RBC-depleted blood and RBC- plus monocyte-depleted blood. Statistical analysis using Wilcoxon ranked sum test. **p < 0.01.
FIGURE 7.
FIGURE 7.
Adaptive immune function timeline for the first 7–10 d following diagnosis of sepsis. Representative images show the change in whole blood production of CD3/CD28-stimulated IFN-γ over time in patients with sepsis who survived (A) and those who did not survive (B). (C) IFN-γ production as SFU/μl comparing sepsis survivors (black line) to sepsis nonsurvivors (red line) on days 1–2, 3–5, and 6–10. (D) IFN-γ production as SFU per 1000 lymphocytes. Dots represent mean value, and bars represent ±SEM.
FIGURE 8.
FIGURE 8.
Innate immune function timeline for the first 7–10 d following diagnosis of sepsis. Images show the change in whole blood production of LPS-stimulated TNF-α over time in patients with sepsis who survived (A) and those who did not survive (B). (C) TNF-α production as SFU/μl comparing sepsis survivors (black line) to sepsis nonsurvivors (red line) on days 1–2, 3–5, and 6–10. (D) TNF-α production as SFU per 1000 myeloid cells. Dots represent mean value, and bars represent ±SEM.
FIGURE 9.
FIGURE 9.
IFN-γ and TNF-α production in response to ex vivo IL-7 administration based on whole blood ELISpot assay in patients with sepsis. (A) Change in number of IFN-γ spots (SFU) in CD3/CD28 versus CD3/CD28 + IL-7–stimulated cultures (n = 19). (B) Representative ELISpot images showing the change in the number of IFN-γ spots in CD3/CD28 versus CD3/CD28 + IL-7–stimulated cultures. (C) Change in the number of TNF-α spots (SFU) in LPS versus LPS + IL-7–stimulated cultures (n = 19). (D) Representative ELISpot images showing the change in number of TNF-α spots in LPS versus LPS + IL-7–stimulated cultures. (A and C) The number of spots are the total number of spots per well and are not corrected for volume or cell number. Lines in red depict mortality. Statistical analysis performed using paired Wilcoxon ranked sum test. ***p < 0.001.

References

    1. Singer M, Deutschman CS, Seymour CW, Shankar-Hari M, Annane D, Bauer M, Bellomo R, Bernard GR, Chiche JD, Coopersmith CM, et al. 2016. The Third International Consensus definitions for sepsis and septic shock (Sepsis-3). JAMA 315: 801–810. - PMC - PubMed
    1. Venet F, and Monneret G. 2018. Advances in the understanding and treatment of sepsis-induced immunosuppression. Nat. Rev. Nephrol 14: 121–137. - PubMed
    1. Angus DC, and van der Poll T. 2013. Severe sepsis and septic shock. N. Engl. J. Med 369: 2063. - PubMed
    1. Hawkins RB, Raymond SL, Stortz JA, Horiguchi H, Brakenridge SC, Gardner A, Efron PA, Bihorac A, Segal M, Moore FA, and Moldawer LL. 2018. Chronic critical illness and the persistent inflammation, immunosuppression, and catabolism syndrome. Front. Immunol 9: 1511. - PMC - PubMed
    1. Martin MD, Badovinac VP, and Griffith TS. 2020. CD4 T cell responses and the sepsis-induced immunoparalysis state. Front. Immunol 11: 1364. - PMC - PubMed

Publication types