. 2020 Dec 8;117(49):31290-31300.
doi: 10.1073/pnas.2017053117. Epub 2020 Nov 25.

KRAB zinc finger protein diversification drives mammalian interindividual methylation variability

Affiliations

KRAB zinc finger protein diversification drives mammalian interindividual methylation variability

Tessa M Bertozzi et al. Proc Natl Acad Sci U S A. .

Abstract

Most transposable elements (TEs) in the mouse genome are heavily modified by DNA methylation and repressive histone modifications. However, a subset of TEs exhibit variable methylation levels in genetically identical individuals, and this is associated with epigenetically conferred phenotypic differences, environmental adaptability, and transgenerational epigenetic inheritance. The evolutionary origins and molecular mechanisms underlying interindividual epigenetic variability remain unknown. Using a repertoire of murine variably methylated intracisternal A-particle (VM-IAP) epialleles as a model, we demonstrate that variable DNA methylation states at TEs are highly susceptible to genetic background effects. Taking a classical genetics approach coupled with genome-wide analysis, we harness these effects and identify a cluster of KRAB zinc finger protein (KZFP) genes that modifies VM-IAPs in trans in a sequence-specific manner. Deletion of the cluster results in decreased DNA methylation levels and altered histone modifications at the targeted VM-IAPs. In some cases, these effects are accompanied by dysregulation of neighboring genes. We find that VM-IAPs cluster together phylogenetically and that this is linked to differential KZFP binding, suggestive of an ongoing evolutionary arms race between TEs and this large family of epigenetic regulators. These findings indicate that KZFP divergence and concomitant evolution of DNA binding capabilities are mechanistically linked to methylation variability in mammals, with implications for phenotypic variation and putative paradigms of mammalian epigenetic inheritance.

Keywords: DNA methylation; KRAB zinc finger proteins; VM-IAP; endogenous retrovirus; metastable epiallele.


Conflict of interest statement

The authors declare no competing interest.

Figures

Fig. 1.
Fig. 1.
Interindividual methylation variability at IAPs is strain specific. (A) B6 VM-IAPs are polymorphic across inbred mouse strains. All experimentally validated B6 VM-IAPs (18) were scored for presence (navy blue rectangles) or absence (light-blue rectangles) in the 129S1/SvlmJ and CAST/EiJ reference genomes. Instances in which a classification could not be made with confidence because of gaps in the reference sequences are shown in white. VM-IAPs are color coded according to their structure (full-length IAPs, blue; truncated IAPs, orange; solo LTRs, pink; key not drawn to scale). LTR subclass annotation, as defined by RepeatMasker, is indicated above each VM-IAP. VM-IAPs are named based on their closest coding gene. (B) DNA methylation levels in B6 (gray) and 129S2/Sv (purple) inbred mice of IAPs shared between the two strains. Some IAPs exhibit variable methylation (>10% variance across individuals) in both strains (left of dotted line); others are only variably methylated in B6 mice (right of dotted line). Methylation levels of the distal-most CpGs of the IAP 5′ LTRs were quantified from genomic DNA using bisulphite pyrosequencing. Each dot represents the average methylation level across CpGs for one individual.
Fig. 2.
Fig. 2.
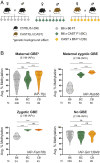
VM-IAP methylation levels are subject to maternal and zygotic genetic background effects (GBEs). (A) A reciprocal hybrid breeding scheme. BC F1 hybrids (green diamonds) were generated by breeding B6 (black) females with CAST (brown) males. CB F1 hybrids (yellow diamonds) were produced from the reciprocal cross of CAST females and B6 males. (B) VM-IAPs classified based on their susceptibility to maternal GBEs (Upper Left), maternal zygotic GBEs (Upper Right), zygotic GBEs (Lower Left), or neither (Lower Right). The violin plots represent the B6 (gray), BC (green), and CB (yellow) F1 offspring methylation distributions. The dotted and dashed lines show the distribution quartiles and median, respectively. The faint hollow circles represent individual-specific methylation levels, quantified from genomic DNA and averaged across the distal CpGs of the VM-IAP 5′ LTR. B6, BC, and CB methylation levels were compared for each VM-IAP using the Kruskal-Wallis test followed by Dunn’s post hoc multiple comparison test. The sample sizes are shown below each graph. Graphs for the eight additional VM-IAPs analyzed in this experiment can be found in SI Appendix, Fig. S2. ****P < 0.0001; ns, not significant
Fig. 3.
Fig. 3.
Strain-specific IAP-Rab6b hypermethylation is driven by a single dominant modifier locus on chromosome 4. (A) Genetic backcrossing uncovers a Mendelian inheritance pattern of IAP-Rab6b methylation states. F1 BC males were backcrossed to B6 females to produce the first backcrossed generation (N1). Three highly methylated (red) and three lowly methylated (gray) N1 males were backcrossed to B6 females to produce the N2 generation, and highly methylated N2 males were once again backcrossed to B6 females to produce the N3 generation. The average percent CAST DNA remaining in the genome at each generation is indicated under the graph. A cutoff value of 60% methylation was used to classify individuals as highly (red) or lowly (gray) methylated. (B) Pedigree illustrating the inheritance patterns of IAP-Rab6b methylation states. The percentages reflect the data in A. (C) Genetic mapping of the modifier locus to a 7.3-Mb interval on distal chromosome 4 using the GigaMUGA SNP microarray. A map is shown of heterozygous SNPs along the chromosome that are informative between B6 and CAST in 20 N3 individuals (full set of individuals shown in SI Appendix, Fig. S4). The heterozygous SNPs shared among all highly methylated N3 individuals and absent from all lowly methylated N3 individuals are shown in blue. The corresponding mapped region is highlighted in yellow. (D) An expanded view of the 2.5-Mb KZFP cluster located within the mapped interval. Sequence gaps in the current reference genome (GRCm38/mm10) are displayed as black boxes above the annotated genes. The stripped region represents the portion of DNA excluded by our independent analysis of N2 individuals using the MiniMUGA SNP microarray. The KZFP genes are bolded. Annotations were lifted from the University of California Santa Cruz Gencode V24 track.
Fig. 4.
Fig. 4.
The KZFP cluster Chr4-cl modulates the methylation state of multiple VM-IAPs. (A) A cross-locus comparison of N2 methylation states. The methylation levels were quantified at IAP-Tmprss11d, IAP-Pink1, IAP-Ect2l, IAP-Rps12, IAP-Trbv31, IAP-Sema6d, IAP-Gm20110, and IAP-Fam78b in 20 N2 individuals. The IAP-Rab6b methylation level had previously been determined to be high (>60%, red) or low (<60%, gray). The red dashed and gray dotted lines connect the average methylation values of N2 individuals across regions. The percent sequence identity to IAP-Rab6b, as determined by the BLAST-like alignment tool (BLAT) (46), is shown for each locus above the x-axis. (B) Alignment of VM-IAP LTR sequences in the region displaying divergence between Chr4-cl targets and nontargets. Contraoriented elements were reverse complemented (rc) prior to generating the alignment. The dots represent conserved bases, dashes indicate lack of sequence, and divergent bases are shown in blue. The full-length alignment can be found in SI Appendix, Fig. S5. (C) Methylation quantification of genomic DNA extracted from Chr4-cl WT mice (gray circles) and Chr4-cl KO mice (hollow gray circles) on a pure B6 genetic background. (D) A diagram of the Chr4-cl KO location (Chr4:145383918–147853419, GRCm38/mm10) and breeding scheme used for the data presented in D and E. The Chr4-cl KO was generated in B6 mice, which were subsequently backcrossed to the 129 × 1/SvJ strain. (E) The methylation quantification of genomic DNA extracted from Chr4-cl WT mice (purple circles) and Chr4-cl KO mice (hollow purple circles) on a mixed B6/129 F2 genetic background. IAP-Sema6d was excluded from this analysis because it is absent from the 129 genome (Fig. 1A). Statistics for D and E: unpaired t tests with false discovery rate of 5% computed using the two-stage step-up method of Benjamini, Krieger, and Yekutieli. *q < 0.05; **q < 0.01; ****q < 0.0001.
Fig. 5.
Fig. 5.
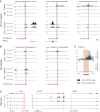
Chr4-cl influences the chromatin and transcriptional landscape at and near targeted VM-IAPs. (A) H3K9me3 and H3K4me3 ChIP-seq signal at Chr4-cl target VM-IAPs in Chr4-cl WT (black) and KO (blue) ES cells of mixed B6/129 genetic background. BAM coverage tracks were generated and visualized in IGV. VM-IAPs are shown in red, and directionality is indicated with a white arrow. The NCBI37/mm9 genome coordinates and neighboring annotated genes are displayed above and below the ChIP-seq tracks, respectively. (B) As in A, but for nontarget VM-IAPs. (C) The mean H3K4me3 ChIP-seq signal over the seven confirmed Chr4-cl targets (Upper) and over all solo LTRs of the IAPLTR2_Mm subclass in the mouse genome (Lower). The dotted lines represent the mean signal, and the shaded regions represent error estimates (SE and 95% CI). Plots were generated using SeqPlots software (47). (D) The RNA-sequencing signal from Chr4-cl WT (black) and KO (blue) ES cells of mixed B6/129 genetic background for the genes Pink1 (upstream of IAP-Pink1), Slco2A1 (upstream of IAP-Rab6b), and Rab6b (downstream of IAP-Rab6b). Two biological replicates per genotype are shown. Datasets were downloaded from the Gene Expression Omnibus database (accession numbers are listed in Dataset S1, Table S6).
Fig. 6.
Fig. 6.
The methylation variability at IAPLTR2_Mm elements is sequence driven. (A) A neighbor-joining tree of all solo LTR IAPs of the IAPLTR2_Mm subclass in the B6 genome between 200 and 800 bp in length. The solo LTR sequences were aligned using MUSCLE software, and the neighbor-joining tree was built using Geneious Prime software. The navy blue and orange nodes represent experimentally validated VM-IAPs and nonvariable IAPs, respectively. The VM-IAP–enriched subtree, containing all known IAPLTR2_Mm VM-IAPs (navy), is shown in greater resolution and labeled with GRC38/mm10 genomic coordinates and strandedness. (B) The methylation quantification of genomic DNA from eight B6 individuals at five solo LTRs in the VM-IAP–enriched subtree (orange). The percent sequence identity to IAP-Rab6b is shown above the x-axis for each IAP.
Fig. 7.
Fig. 7.
The VM-IAP–enriched subtree exhibits H3K4 trimethylation and distinct KZFP binding. (A) Heatmaps of H3K4me3 ChIP-seq coverage in Chr4-cl WT (Left) and KO (Right) ES cells of mixed B6/129 genetic background over all solo LTRs of the IAPLTR2_Mm subclass (n = 556). VM-IAPs and IAPs belonging to the VM-IAP–enriched subtree were clustered for the analysis. All solo LTRs are anchored from their 5′ start to their 3′ end, with a pseudolength of 500 bp. The analysis was extended to 500 bp up- and downstream of each element. The average read coverage is plotted above each heatmap. The dotted lines represent the mean signal, and the shaded regions represent error estimates (SE and 95% CI). The plots and heatmaps were created using SeqPlots (47). (B) Heatmaps of overexpressed ZFP989-HA (Left), Gm21082-FLAG (Middle), and ZFP429-HA (Right) ChIP-seq coverage in F9 EC cells over all solo LTRs of the IAPLTR2_Mm subclass (n = 556). The plotting settings were as in A.

References

    1. Shorter J. R., et al. , A diallel of the mouse collaborative cross founders reveals strong strain-specific maternal effects on litter size. G3 (Bethesda) 9, 1613–1622 (2019). - PMC - PubMed
    1. Odet F., et al. , The founder strains of the collaborative cross express a complex combination of advantageous and deleterious traits for male reproduction. G3 (Bethesda) 5, 2671–2683 (2015). - PMC - PubMed
    1. Sapienza C., Paquette J., Tran T. H., Peterson A., Epigenetic and genetic factors affect transgene methylation imprinting. Development 107, 165–168 (1989). - PubMed
    1. Allen N. D., Norris M. L., Surani M. A., Epigenetic control of transgene expression and imprinting by genotype-specific modifiers. Cell 61, 853–861 (1990). - PubMed
    1. Engler P., et al. , A strain-specific modifier on mouse chromosome 4 controls the methylation of independent transgene loci. Cell 65, 939–947 (1991). - PubMed

Publication types

LinkOut - more resources