. 2021 Feb 15;95(4):e01247-20.
doi: 10.1128/JVI.01247-20. Epub 2020 Nov 25.

The XPB Subunit of the TFIIH Complex Plays a Critical Role in HIV-1 Transcription and XPB Inhibition by Spironolactone Prevents HIV-1 Reactivation from Latency

Affiliations

The XPB Subunit of the TFIIH Complex Plays a Critical Role in HIV-1 Transcription and XPB Inhibition by Spironolactone Prevents HIV-1 Reactivation from Latency

Luisa Mori et al. J Virol. .

Abstract

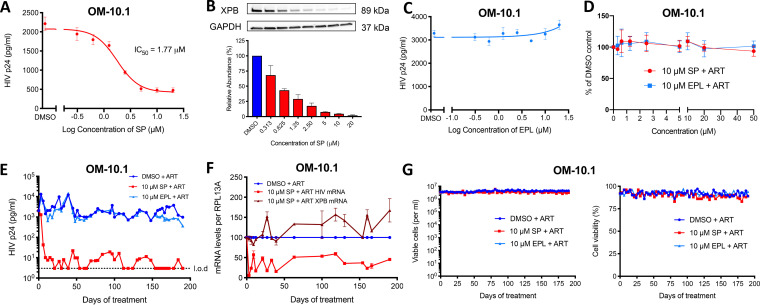
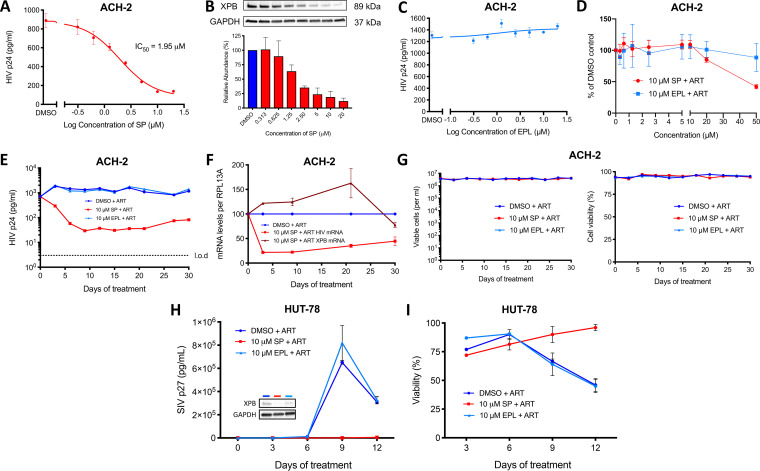
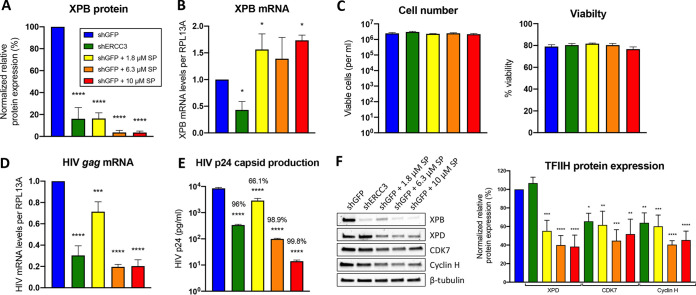
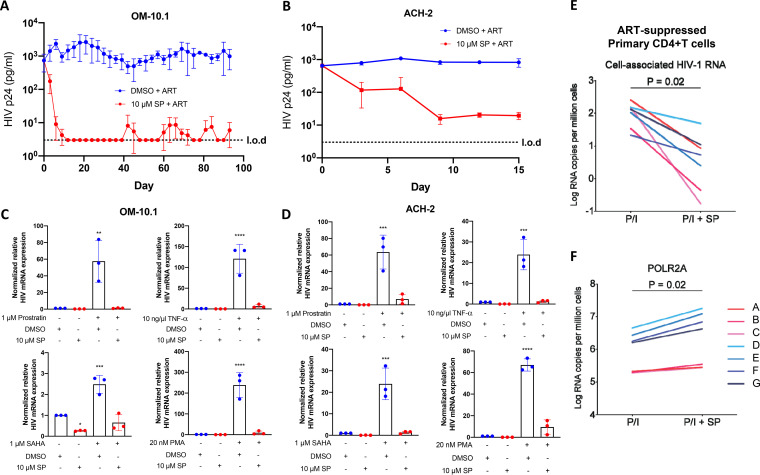
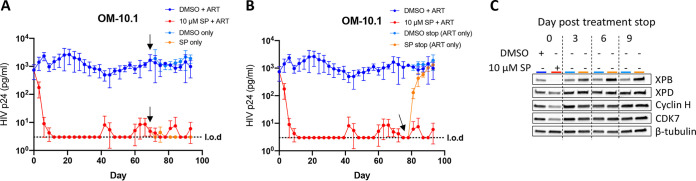
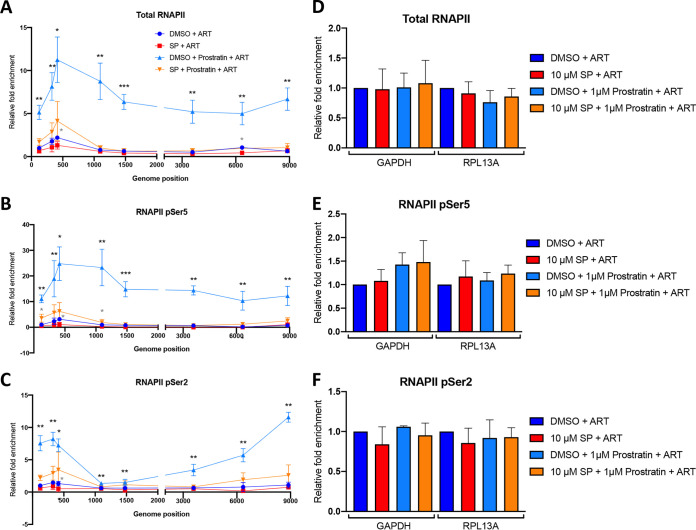
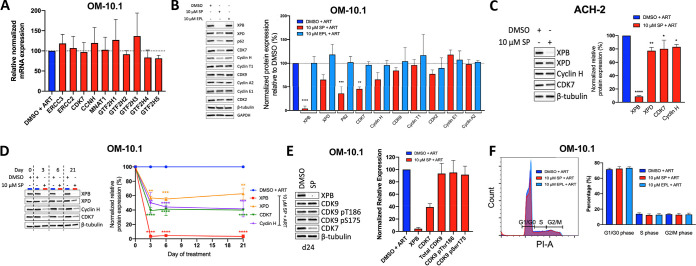
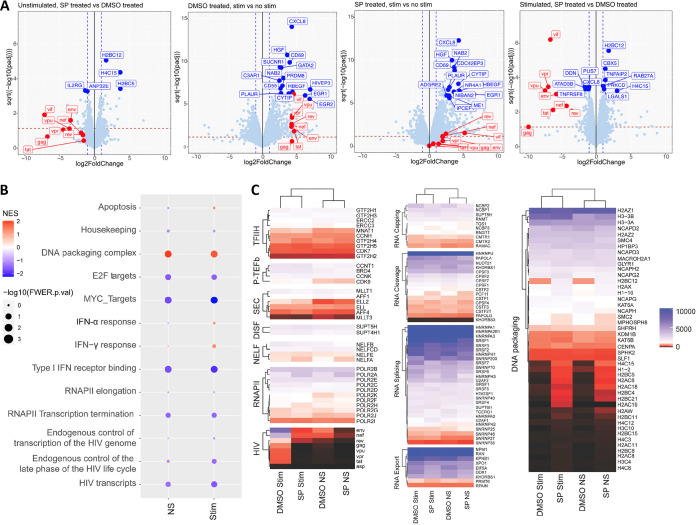
HIV transcription requires assembly of cellular transcription factors at the HIV-1promoter. The TFIIH general transcription factor facilitates transcription initiation by opening the DNA strands around the transcription start site and phosphorylating the C-terminal domain for RNA polymerase II (RNAPII) for activation. Spironolactone (SP), an FDA approved aldosterone antagonist, triggers the proteasomal degradation of the XPB subunit of TFIIH, and concurrently suppresses acute HIV infection in vitro Here we investigated SP as a possible block-and-lock agent for a functional cure aimed at the transcriptional silencing of the viral reservoir. The long-term activity of SP was investigated in primary and cell line models of HIV-1 latency and reactivation. We show that SP rapidly inhibits HIV-1 transcription by reducing RNAPII recruitment to the HIV-1 genome. shRNA knockdown of XPB confirmed XPB degradation as the mechanism of action. Unfortunately, long-term pre-treatment with SP does not result in epigenetic suppression of HIV upon SP treatment interruption, since virus rapidly rebounds when XPB reemerges; however, SP alone without ART maintains the transcriptional suppression. Importantly, SP inhibits HIV reactivation from latency in both cell line models and resting CD4+T cells isolated from aviremic infected individuals upon cell stimulation with latency reversing agents. Furthermore, long-term treatment with concentrations of SP that potently degrade XPB does not lead to global dysregulation of cellular mRNA expression. Overall, these results suggest that XPB plays a key role in HIV transcriptional regulation and XPB degradation by SP strengthens the potential of HIV transcriptional inhibitors in block-and-lock HIV cure approaches.IMPORTANCE Antiretroviral therapy (ART) effectively reduces an individual's HIV loads to below the detection limit, nevertheless rapid viral rebound immediately ensues upon treatment interruption. Furthermore, virally suppressed individuals experience chronic immune activation from ongoing low-level virus expression. Thus, the importance of identifying novel therapeutics to explore in block-and-lock HIV functional cure approaches, aimed at the transcriptional and epigenetic silencing of the viral reservoir to block reactivation from latency. We investigated the potential of repurposing the FDA-approved spironolactone (SP), as one such drug. SP treatment rapidly degrades a host transcription factor subunit, XPB, inhibiting HIV transcription and blocking reactivation from latency. Long-term SP treatment does not affect cellular viability, cell cycle progression or global cellular transcription. SP alone blocks HIV transcription in the absence of ART but does not delay rebound upon drug removal as XPB rapidly reemerges. This study highlights XPB as a novel drug target in block-and-lock therapeutic approaches.


Figures

FIG 1
FIG 1
SP treatment inhibits latent HIV-1 transcription in the OM-10.1 cell line model of latency. (A) OM-10.1 cells were treated with ART and the indicated concentrations of SP for 72 h, after which the amount of HIV capsid was measured in the supernatant by p24 ELISA. The IC50 value was calculated using GraphPad Prism. The line represents the mean of three independent experiments, each with three technical replicates. Error bars represent SD. (B) Cells treated in panel A were collected for Western blotting analysis with the indicated antibodies. Protein abundance was calculated by normalization to GAPDH levels and plotted relative to the DMSO control. A representative blot is shown above the quantification of three independent experiments. Error bars represent SD. (C) OM-10.1 cells were treated with ART and the indicated concentrations of EPL for 72 h, and the IC50 values were calculated as in panel A. (D) Cytotoxicity of SP- (red) and EPL-treated (blue) cells in OM-10.1 cells treated for 72 h with increasing concentrations of SP was measured using an MTT assay and plotted as a percentage of the DMSO control. Error bars represent SD from three independent experiments. (E) OM-10.1 cells were split and treated every 72 h in the presence of ART with 10 μM SP (red), EPL (light blue), or vehicle only (DMSO, dark blue). HIV capsid production was quantified by p24 ELISA. The dotted black line at 3 pg/ml represents the limit of detection (LOD). This plot is representative of three independent experiments. (F) Cell-associated HIV mRNA levels (red) and ERCC3 (XPB) mRNA levels (brown) were measured at multiple time points during the long-term treatments of OM-10.1 with 10 μM SP in panel E. cDNA was prepared from RNA extracted from cells pellets and qPCR performed with primers in the Nef region. The results were normalized as the number of viral mRNA copies per RPL13A mRNA and plotted relative to those of the DMSO-treated control (blue, set to 100% for each time point). Error bars represent SD from the qPCR. (G) The number of viable cells per milliliter of culture (left) and percentage viable cells (right), respectively, were measured by trypan blue staining and an automated cell counter every 72 h during the long-term treatments of OM-10.1 cells with 10 μM SP, 10 μM EPL, or DMSO only.
FIG 2
FIG 2
Tat-TAR-independent inhibition of the ACH-2 T cell model of HIV latency and suppression of SIV infection with SP treatment. (A) ACH-2 cells were treated with ART and the indicated concentrations of SP for 72 h, after which the amount of HIV capsid was measured in the supernatant by p24 ELISA. The IC50 value was calculated using GraphPad Prism. The line represents the mean of three independent experiments, each with three technical replicates. Error bars represent SD. (B) Cells treated in panel A were collected for Western blotting analysis with the indicated antibodies. Protein abundance was calculated by normalization to GAPDH levels and plotted relative to that of the DMSO control. A representative blot is shown above the quantification of three independent experiments. Error bars represent SD. (C) ACH-2 cells were treated with ART and the indicated concentrations of EPL for 72 h, and the IC50 values were calculated as in panel A. (D) Cytotoxicity of SP- (red) and EPL-treated (blue) cells in ACH-2 cells treated for 72 h with increasing concentrations of SP was measured using an MTT assay and plotted as a percentage of the DMSO control. Error bars represent SD from three independent experiments. (E) ACH-2 cells were split and treated every 72 h in the presence of ART with 10 μM SP (red), EPL (light blue), or vehicle only (DMSO, dark blue). HIV capsid production was quantified by p24 ELISA. The dotted black line at 3 pg/ml represents the limit of detection (LOD). This plot is representative of three independent experiments. (F) Cell-associated HIV mRNA levels (red) and ERCC3 (XPB) mRNA levels (dark red) were measured at multiple time points during the long-term treatments of ACH-2 cells with 10 μM SP in panel E. cDNA was prepared from RNA extracted from cells pellets and qPCR performed with primers in the Nef region. The results were normalized as the number of viral mRNA copies per RPL13A mRNA and plotted relative to the DMSO-treated control (blue, set to 100% for each time point). Error bars represent SD from the qPCR. (G) The number of viable cells per milliliter of culture (left) and percentage viable cells (right), respectively, were measured by trypan blue staining and an automated cell counter every 72 h during the long-term treatments of ACH-2 cells with 10 μM SP, 10 μM EPL, or DMSO only. (H) HUT-78 cells were infected with SIV239 in the presence of 10 μM SP or 10 μM EPL (or vehicle only, DMSO). Capsid production was monitored over time by p27 ELISA. Inset is a representative Western blot of XPB protein expression 12 days postinfection; the housekeeping gene GAPDH is included as a loading control. (I) Viability of the HUT-78 cells in panel H was measured by trypan blue staining using an automated cell counter. Error bars represent SD of two independent experiments.
FIG 3
FIG 3
shRNA knockdown of the XPB gene, ERCC3, results in similar levels of HIV-1 inhibition in OM-10.1 cells. OM-10.1 cells were transduced with pLKO.1 puro lentiviral vector expressing either a control shRNA targeting GFP mRNA or an ERCC3 (XPB) shRNA. shGFP-transduced cells were also treated with 1.8 μM (IC50), 6.3 μM (IC90), and 10 μM SP. After 10 days of puromycin selection in the presence of ART and DMSO or indicated concentrations of SP, cells were harvested for Western blotting, p24 ELISA, and RT-qPCR analysis. (A) Quantification of the XPB Western blots from three independent experiments. XPB expression was normalized to β-tubulin expression and plotted as a percentage of the shGFP control. (B) ERCC3 (XPB) mRNA levels were measured by synthesizing cDNA from cell-associated RNA from transduced cells followed by RT-qPCR. Expression was normalized to RPL13A levels and plotted relative to the shGFP control. (C) The number of viable cells (left) and percentage of viable cells (right) were determined using trypan blue staining and an automated hemocytometer. (D) Cell-associated HIV mRNA levels were quantified by RT-qPCR and normalized to RPL13A expression. Levels were plotted relative to the shGFP control. (E) The amount of HIV p24 capsid protein released into the supernatant of transduced OM-10.1 cells were measured by p24 ELISA. (F) In the left panel, a representative Western blot of indicated proteins from 3 independent experiments. The housekeeping gene β-tubulin was included as a loading control. In the right panel, quantification of the XPD, CDK7, and cyclin H Western blots, respectively, from three independent experiments. Protein expression was normalized to the respective housekeeping gene expression and plotted as a percentage relative to the shGFP control. Error bars represent the SD from three independent experiments. *, P < 0.05; **, P < 0.01; ***, P < 0.001; ****, P < 0.0001. NS unless indicated. One-way ANOVA followed by the Dunnett multiple-comparison test.
FIG 4
FIG 4
SP treatment blocks HIV reactivation. (A) OM-10.1 cells were treated for 93 days with ART and 10 μM SP or DMSO. Every 3 days, the cells were split, treated, and the amount of p24 capsid released into the supernatant of each culture was measured by p24 ELISA. (B) ACH-2 cells were treated for 15 days with ART plus 10 μM SP or DMSO and treated as for OM-10.1 cells above panel A. (C) After 45 days of treatment, OM-10.1 cells from panel A were set aside from each long-term treatment with ART and 10 μM SP (red) or DMSO (blue) and were stimulated with the indicated concentrations of LRAs for 8 h. The amount of cell-associated HIV mRNA was determined by RT-qPCR, normalized to RPL13A levels, and plotted relative to the unstimulated DMSO control. (D) The same was done on day 15 of long-term ACH-2 treatments with ART and 10 μM SP or DMSO (shown in panel B). (E) Resting CD4+ T cells from 18 ART-treated, virally suppressed individuals living with HIV were isolated from whole PBMCs. Individuals had to have been on ART for >1 year with no “blips” in viral load in the past 6 months. Cells were treated with SP for 24 h in the presence of the fusion inhibitor, T20, to prevent new rounds of infection. In the final 6 h of treatment, cells were subjected to stimulation with PMA + ionomycin. The amount of HIV-1 RNA was measured per million cells. (F) The amount of POLR2A mRNA was measured as in panel E. The limit of detection (LOD) is shown by the dotted line at 3.0 pg/ml. Error bars represent the SD from three independent experiments. *, P < 0.05; **, P < 0.01; ***, P < 0.001; ****, P < 0.0001. NS unless indicated. A paired t test was used to compare stimulated to unstimulated for each respective treatment. A Wilcoxon matched-pairs signed rank test was used to calculate the P values for panels E and F.
FIG 5
FIG 5
SP treatment of OM-10.1 cells suppresses HIV in the absence of ART, but pretreatment does not delay rebound upon treatment interruption. (A) On day 69 of the long-term treatment of OM-10.1 cells with ART and 10 μM SP or DMSO, some cells were set aside and washed to remove ART (indicated by the black arrows) and maintained alongside the treatments with ART. Cells were then treated every 3 days with DMSO+ART (dark blue), 10 μM SP+ART (red), DMSO with no ART (light blue), or 10 μM SP with no ART (orange). The amount of HIV capsid released into the supernatant was monitored over time by p24 ELISA. (B) On day 78 of the long-term treatment of OM-10.1 cells with ART and 10 μM SP or DMSO, some cells were set aside and washed to remove treatments with DMSO or SP (indicated by the black arrow). Cells were then treated every 3 days with DMSO+ART (dark blue), 10 μM SP+ART (red), ART with no DMSO (light blue), or ART with no SP (orange). The amount of HIV capsid released into the supernatant was monitored over time by p24 ELISA. (C) Cells were collected every 3 days from when DMSO or SP treatments were stopped (light blue and orange lines) for protein expression analysis by Western blotting. A representative blot of the indicated proteins is shown. The limit of detection (LOD) is shown by the dotted line at 3.0 pg/ml. Error bars represent the SD from three independent experiments.
FIG 6
FIG 6
Treatment of OM-10.1 cells leads to a reduction of RNA polymerase II occupancy along the HIV genome. OM-10.1 cells on approximately day 70 from long-term treatments with ART and 10 μM SP or DMSO (Fig. 4A) were set aside and stimulated for 8 h with 1 μM prostratin. Cells were then cross-linked prepared for chromatin immunoprecipitation (ChIP). (A) ChIP to total RNAPII was followed by qPCR with primers specific to the indicated regions on the HIV genome (see Table S2 in the supplemental material). The dark blue and red lines represent the distribution of RNAPII on the HIV genome in unstimulated cells. The light blue and orange lines represent the distribution of RNAPII on the HIV genome when cells were stimulated with 1 μM prostratin for 8 h prior to cross-linking. Data for each point is plotted as a fold enrichment relative to the percentage of input for the unstimulated DMSO control with the first primer set. Gray asterisks mark significance in comparing unstimulated SP-treated cells to unstimulated DMSO-treated cells. Black asterisks mark significance comparing stimulated SP-treated cells to stimulated DMSO-treated cells. (B) As above but using an antibody specific to RNAPII CTD phosphorylated on Ser5. (C) As above but using an antibody specific to RNAPII CTD phosphorylated on Ser2. (D) ChIP to total RNAPII was followed by qPCR with primers specific to the GAPDH promoter region or RPL13A ORF. Data for each point are plotted as fold enrichment relative to the percentage of input for the unstimulated DMSO control with the first primer set. (E) As above but using an antibody specific to RNAPII CTD phosphorylated on Ser5. (F) As above but using an antibody specific to RNAPII CTD phosphorylated on Ser2. *, P < 0.05; **, P < 0.005; ***, P < 0.0005. NS unless indicated. A two-tailed t test was performed for the comparison of the different treatment groups in panels A to C. One-way ANOVA followed by the Dunnett multiple-comparison test was used for panels D and E. Error bars represent SD from three independent experiments.
FIG 7
FIG 7
Effects of SP treatment on transcriptional machinery and cell cycle progression. (A) OM-10.1 cells treated for 108, 114, and 123 days with ART and 10 μM SP (red bars) or DMSO (blue bar) (Fig. 1E) were collected for analysis of mRNA expression of the indicated components of TFIIH. cDNA was prepared from cell-associated RNA and qPCR was performed. The results were normalized per RPL13A and plotted relative to the DMSO-treated control (set to 100%, dotted line). Error bars represent the SD from three independent time points. (B) In the left panel, a representative of three independent Western blots of the indicated proteins from OM-10.1 cells treated for 108, 114, and 123 days with ART and DMSO, 10 μM SP, or 10 μM EPL. In the right panel, quantification of the Western blots on the left, protein expression of the indicated genes was normalized to the housekeeping gene, GAPDH, or β-tubulin, and expressed relative to the corresponding DMSO-treated control (set to 100%, dotted line). (C) In the left panel, a representative Western blot of the indicated genes in ACH-2 cells treated for 15 days with ART and 10 μM SP or DMSO only. In the right panel, Western blotting quantification of three independent experiments. The protein expression levels were determined by quantification of the blots, normalized to the housekeeping gene β-tubulin, and expressed relative to the DMSO-treated control (set to 100%, dotted line). (D) In the left panel, a representative Western blot of three independent experiments measuring the protein expression of the indicated genes over time (day 0, day 3, day 6, and day 21). OM-10.1 cells were treated with ART plus 10 μM SP or DMSO for the indicated number of days before harvesting cells for Western blotting. In the right panel, quantification of the Western blots on the left for the indicated proteins, levels were normalized to the housekeeping gene, GAPDH, or β-tubulin, and expressed relative to the corresponding DMSO-treated control (set to 100%). (E) OM-10.1 cells were treated with ART+DMSO or 10 μM SP for 24 days, after which cells were collected for Western blotting analysis of the indicated proteins. In the left panel, a representative Western blot of 3 independent experiments. In the right panel, quantification of the three Western blots, protein expression of the indicated genes was normalized to the housekeeping gene, GAPDH, or β-tubulin, and expressed relative to the corresponding DMSO-treated control (set to 100%). (F) OM-10.1 cells were treated with ART and either DMSO, 10 μM SP, or 10 μM EPL for ∼80 days. Cell cycle stage analysis was performed by propidium iodide staining and flow cytometry 72 h posttreatment. In the left panel, a representative plot showing the degree of PI staining under each treatment condition. In the right panel, a summary of the percentage of cells in the indicated stage of the cell cycle. Error bars represent the SD from three independent experiments. *, P < 0.05; **, P < 0.01; ***, P < 0.001; ****, P < 0.0001. NS unless indicated. One-way ANOVA followed by the Dunnett multiple-comparison test.
FIG 8
FIG 8
Potent inhibition of HIV mRNA expression with limited effects on cellular transcription. OM-10.1 cells were treated with ART+DMSO or ART plus 10 μM SP for 15 days (until HIV capsid production in supernatant in SP-treated cells stabilized to below the limit of detection by p24 ELISA) followed by an 8-h stimulation (or not) with 1 μM prostratin. mRNA-seq and differential expression analysis were performed on these cells. Data are from two biological replicates. (A) Volcano plots showing differentially expressed genes under the indicated conditions. HIV encoding genes are colored red and the most significantly differentially expressed genes are colored blue [pAdj < 1e-10 & abs(log2 fold change) > 1 for SP versus DMSO comparisons (left and right) and padj < 1e-30 with an abs(log2 fold change) > 2.5 for stim versus no stim comparisons (middle two panels)]. The horizontal dotted line represents a pAdj = 0.05 and the vertical dotted lines a log2 FC of 1 and −1. In the left panel, the change in expression of all genes (dots) in SP-treated compared to DMSO-treated cells without stimulation. In the middle left panel, differentially expressed genes in DMSO-treated cells stimulated with prostratin compared to those of unstimulated cells. In the middle right panel, differentially expressed genes in SP-treated cells stimulated with prostratin compared to those of unstimulated cells. In the right panel, differentially expressed genes in prostratin-stimulated cells treated with SP compared to DMSO. (B) GSEA bubble-lattice plot of selected gene sets. The color represents the normalized enrichment score (NES) indicating the number and differential intensity of the assessed genes in each indicated pathway. NES > 0, the gene set is enriched in the SP-treated sample (red). NES < 0, the gene set is enriched in the DMSO-treated sample (blue). NS, unstimulated; Stim, prostratin stimulated. The size of the dots indicates the statistical significance of the enrichment found (log transformed familywise error rate, −log10 FWER P value). GSEAs were computed from the GSEA app version 4.1.0 using TPMs as counts and publicly available gene sets current as of October 2020 (71). (C) Heat map of expression levels (transcript per kilobase million [TPM] values) for selected genes with DMSO or SP treatment, with and without stimulation with prostratin.

Similar articles

Cited by

References

    1. Chun TW, Carruth L, Finzi D, Shen X, DiGiuseppe JA, Taylor H, Hermankova M, Chadwick K, Margolick J, Quinn TC, Kuo YH, Brookmeyer R, Zeiger MA, Barditch-Crovo P, Siliciano RF. 1997. Quantification of latent tissue reservoirs and total body viral load in HIV-1 infection. Nature 387:183–188. doi:10.1038/387183a0. - DOI - PubMed
    1. Chun TW, Stuyver L, Mizell SB, Ehler LA, Mican JAM, Baseler M, Lloyd AL, Nowak MA, Fauci AS. 1997. Presence of an inducible HIV-1 latent reservoir during highly active antiretroviral therapy. Proc Natl Acad Sci U S A 94:13193–13197. doi:10.1073/pnas.94.24.13193. - DOI - PMC - PubMed
    1. Finzi D, Hermankova M, Pierson T, Carruth LM, Buck C, Chaisson RE, Quinn TC, Chadwick K, Margolick J, Brookmeyer R, Gallant J, Markowitz M, Ho DD, Richman DD, Siliciano RF. 1997. Identification of a reservoir for HIV-1 in patients on highly active antiretroviral therapy. Science 278:1295–1300. doi:10.1126/science.278.5341.1295. - DOI - PubMed
    1. Wong JK, Hezareh M, Günthard HF, Havlir DV, Ignacio CC, Spina CA, Richman DD. 1997. Recovery of replication-competent HIV despite prolonged suppression of plasma viremia. Science 278:1291–1295. doi:10.1126/science.278.5341.1291. - DOI - PubMed
    1. Darcis G, Van Driessche B, Van Lint C. 2017. HIV latency: should we shock or lock? Trends Immunol 38:217–228. doi:10.1016/j.it.2016.12.003. - DOI - PubMed