. 2020 Nov 25;11(1):5995.
doi: 10.1038/s41467-020-19718-5.

Remote near infrared identification of pathogens with multiplexed nanosensors

Affiliations

Remote near infrared identification of pathogens with multiplexed nanosensors

Robert Nißler et al. Nat Commun. .

Abstract

Infectious diseases are worldwide a major cause of morbidity and mortality. Fast and specific detection of pathogens such as bacteria is needed to combat these diseases. Optimal methods would be non-invasive and without extensive sample-taking/processing. Here, we developed a set of near infrared (NIR) fluorescent nanosensors and used them for remote fingerprinting of clinically important bacteria. The nanosensors are based on single-walled carbon nanotubes (SWCNTs) that fluoresce in the NIR optical tissue transparency window, which offers ultra-low background and high tissue penetration. They are chemically tailored to detect released metabolites as well as specific virulence factors (lipopolysaccharides, siderophores, DNases, proteases) and integrated into functional hydrogel arrays with 9 different sensors. These hydrogels are exposed to clinical isolates of 6 important bacteria (Staphylococcus aureus, Escherichia coli,…) and remote (≥25 cm) NIR imaging allows to identify and distinguish bacteria. Sensors are also spectrally encoded (900 nm, 1000 nm, 1250 nm) to differentiate the two major pathogens P. aeruginosa as well as S. aureus and penetrate tissue (>5 mm). This type of multiplexing with NIR fluorescent nanosensors enables remote detection and differentiation of important pathogens and the potential for smart surfaces.


Conflict of interest statement

The authors declare no competing interests.

Figures

Fig. 1
Fig. 1. Remote detection of pathogens.
(1) Multiple nanosensors based on NIR fluorescent single-walled carbon nanotubes (SWCNTs) are synthesized in such a way that they change their fluorescence signal in response to bacterial metabolites and virulence factors (cell wall components, iron chelating molecules, secretory enzymatic activity). (2) Eight fluorescent nanosensors and one NIR fluorescent reference are incorporated into a polyethylene glycol hydrogel array that is remotely monitored in the NIR. (3) Bacteria growing on top of this hydrogel release molecules that change the (spatial) sensor array fingerprint, which allows us to differentiate important pathogens. (4) By using chirality-purified SWCNTs, multiple sensors can be spectrally encoded and used for hyperspectral differentiation of important bacteria such as Staphylococcus aureus.
Fig. 2
Fig. 2. NIR fluorescent nanosensors of virulence factors.
a Design of an endotoxin sensor for bacterial lipopolysaccharides (LPS). NH2-(GT)20-ssDNA colloidally stabilizes the SWCNTs and was linked to a LPS-binding peptide via SMCC (succinimidyl 4-(N-maleimidomethyl) cyclohexane-1-carboxylate) chemistry. b NIR fluorescence increase of bindLPS-(bLPS)-SWCNTs after addition of 25 µM E. coli LPS. c Dose–response curve of bLPS sensors for LPS from E. coli, K. pneumoniae, P. aeruginosa and Salmonella spp. (n = 3 independent experiments, mean ± SD). d Design of the siderophore sensor. An aptamer (HeApta) binds hemin, which brings Fe3+ into the proximity of the SWCNT and quenches it. Siderophores can reverse this effect by removing iron (Fe3+), which increases fluorescence again. e Exemplary spectra of HeApta-SWCNTs. Addition of hemin (I0 to I1) quenches their fluorescence and addition of siderophores (pyoverdine) increases it again (I1 to I2). f Calibration of chelating agents with different stability constants (Kf) for iron (Fe3+), added to HeApta-SWCNTs with 1 µM hemin concentration. Pyoverdine (Kf = 1032), deferoxamine (Kf = 1030), EDTA (Kf = 1025), hemin (Kf = 1022), citrate (Kf = 1012),– (n = 3 independent experiments, mean ± SD).
Fig. 3
Fig. 3. NIR fluorescent sensor hydrogels.
a NIR image of a polyethylene glycol hydrogel (PEG-HG) with embedded/copolymerized nanosensors in three identical regions (discs). Images were acquired remotely (distance 25 cm) with an InGaAs camera (see Fig. 4a for a picture of the setup). Here, only sensors reporting protease activity (see panel b) are depicted, but the concept applies to all sensors (scale bar = 0.5 cm). Note that the different NIR intensities of the discs are due to slight differences in illumination/imaging (distance/angle between sample and camera). b Protein (bovine serum albumin, BSA) functionalized SWCNTs, incorporated into a porous PEG-HG, decrease their fluorescence in response to protease from Streptomyces griseus (n = 3 independent experiments with three technical replicates each, mean ± SD) and V8 protease from Staphylococcus aureus (Endoproteinase Glu-C, 13.5 U/mL ~ 18 µg/mL) (n = 3 independent experiments, mean ± SD). c Long, genomic DNA molecules (denatured calf thymus (CT)-DNA) on SWCNTs serve as substrate for nucleases. Incorporated into a porous HG, fluorescence decreases in response to native DNases I or S. aureus nucleases (11 UN/mL ~ 55 µg/mL) (n = 3 independent experiments with three technical replicates each, mean ± SD). d, e Tailored nanosensors (see Fig. 2) are still functional when incorporated into a hydrogel (n = 3 independent experiments with three technical replicates each, mean ± SD). f (GT)10-SWCNTs (as one of the generic DNA/SWCNT sensors) in a HG shows a pH-dependent fluorescence response (evaluated after 24 h) (n = 3 independent experiments with three technical replicates each, mean ± SD).
Fig. 4
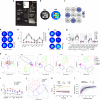
Fig. 4. Remote NIR identification of bacteria.
a A simple NIR stand-off setup enables remote (25 cm) imaging of the NIR fluorescent sensors embedded in a hydrogel (HG) array. b Photograph (in the visible spectrum) of the HG nanosensor array and its corresponding NIR fluorescence image (scale bar 0.5 cm). c Arrangement and functionality of the 9 sensors in the HG array. d Remote NIR fluorescence image of a sensor array incorporated in a microbiological agar plate, inoculated with S. aureus. During bacterial growth the sensor pattern changes (scale bar 0.5 cm). e Corresponding sensor response normalized to the EB-NS signal during S. aureus growth, from 0 to 72 h (n = 3 independent experiments, mean ± SD). f Representative fluorescence response fingerprint of six pathogens, monitored after 72 h. g Fluorescence SWCNT array fingerprint of all bacteria and strains, evaluated after 72 h. (ΔISR—sensor response: IS1/IR1/IS0/IR0; IS—intensity sensor, IR—intensity reference (EB-NS)) (n = 3 independent experiments, mean ± SD). h PCA (principal component analysis) of the fluorescence fingerprint of all analyzed strains, plotted for different timepoints (12–72 h). Each point represents one bacterial sample including clinical isolates from different patients. Control = medium only. i Mean sensor array fingerprint from diverse clinical isolates of each S. aureus (n = 21 biologically independent samples) and S. epidermidis (n = 22 biologically independent samples) 72 h after incubation. (error = SE). j Corresponding PCA for the array fingerprint after 72 h growth of the clinical isolates of S. aureus and S. epidermidis. k Time resolved fluorescence change of the nanosensor array after addition of liquid culture supernatant from P. aeruginosa. (24 h incubation in LB-medium, I—intensity sensor at t = x; I0—intensity sensor at t = 0) (mean of n = 3 independent experiments). l Stochastic simulation that predicts how bacteria discrimination improves with number of sensors. The simulation is based on experimental responses and selectivities as range for novel sensors and uses PCA as well as mean linear discrimination analysis (LDA) to distinguish bacteria. Mean values are plotted and the dashed lines/transparent area represent the SD from 25 independent simulations. Ellipses in (h, j) indicate the 0.68 bivariate confidence interval.
Fig. 5
Fig. 5. Hyperspectral remote detection of bacteria.
a Multi-color sensor HGs are created by incorporating EB-NS as reference NIR-fluorophore and two chirality-purified SWCNT sensors (LPS-binding-peptide-(GT)20@(6,5)-SWCNTs and PEG(5 kDa)-PL@(9,5)-SWCNTS), which enables spectral multiplexing. NIR fluorescence images were captured with optical filters, resulting in three emission/color channels (EB-NS 900–950 nm, bLPS 1000 nm and PEG 1250 nm). Note that heterogeneity in fluorescence of the three technical replicates is caused by inhomogeneous illumination intensity and not relevant for quantification because of normalization to the EB-NS reference (scale bar 0.5 cm). b Fluorescence change of the hyperspectral sensors after 72 h of incubation with P. aeruginosa and S. aureus show distinct responses for one reference strain and two clinical isolates (n = 3 independent experiments, mean ± SD). c PCA of the spectrally encoded sensors for different timepoints. Each point represents one biological replicate of the indicated strain. Ellipses indicate the 0.68 bivariate confidence interval. d Tissue penetration through chicken phantom (561 nm excitation, 130 mW, 6 s integration time, n = 3 sensor spots, mean ± SD). Intensity decreases with tissue thickness. e If the integration time is increased (25 s, 190 mW excitation power) spectrally encoded bacterial sensors can be read out through 7 mm of tissue phantom (n = 3 independent experiments, mean ± SD).

Similar articles

Cited by

References

    1. Willyard C. Drug-resistant bacteria ranked. Nature. 2017;543:15. - PubMed
    1. Prestinaci F, Pezzotti P, Pantosti A. Antimicrobial resistance: a global multifaceted phenomenon. Pathog. Glob. Health. 2015;109:309–318. - PMC - PubMed
    1. Cecconi M, Evans L, Levy M, Rhodes A. Sepsis and septic shock. Lancet. 2018;392:75–87. - PubMed
    1. Shohat N, et al. Hip and knee section, what is the definition of a periprosthetic joint infection (PJI) of the knee and the hip? Can the same criteria be used for both joints?: Proceedings of international consensus on orthopedic infections. J. Arthroplast. 2019;34:325–327. - PubMed
    1. Váradi L, et al. Methods for the detection and identification of pathogenic bacteria: past, present, and future. Chem. Soc. Rev. 2017;46:4818–4832. - PubMed

Publication types

MeSH terms

LinkOut - more resources