. 2020 Nov 25;11(1):5973.
doi: 10.1038/s41467-020-19768-9.

Biased localization of actin binding proteins by actin filament conformation

Affiliations

Biased localization of actin binding proteins by actin filament conformation

Andrew R Harris et al. Nat Commun. .

Abstract

The assembly of actin filaments into distinct cytoskeletal structures plays a critical role in cell physiology, but how proteins localize differentially to these structures within a shared cytoplasm remains unclear. Here, we show that the actin-binding domains of accessory proteins can be sensitive to filament conformational changes. Using a combination of live cell imaging and in vitro single molecule binding measurements, we show that tandem calponin homology domains (CH1-CH2) can be mutated to preferentially bind actin networks at the front or rear of motile cells. We demonstrate that the binding kinetics of CH1-CH2 domain mutants varies as actin filament conformation is altered by perturbations that include stabilizing drugs and other binding proteins. These findings suggest that conformational changes of actin filaments in cells could help to direct accessory binding proteins to different actin cytoskeletal structures through a biophysical feedback loop.


Conflict of interest statement

The authors declare no competing interests.

Figures
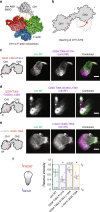
Fig. 1
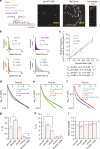
Fig. 1. utrn CH1–CH2 mutants display differential localization in neutrophils.
a Representation of the actin-binding domain of utrophin binding to actin (6M5G) which makes contact on and in between adjacent monomers on an actin filament. CH1 only is shown in this graphic. b Mutations to residues at the interface between CH1 and CH2 change the ability of CH1–CH2 domains to adopt an open conformation, which relieves a steric interaction between CH2 and F-actin and results in an increase in binding affinity. c The mutant utrn Q33A T36A K121A is localized more strongly to the leading edge than utrnWT. d The mutant utrn Q33A T36A G125A L132A is localized more strongly to the rear of the cell than utrnWT. e The mutant utrn Δ-nterm Q33A T36A is localized more evenly distributed at the front and back of the cell than utrnWT. Scale bars are 5 µm. f Comparisons of the relative utrn construct intensity at the front and back of migrating neutrophils, calculated by averaging the intensity in 1 µm regions at the front and back of the cell (left). Conditions were compared using a two-tailed students t-test and assumed significant at *p < 0.05.
Fig. 2
Fig. 2. Single molecule kinetic measurements of utrn CH1–CH2 mutants in vitro.
a Single molecule binding assay to measure the kinetic properties. Images in the example shown are for utrnWT. Maximum intensity projection through time displays the filament backbones and a kymograph the kinetics of binding. Scale bars are 5 µm. The kymograph is a 12 µm section of filament backbone. b Average binding dwell times for the different CH1–CH2 mutants. c Binding on-rates for the different utrophin mutants evaluated by fitting the binding event frequency over a range of different concentrations. Error bars are the mean ± SEM for each concentration measured from more than 12 fields of view collected from two imaging chambers. d Cumulative distribution function for utrnWT (green) and utrnLAM (magenta). e Cumulative distribution function for utrnWT (green) and utrnΔN (orange). f Cumulative distribution function for K121A (red) and G125A L132A (blue). g Comparisons of the first timescale τ1, h second timescale τ2, and i relative amplitude of events belonging to each timescale from a double exponential fit to the cumulative distribution functions for the different constructs. Error bars are the standard deviation from the mean of 3 technical replicates. Conditions were compared using a two-tailed students t-test, with p < 0.05 denoted by a star (*).
Fig. 3
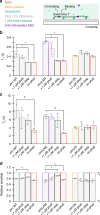
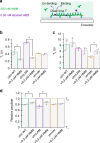
Fig. 3. Filament stabilization by small molecules alter utrophin ABD mutant dwell times.
a Measurement of binding dwell times in the presence of phalloidin and jasplakinolide that stabilize actin filaments. Either 1 µM phalloidin or 1 µM jasplakinolide were added to the assay chamber after actin filaments had been tethered to the glass coverslip. These conditions were also compared with actin filaments co-polymerized with 5 µM biotin-phalloidin which were subsequently added to the imaging chamber. b Comparisons of the first timescale, c second timescale, and d relative amplitudes from a double exponential fit to the cumulative distribution functions for the different constructs and conditions. Error bars are the standard deviation around the mean of 3 technical replicates. Conditions were compared using a two-tailed students t-test, with p < 0.05 denoted by a star (*).
Fig. 4
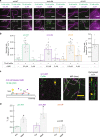
Fig. 4. Filament binding by cofilin alters utrophin ABD mutant dwell times.
a Actin filament severing by 75 nM cofilin (green) in the presence of 0.2 μM and 2 µM of the different utrophin mutants (magenta). Scale bars are 5 µm. b Quantification of actin filament severing rate. The error bars represent the standard deviation of more than 12 imaging regions collected from two imaging chambers. c Single molecule colocalization and kinetic measurements at low concentrations of cofilin (10 nM) analysed both near and far from a cofilin binding event. Scale bar 5 µm. The kymograph is from an 8 µm section of filament. d The first timescale from the fit to the CDF for molecules near (<30 nm) and far (>30 nm) from cofilin for utrn WT, utrnLAM and utrnΔN. Error bars are the standard deviation around the mean of 3 technical replicates. Conditions were compared using a two-tailed students t-test, with p < 0.05 denoted by a star (*).
Fig. 5
Fig. 5. Filament binding by drebrin alters utrophin ABD mutant dwell times.
a Single molecule binding kinetics in the presence of 200 nM of the actin-binding domain of the protein drebrin (drebrin 1–300). Comparisons of the first timescale b second timescale c and relative amplitudes d from a double exponential fit to the cumulative distribution functions for the different constructs. Error bars are the standard deviation around the mean of 3 technical replicates. Conditions were compared using a two-tailed students t-test, with p < 0.05 denoted by a star (*).
Fig. 6
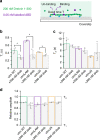
Fig. 6. Filament binding by heavy meromyosin (HMM) alters utrophin ABD mutant dwell times.
a Single molecule binding kinetics in the presence of 200 nM of the myosin fragment HMM. Comparisons of the first timescale (b), second timescale (c), and relative amplitudes (d) from a double exponential fit to the cumulative distribution functions for the different constructs. Error bars are the standard deviation around the mean of 3 technical replicates. Conditions were compared using a two-tailed students t-test, with p < 0.05 denoted by a star (*).
Fig. 7
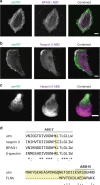
Fig. 7. Native CH1–CH2 domains display different sub-cellular localizations.
a Localization of BPAG1 ABD (magenta) relative to utrnWT (green) in HeLa cells. Scale bar is 5 µm. b Localization of Nesprin II ABD (magenta) relative to utrnWT (green). c Localization of Nesprin II ABD (magenta) relative to utrnWT (green) in PLB cells. Images shown are representative examples taken from a set of at least 10 different images. Scale bar is 5 µm. d Sequence alignment of native CH1–CH2 domains. Residue K121 for utrnWT highlighted in yellow (top) and the N-terminal region prior to CH1–CH2 and its truncation in yellow (bottom). Identical residues are annotated with ‘*’, strongly conserved with ‘:’, and weakly conserved with ‘.’.

Similar articles

Cited by

References

    1. Harris AR, Jreij P, Fletcher DA. Mechanotransduction by the actin cytoskeleton: converting mechanical stimuli into biochemical signals. Annu. Rev. Biophys. 2018;47:617–631. doi: 10.1146/annurev-biophys-070816-033547. - DOI
    1. Michelot A, Drubin DG. Building distinct actin filament networks in a common cytoplasm. Curr. Biol. 2011;21:R560–R569. doi: 10.1016/j.cub.2011.06.019. - DOI - PMC - PubMed
    1. Svitkina TM, et al. Mechanism of filopodia initiation by reorganization of a dendritic network. J. Cell Biol. 2003;160:409–421. doi: 10.1083/jcb.200210174. - DOI - PMC - PubMed
    1. Fritzsche M, et al. Self-organizing actin patterns shape membrane architecture but not cell mechanics. Nat. Commun. 2017;8:14347. doi: 10.1038/ncomms14347. - DOI - PMC - PubMed
    1. Luxenburg C, et al. The architecture of the adhesive apparatus of cultured osteoclasts: from podosome formation to sealing zone assembly. PLoS ONE. 2007;2:e179. doi: 10.1371/journal.pone.0000179. - DOI - PMC - PubMed

Publication types

MeSH terms