. 2020 Nov 25;11(1):5982.
doi: 10.1038/s41467-020-19657-1.

Wisp1 is a circulating factor that stimulates proliferation of adult mouse and human beta cells

Affiliations

Wisp1 is a circulating factor that stimulates proliferation of adult mouse and human beta cells

Rebeca Fernandez-Ruiz et al. Nat Commun. .

Abstract

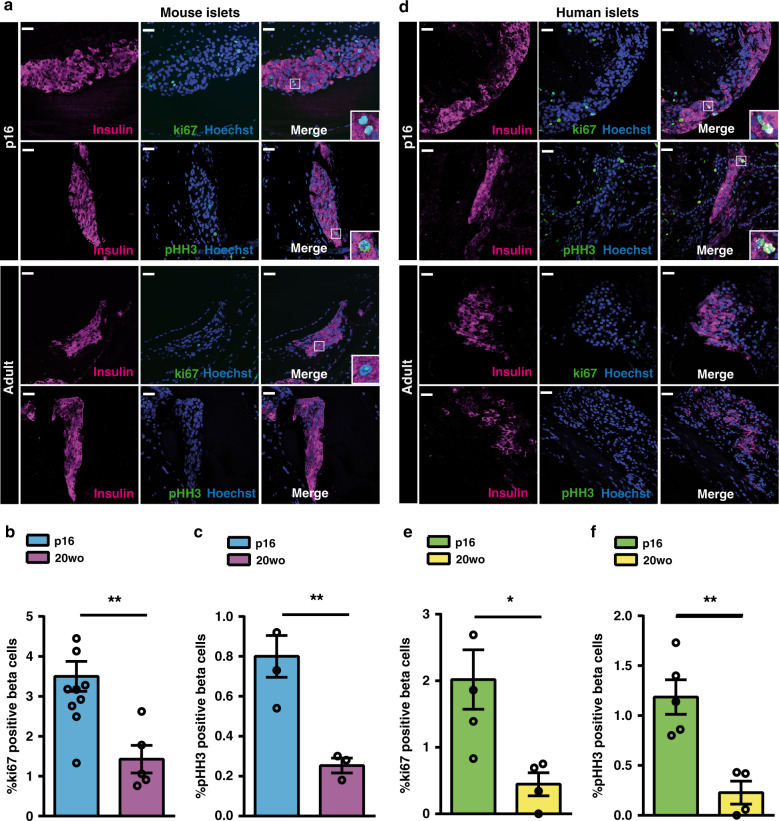
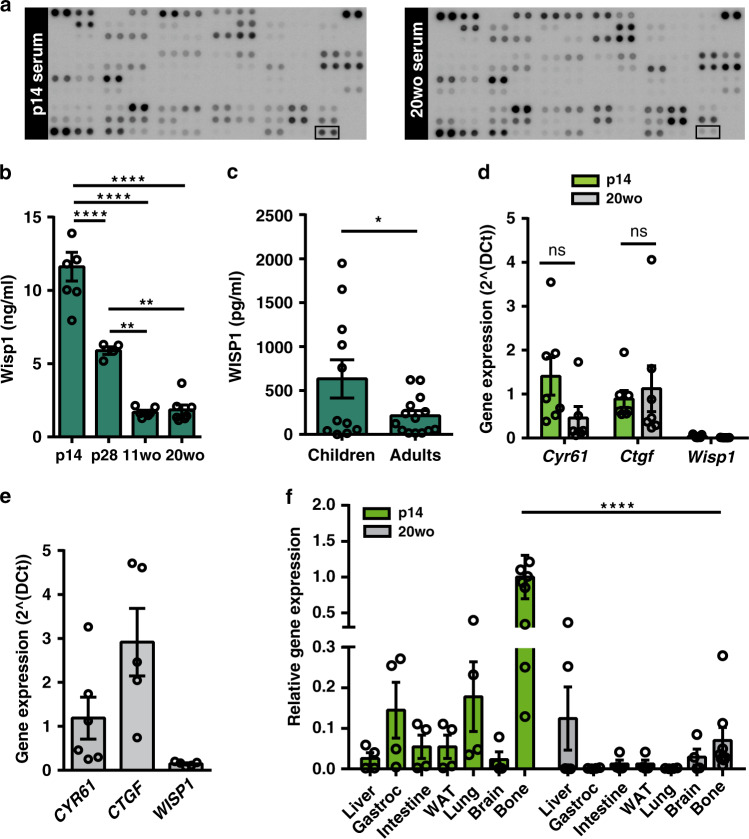
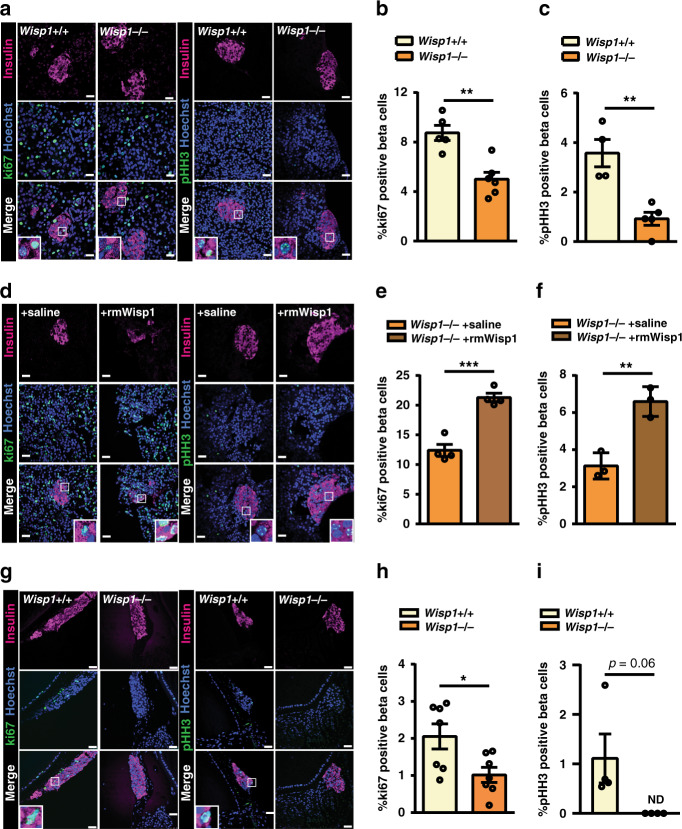
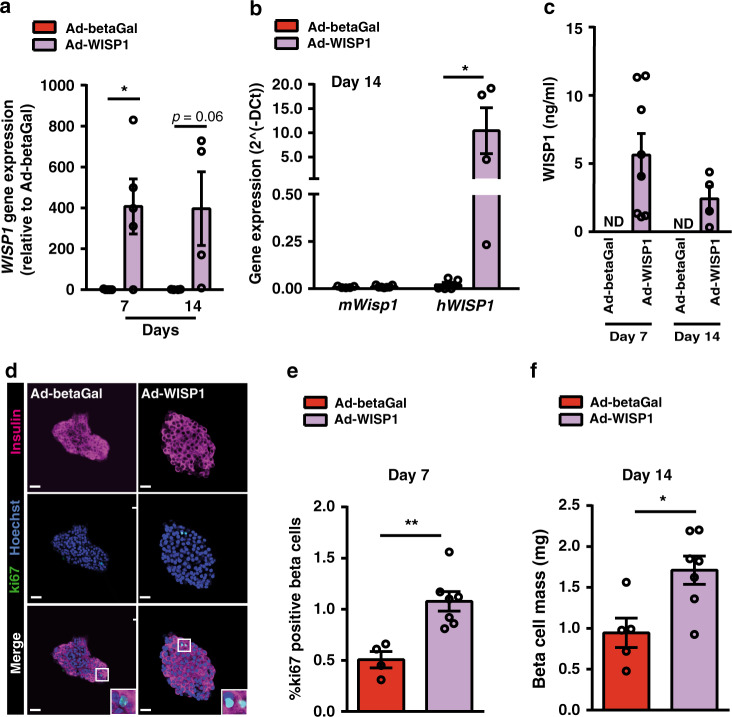
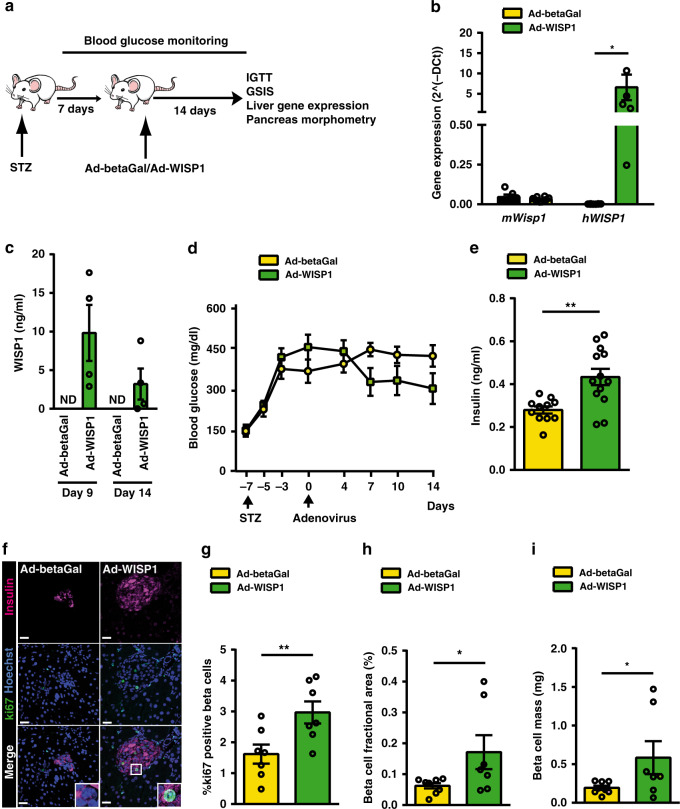
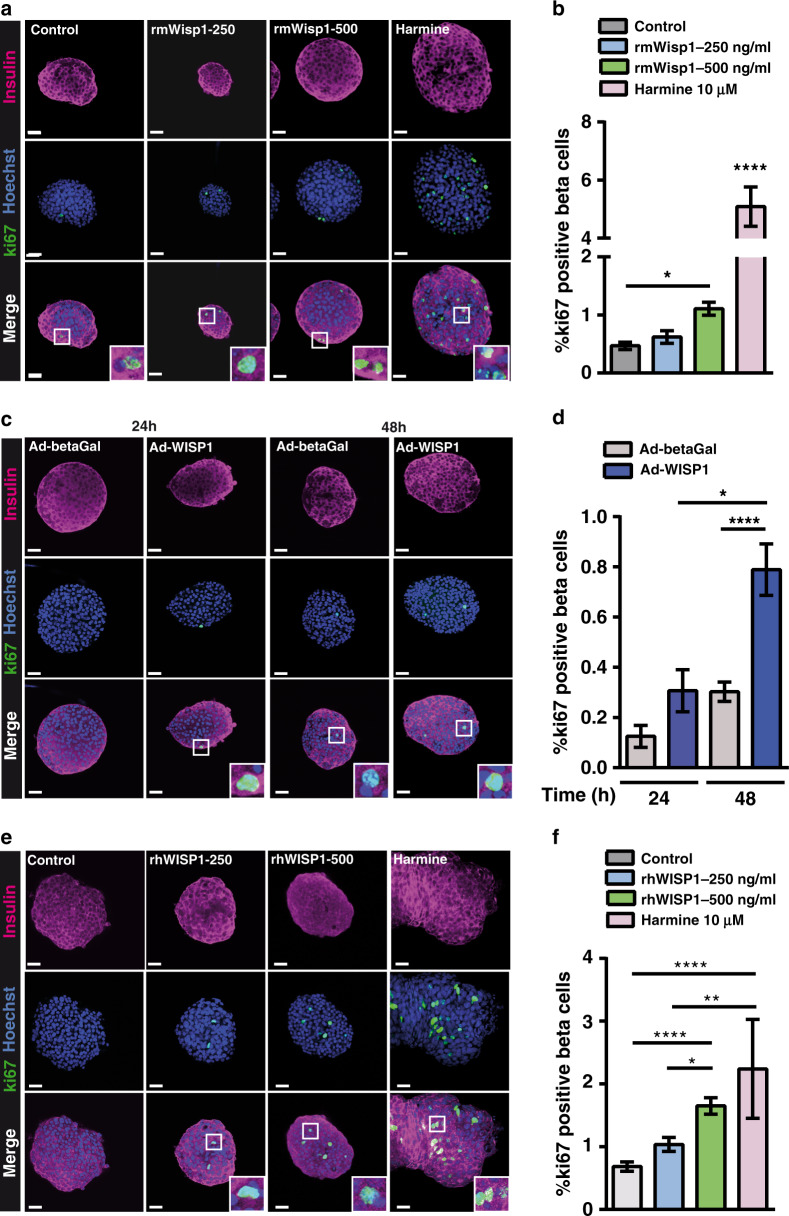
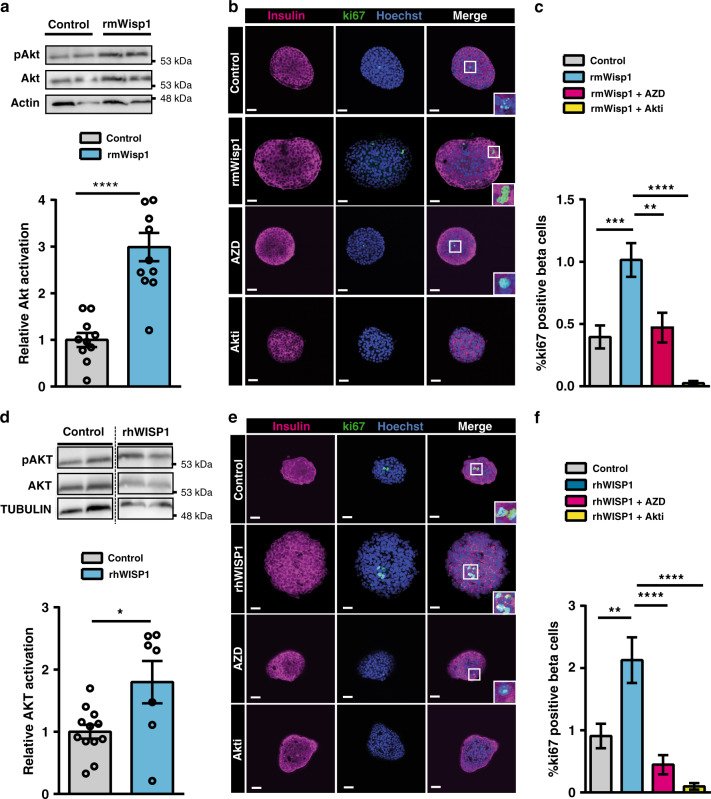
Expanding the mass of pancreatic insulin-producing beta cells through re-activation of beta cell replication has been proposed as a therapy to prevent or delay the appearance of diabetes. Pancreatic beta cells exhibit an age-dependent decrease in their proliferative activity, partly related to changes in the systemic environment. Here we report the identification of CCN4/Wisp1 as a circulating factor more abundant in pre-weaning than in adult mice. We show that Wisp1 promotes endogenous and transplanted adult beta cell proliferation in vivo. We validate these findings using isolated mouse and human islets and find that the beta cell trophic effect of Wisp1 is dependent on Akt signaling. In summary, our study reveals the role of Wisp1 as an inducer of beta cell replication, supporting the idea that the use of young blood factors may be a useful strategy to expand adult beta cell mass.


Conflict of interest statement

The authors declare no competing interests.

Figures

Fig. 1
Fig. 1. Adult beta cells exhibit enhanced replication when transplanted into pre-weaning mice.
a–c Beta cell replication of 20wo mouse islet grafts 12-days after implantation into the anterior chamber of the eye of p16 or 20wo C57BL6/J recipients. a Representative images of islet grafts co-immunostained for insulin (purple) /ki67 (green) or insulin (purple)/pHH3 (green). Nuclei are marked with Hoechst in blue. b Quantification of the percentage of beta (insulin+) cells that are ki67+ in islet grafts transplanted into p16 (n = 11, blue) and 20wo (n = 5, purple) mice. c Quantification of the percentage of beta (insulin+) cells that are pHH3+ in islet grafts transplanted into p16 (n = 4, blue) and 20wo (n = 3, purple) mice. df Beta cell replication of adult human islet grafts 12-days after implantation into the anterior chamber of the eye of p16 or 20wo NSG-SCID mouse recipients (islets from two donors). d Representative images of islet grafts co-immunostained for insulin (purple)/ki67 (green) or insulin (purple)/pHH3 (green). Nuclei are marked with Hoechst in blue. e, f Quantification of the percentage of beta (insulin+) cells that are ki67+ (e) or pHH3+ (f) in human islet grafts transplanted into p16 (n = 5, green) or 20wo (n = 4, yellow) mice. Data shown represent mean ± SEM for the indicated n. *p < 0.05; **p < 0.01, using two-tailed Student’s t test. Scale bars are 25 μm.
Fig. 2
Fig. 2. Identification of Wisp1 as a factor enriched in blood of pre-weaning mice.
a Representative images of antibody arrays incubated with p14 or 20wo mouse serum. Spots corresponding to Wisp1 are marked with an empty square box. b Serum levels of Wisp1 in p14 (n = 7), p28 (n = 4), 11wo (n = 6) and 20wo (n = 7) mice measured with ELISA. c Plasma levels of WISP1 in children (n = 11) and adult (n = 14) measured with ELISA. d Quantification by qPCR of the expression of the indicated CCN genes in p14 (n = 7, green) and 20wo mouse islets (n = 6 for Cyr61, n = 7 for other genes, gray). Values are expressed relative to Tbp. e Quantification by qPCR of the expression of the indicated CCN genes in adult human islets (n = 6 for CYR61, n = 5 for other genes). Values are expressed relative to TBP. f Quantification by qPCR of Wisp1 gene expression in the indicated p14 (green) and 20wo (gray) mouse tissues. Wisp1 gene expression is shown relative to levels in p14 bone, given the value of 1 (n = 9 for bone, n = 4 for all other tissues). WAT: white adipose tissue; Gastroc: gastrocnemius. All data shown represent mean ± SEM from the indicated n. Indicated comparisons were made using two-tailed Student’s t test (c, d), one-way (b) and two-way (f) ANOVA. *p < 0.05; **p < 0.01; ****p < 0.0001; ns: not significant. In f, at p14, bone Wisp1 gene expression was significantly higher than in all other tissues tested with p < 0.01–0.001.
Fig. 3
Fig. 3. Wisp1 contributes to beta cell replication in young mice.
ac Beta cell proliferation in fixed pancreases from p14 Wisp1+/+ or Wisp1/ mice. a Representative images of pancreases co-immunostained for insulin (purple)/ki67 (green) or insulin (purple) /pHH3 (green). Nuclei are marked with Hoechst in blue. b Quantification of the percentage of beta (insulin+) cells that are ki67+ in Wisp1+/+ (n = 5, yellow) or Wisp1/ (n = 6, orange) mice. c Quantification of the percentage of beta (insulin+) cells that are pHH3+ in Wisp1+/+ (n = 4, yellow) or Wisp1/ (n = 5, orange) mice. df Beta cell proliferation in fixed pancreases from p12 Wisp1/ mice treated with saline or with rmWisp1 protein for three days (from p9 to p11). d Representative images of pancreases co-immunostained for insulin (purple)/ki67 (green) or insulin (purple)/pHH3 (green). Nuclei are marked with Hoechst in blue. e Quantification of the percentage of beta (insulin+) cells that are ki67+ in mice injected with rmWisp1 (n = 4, orange) o saline (n = 4, brown). f Quantification of the percentage of beta (insulin+) cells that are pHH3+ in mice injected with rmWisp1 (n = 3, orange) o saline (n = 3, brown). gi Beta cell proliferation of 20wo mouse islet grafts transplanted into the anterior chamber of the eye of p16 Wisp1+/+ or Wisp1/ mouse recipients. g Representative images of islet grafts co-immunostained for insulin (purple)/ki67 (green) or insulin (purple)/pHH3 (green). Nuclei are marked with Hoechst in blue. h Quantification of the percentage of beta (insulin+) cells that are ki67+ in p16 Wisp1+/+ (n = 7, yellow) or Wisp1/ (n = 7, orange) mice. i Quantification of the percentage of beta (insulin+) cells that are pHH3+ in p16 Wisp1+/+ (n = 4, yellow) or Wisp1/ (n = 4, orange) mice. All data values represent mean ± SEM for the indicated n. *p < 0.05; **p < 0.01 using two-tailed Student’s t test. Scale bars are 25 μm. ND: not detectable.
Fig. 4
Fig. 4. Adenovirus-mediated expression of Wisp1 enhances endogenous beta cell proliferation in adult mice.
Adenoviruses encoding human WISP1 (Ad-WISP1) or beta-galactosidase (Ad-betaGal) were injected via the tail vein into 12wo C57BL6/J mice. a Quantification by qPCR of human WISP1 transcripts in the livers of mice seven days and fourteen days (n = 4) post-injection. Levels are expressed relative to values in mice injected with Ad-betaGal, given the value of 1. b Quantification by qPCR of mouse Wisp1 mRNA (n = 5 for Ad-betaGal, red; n = 7 for Ad-WISP1, purple) and human WISP1 transcripts (n = 5 for Ad-betaGal, red; n = 4 for Ad-WISP1, purple) in the livers of mice fourteen days post-injection. Expression levels are expressed relative to Tbp. c Serum human WISP1 levels were measured by ELISA at days 7 and 14 post-injection of Ad-betaGal (n = 7) or Ad-WISP1 (n = 8 at day 7; n = 4 at day 14, purple). Human WISP1 was not detectable (ND) in serum from mice injected with Ad-betaGal. d, e Beta cell proliferation following injection of Ad-WISP1 and Ad-betaGal. d Representative images of in toto immunofluorescence staining against ki67 (green) and insulin (purple) in islets isolated at day 7 after injection of the indicated adenoviruses. Nuclei are labeled with Hoechst (blue). e Percentage of beta cells (insulin+) that are ki67+ at day 7 after injection of Ad-betaGal (n = 4, red) or Ad-WISP1 (n = 7, purple). f Beta cell mass at day 14 following injection of Ad-betaGal (n = 5, red) or Ad-WISP1 (n = 7, purple). All data shown represent mean ± SEM for the indicated n. *p < 0.05; **p < 0.01 using two-tailed Student’s t test (b, e, f) or two-way ANOVA (a, c). Scale bars are 25 μm.
Fig. 5
Fig. 5. Adenovirus-mediated expression of Wisp1 promotes endogenous beta cell proliferation in adult diabetic mice.
a Schematic of experimental plan. b Quantification by qPCR of mouse Wisp1 mRNA (n = 6 for Ad-betaGal, yellow; n = 10 for Ad-WISP1, green) and human WISP1 transcripts (n = 8 for Ad-betaGal, yellow; n = 6 for Ad-WISP1, green) in the livers of mice fourteen days post-injection. Expression levels are expressed relative to Tbp. c Serum human WISP1 levels were measured by ELISA at days 9 and 14 post-injection with Ad-betaGal (n = 5) or Ad-WISP1 (n = 4, green). Human WISP1 was not detectable (ND) in mice injected with Ad-betaGal. d Blood glucose concentrations measured at the indicated days post-injection with Ad-betaGal (n = 8, yellow) or Ad-WISP1 (n = 7, green). e Serum insulin at day 14 following administration of Ad-betaGal (n = 11, yellow) or Ad-WISP1 (n = 13, green). f, g Beta cell proliferation following injection of Ad-WISP1 and Ad-betaGal. f Representative images of immunofluorescence staining against ki67 (green) and insulin (purple) in fixed pancreases at day 14 after injection of the indicated adenoviruses. Nuclei are labeled with Hoechst (blue). g Percentage of beta cells (insulin+) that are ki67+ at day 14 days after injection of the indicated adenoviruses (n = 7; Ad-betaGal in yellow, Ad-WISP1 in green). h Beta cell fractional area (insulin+ area relative to total pancreatic area) and i total beta cell mass at day 14 after injection of Ad-betaGal (n = 8, yellow) or Ad-WISP1 (n = 7, green). All data shown represent mean ± SEM for the indicated n. *p < 0.05; **p < 0.01 using two-tailed Student’s t test (b, e), one-tailed Student’s t test (gi) and two-way ANOVA (d). Scale bars are 25 μm.
Fig. 6
Fig. 6. Wisp1 promotes mouse beta cell replication in vitro.
a, b Beta cell proliferation in mouse islets incubated with Wisp1 recombinant mouse protein (rmWisp1). a Representative images of in toto immunofluorescence showing ki67 (green) and insulin (purple) staining in mouse islets cultured for 48 h with increasing amounts of rmWisp1 protein or harmine. Nuclei are marked with Hoechst in blue. b Percentage of beta cells (insulin+) that are ki67+ in cultured islets under the indicated conditions (control, n = 49 islets, in gray; rmWisp1-250, n = 19 islets, in blue; rmWisp1-500, n = 45 islets, in green; harmine, n = 15 islets, in pink; from four independent experiments except for harmine that are from two independent experiments). c, d Beta cell proliferation in mouse islets co-cultured with NIH3T3 cells expressing WISP1. c Representative images of in toto immunofluorescence showing ki67 (green) and insulin (purple) staining in mouse islets co-cultured for 24 or 48 h with NIH3T3 cells infected with the indicated adenoviruses. Nuclei are marked with Hoechst in blue. d Percentage of beta cells (insulin+) that are ki67+ in mouse islets cultured under the indicated conditions for 24 h (control, in gray: n = 25 islets; 3T3/WISP1, in blue: n = 21 islets, from three independent experiments) and for 48 h (control, in gray: n = 100 islets; 3T3/WISP1, in blue: n = 88 islets, from three independent experiments). e, f Beta cell proliferation in human islets incubated with recombinant human WISP1 protein (rhWISP1). e Representative images of in toto immunofluorescence showing ki67 (green) and insulin (purple) staining in human islets incubated for 48 h with increasing amounts of rhWISP1 protein or with harmine. Nuclei are marked with Hoechst in blue. f Percentage of beta cells (insulin+) that are ki67+ in human islets cultured under the indicated conditions (control, in gray: n = 79 islets; rhWISP1-250, in blue: n = 60 islets; rhWISP1-500, in green: n = 98 islets; harmine, in pink: n = 17 islets; from four donors). All data shown represent mean ± SEM for the indicated n. Comparisons were made using one-way ANOVA. *p < 0.05; **p < 0.01; ****p < 0.0001. Scale bars are 25 μm.
Fig. 7
Fig. 7. Wisp1 activates Akt in mouse and human pancreatic islets.
a Determination of Akt activation (Ser473 phosphorylation) by immunoblot analysis in mouse islets incubated with recombinant mouse Wisp1 protein (rmWisp1) at 500 ng/ml for 30 min. Top: representative immunoblot image. Molecular weight markers are shown on the right. Bottom, quantification of Akt activation, expressed relative to control islets (no rmWisp1), given the value of 1 (control, in gray: n = 10; rmWisp1, in blue: n = 11, from five independent experiments). b, c Beta cell proliferation in mouse islets incubated with rmWisp1 protein and Akt inhibitors. b Representative immunofluorescence images showing ki67 staining in green and insulin in purple. Nuclei are marked with Hoechst (blue). c Percentage of beta cells (insulin+) that are ki67+ in islets incubated with rmWisp1protein at 500 ng/ml for 48 h alone (n = 41 islets, blue) or with the Akt inhibitors AZD5363 (n = 21 islets, pink) or Akti (n = 25 islets, yellow), or left untreated (control, gray: n = 39 islets) from three different isolation experiments. d Determination of AKT activation (Ser473 phosphorylation) by immunoblot analysis in human islets incubated with recombinant human WISP1 protein (rhWISP1) at 500 ng/ml for 15 min. Top: representative immunoblot image. Molecular weight markers are shown on the right. Bottom, quantification of AKT activation, expressed relative to control islets (no WISP1), given the value of 1 (control in gray: n = 12; rhWISP1 in blue: n = 7, from 3 donors) e, f Beta cell proliferation in human islets incubated with Wisp1 protein and Akt inhibitors. e Representative immunofluorescence images showing ki67 staining in green and insulin in red. Nuclei are marked with Hoechst (blue). f Percentage of beta cells (ins+) that are ki67+ in human islets incubated with rhWISP1 protein at 500 ng/ml for 48 h alone (n = 21 islets, blue) or with the Akt inhibitors AZD5363 (n = 31 islets, pink) or Akti (n = 15 islets, yellow), or left untreated (control, gray: n = 20 islets) from 3 donors. All data shown represent mean ± SEM for the indicated n. Comparisons were made using two-tailed Student’s t test (a, d) or one-way ANOVA (c, f). *p < 0.05; ***p < 0.001; ****p < 0.0001. Scale bars are 25 μm.

References

    1. Stewart AF, et al. Human beta-cell proliferation and intracellular signaling: part 3. Diabetes. 2015;64:1872–1885. doi: 10.2337/db14-1843. - DOI - PMC - PubMed
    1. Krishnamurthy J, et al. p16INK4a induces an age-dependent decline in islet regenerative potential. Nature. 2006;443:453–457. doi: 10.1038/nature05092. - DOI - PubMed
    1. Chen H, et al. PDGF signalling controls age-dependent proliferation in pancreatic beta-cells. Nature. 2011;478:349–355. doi: 10.1038/nature10502. - DOI - PMC - PubMed
    1. Conboy IM, et al. Rejuvenation of aged progenitor cells by exposure to a young systemic environment. Nature. 2005;433:760–764. doi: 10.1038/nature03260. - DOI - PubMed
    1. Song G, et al. Use of the parabiotic model in studies of cutaneous wound healing to define the participation of circulating cells. Wound Repair Regen. 2010;18:426–432. doi: 10.1111/j.1524-475X.2010.00595.x. - DOI - PMC - PubMed

Publication types

MeSH terms