. 2020 Nov 25;11(1):5975.
doi: 10.1038/s41467-020-19783-w.

The Hsp70-Hsp90 co-chaperone Hop/Stip1 shifts the proteostatic balance from folding towards degradation

Affiliations

The Hsp70-Hsp90 co-chaperone Hop/Stip1 shifts the proteostatic balance from folding towards degradation

Kaushik Bhattacharya et al. Nat Commun. .

Abstract

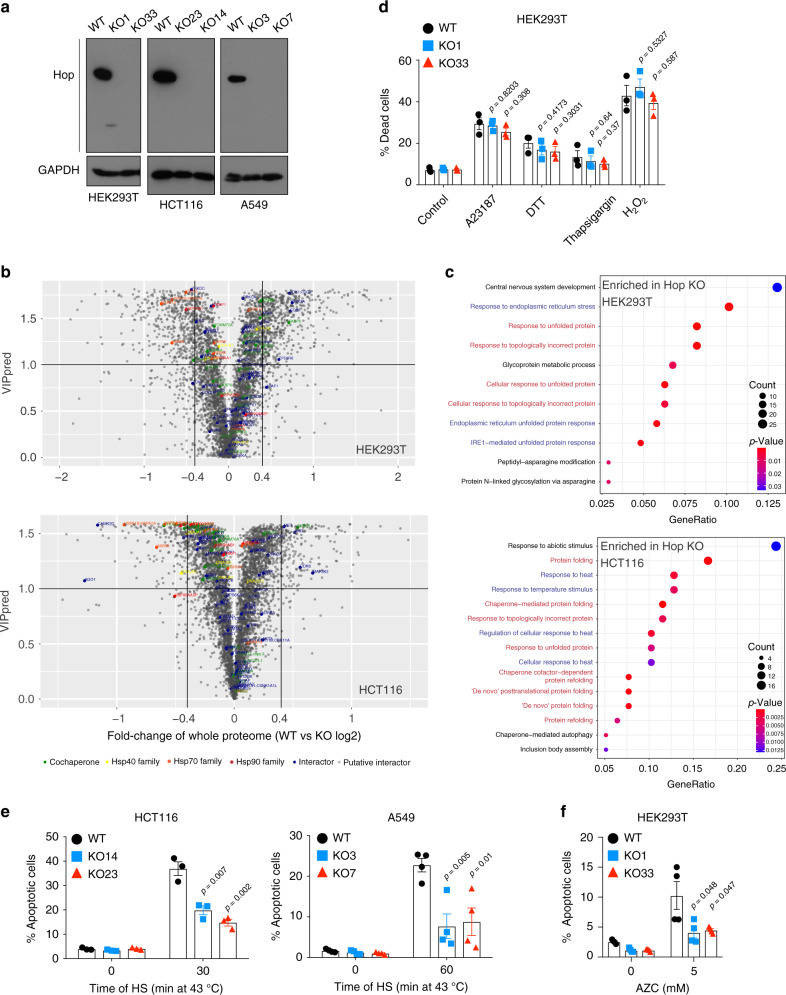
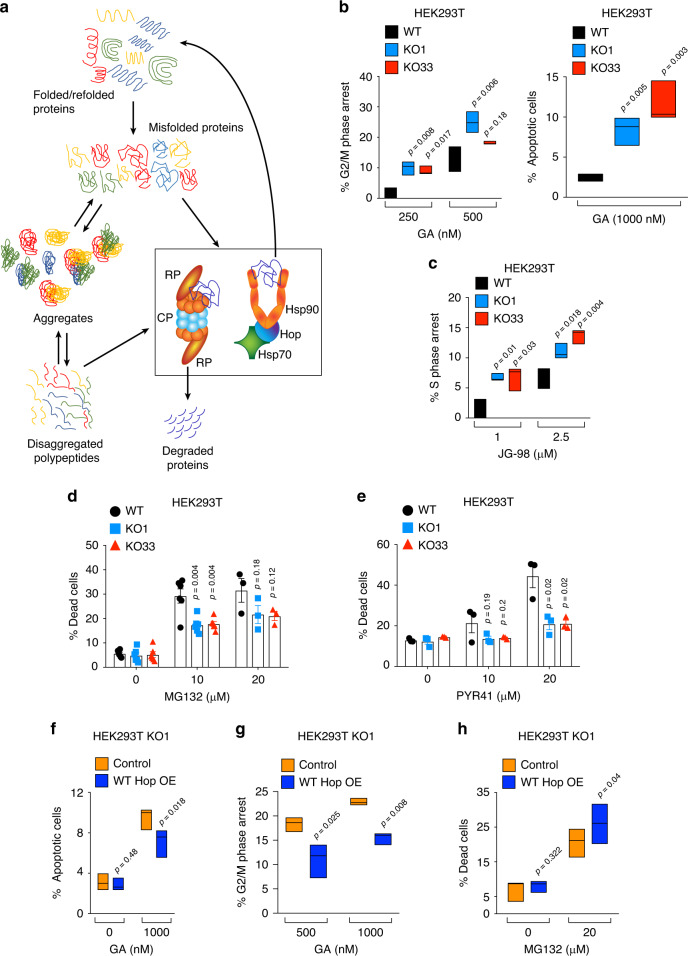
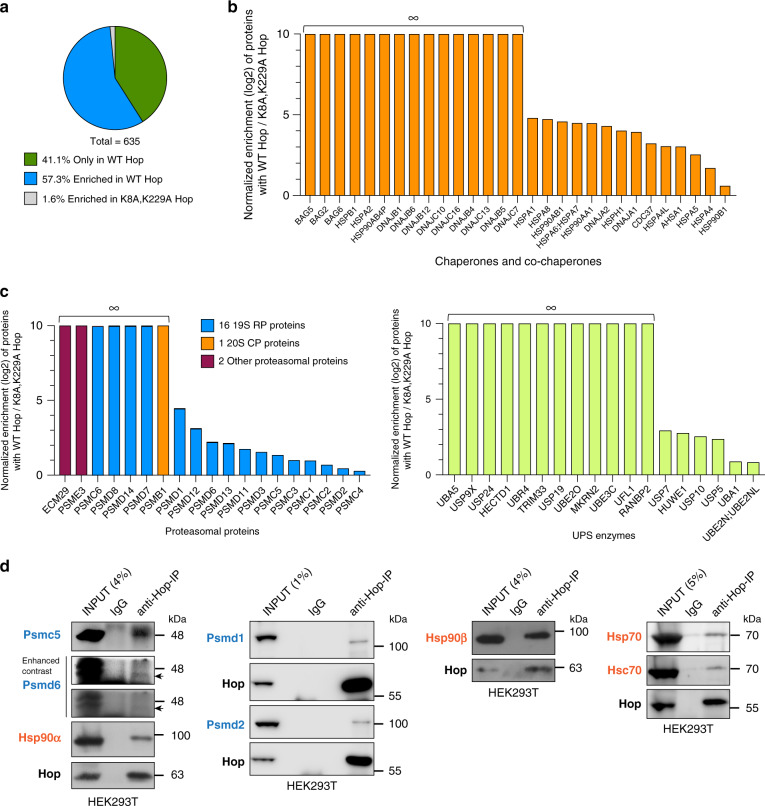
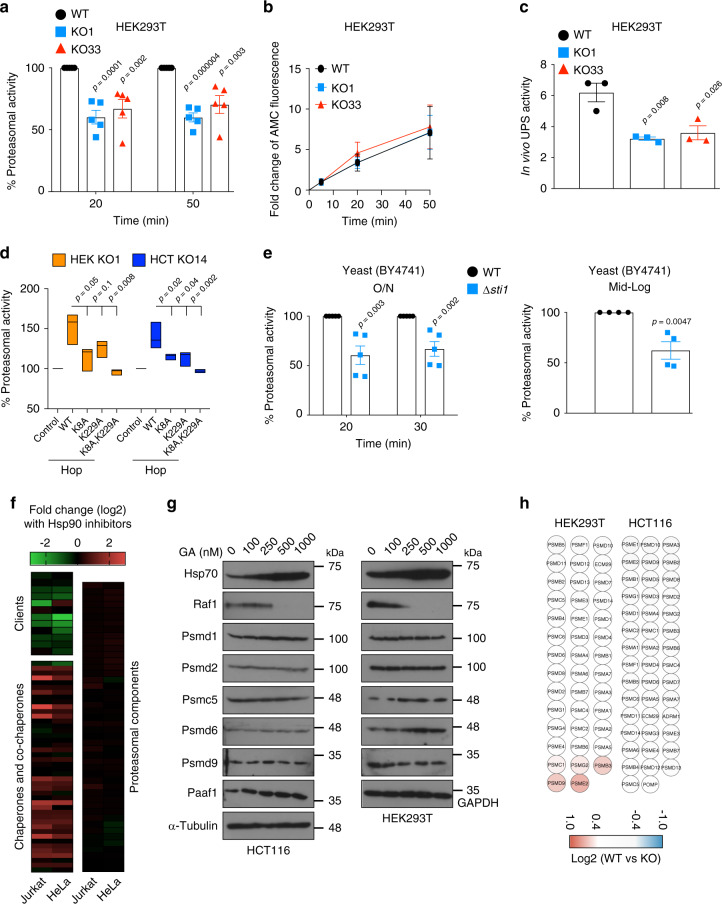
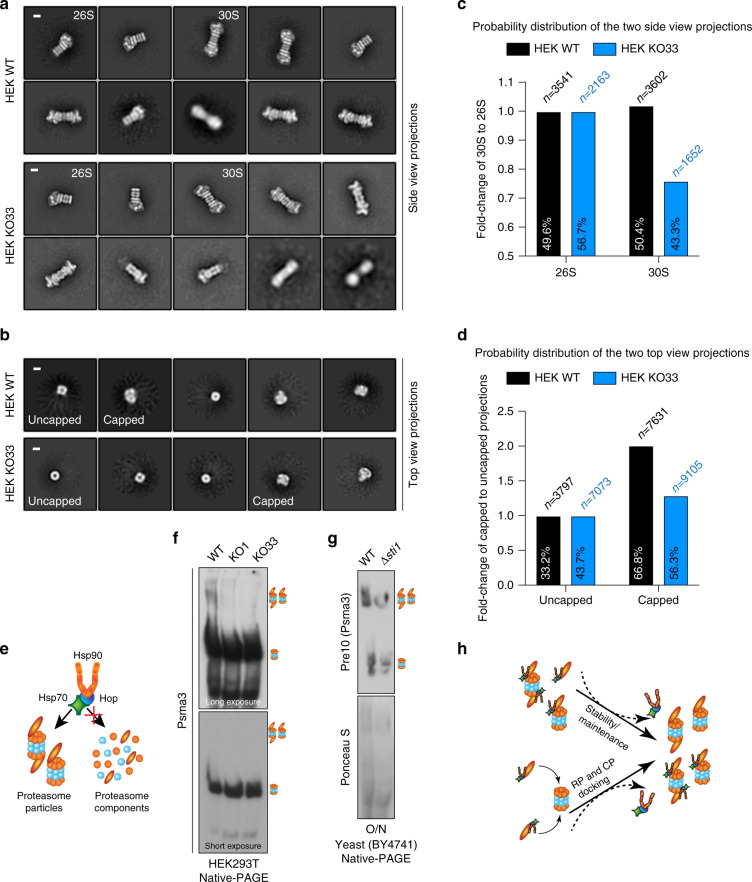
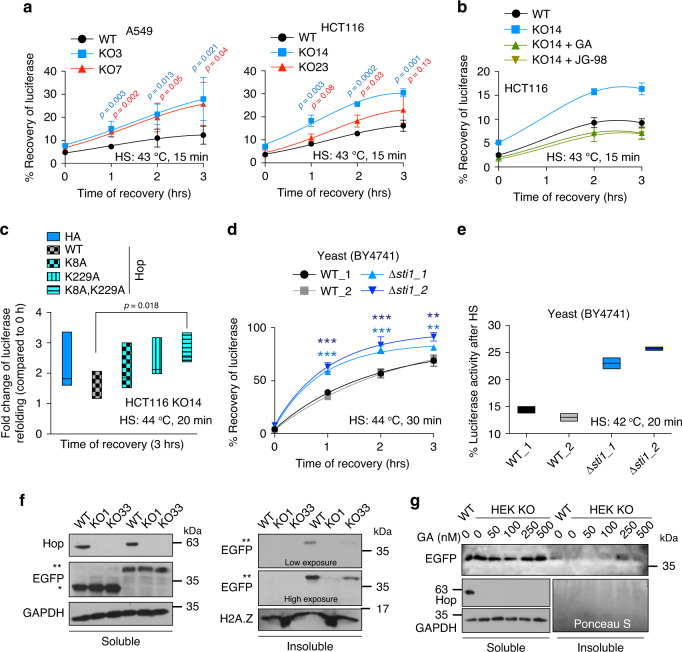
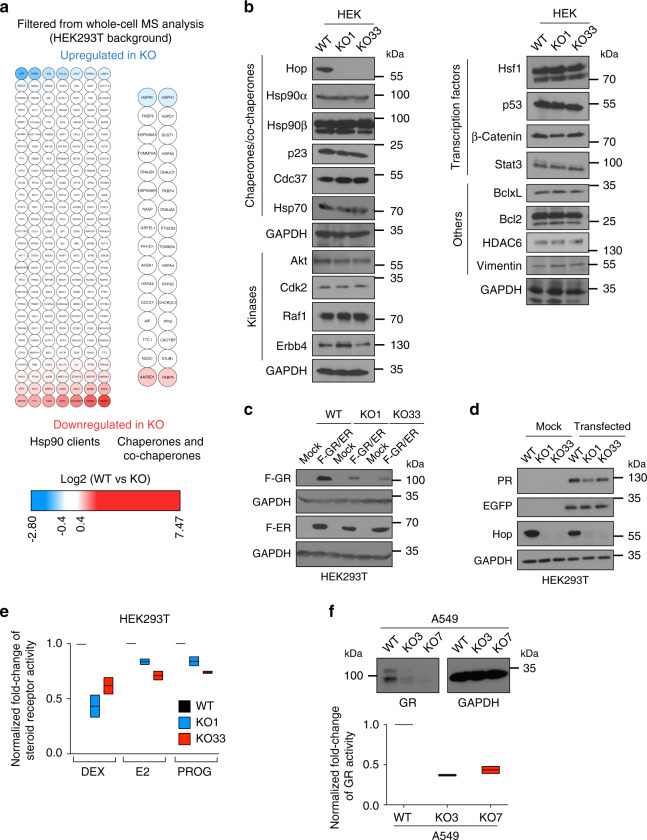
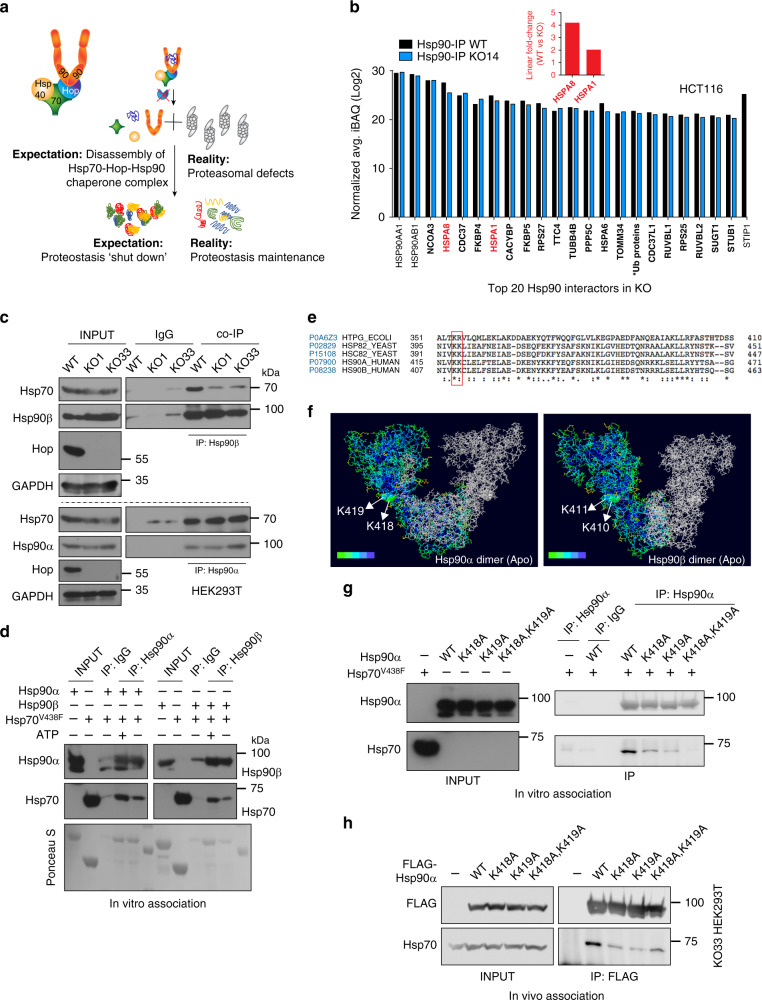
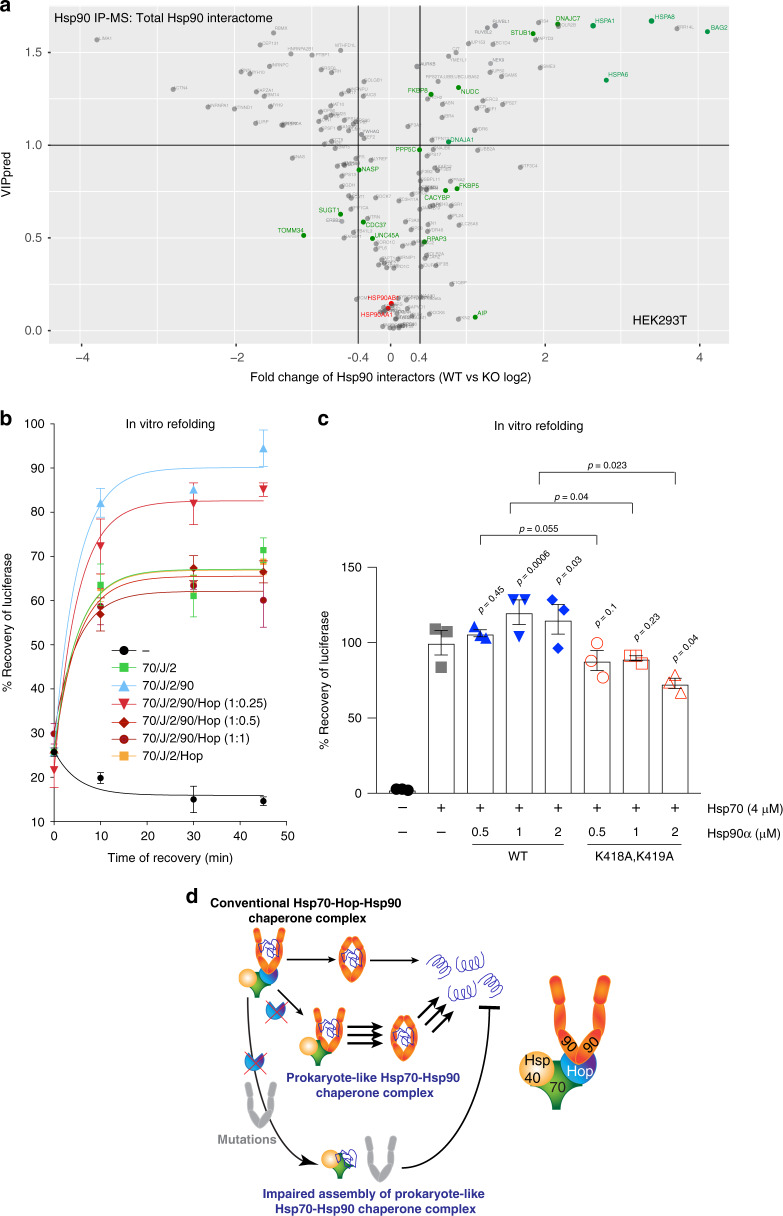
Hop/Stip1/Sti1 is thought to be essential as a co-chaperone to facilitate substrate transfer between the Hsp70 and Hsp90 molecular chaperones. Despite this proposed key function for protein folding and maturation, it is not essential in a number of eukaryotes and bacteria lack an ortholog. We set out to identify and to characterize its eukaryote-specific function. Human cell lines and the budding yeast with deletions of the Hop/Sti1 gene display reduced proteasome activity due to inefficient capping of the core particle with regulatory particles. Unexpectedly, knock-out cells are more proficient at preventing protein aggregation and at promoting protein refolding. Without the restraint by Hop, a more efficient folding activity of the prokaryote-like Hsp70-Hsp90 complex, which can also be demonstrated in vitro, compensates for the proteasomal defect and ensures the proteostatic equilibrium. Thus, cells may act on the level and/or activity of Hop to shift the proteostatic balance between folding and degradation.


Conflict of interest statement

The authors declare no competing interests.

Figures

Fig. 1
Fig. 1. Analyses of stress sensitivity and whole-cell proteome of human Hop KO cells.
a Immunoblot analysis of KO clones. b Volcano plot of the normalized fold changes of the whole-cell proteomes of WT and Hop KO cells. Proteins with VIPpred values > 1.0 are variables of interest and cutoffs of >0.4 or < −0.4 are considered significant. VIPpred, the values of the variable importance in projection (VIP) predicted components (pred) were derived as mentioned in Methods. LFQ label-free quantification value. c GO term enrichment analyses of biological processes in Hop KO cells. Blue text, stress response-related terms; red text, protein folding/refolding-related terms. d Flow cytometric quantification of cell death induced by indicated reagents (n = 3 biologically independent samples). e Flow cytometric quantification of apoptotic cells after 48 h of recovery at 37 °C after HS for 0 to 60 min; for left and right panels, n = 3 and n = 4 biologically independent samples, respectively. f Flow cytometric quantification of apoptotic cells after treatment with AZC (n = 4 biologically independent samples). For the bar graphs, data are presented as mean values ± SEM. The statistical significance between the groups was analyzed by two-tail unpaired Student’s t-tests. Source data are provided as a Source Data file.
Fig. 2
Fig. 2. KO cells are differentially dependent on proteasome and Hsp70-Hsp90 functions.
a Schematic representation of the proteostatic equilibrium relevant to this study. b Flow cytometric analysis of the GA-induced G2/M phase cell cycle arrest (left) and apoptosis (right). % G2/M phase arrest = % G2/M phase cells in inhibitor-treated sets—% G2/M phase cells in control experiment; % Apoptosis = % SubG0 phase cells in inhibitor-treated sets—% SubG0 phase cells in control experiment (n = 3 biologically independent samples). c Flow cytometric analysis of the JG-98-induced S-phase cell cycle arrest. % S-phase arrest = % S-phase cells in inhibitor-treated sets—% S-phase cells in control experiment (n = 3 biologically independent samples). d, e Flow cytometric analysis of the MG132- and PYR41-induced cell death. For panel d, n = 3–6 biologically independent samples depending on the treatment; for panel e, n = 3 biologically independent samples. fh Flow cytometric analyses of GA-induced apoptosis and G2/M phase cell cycle arrest, and MG132-induced cell death of KO cells overexpressing (OE) WT Hop. Cells transfected with empty vector serve as a control (n = 3 biologically independent samples). For the bar graphs, the data are represented as mean values ± SEM. For the box plots, data are represented as the median values and edges of the box plots represent the range of the data. Statistical significance was analyzed by two-tail unpaired (panels be) and paired (panels fh) Student’s t-tests. Source data are provided as a Source Data file.
Fig. 3
Fig. 3. Hop is associated with proteasomal proteins.
a The pie chart represents the indicated groups of direct or indirect Hop interactors identified by IP-MS analysis of HA-tagged WT Hop and its TPR double mutant exogenously overexpressed in KO1 cells. b Bar graph with normalized log2 fold changes of Hsp70-Hsp90-related chaperone and co-chaperone proteins immunoprecipitating with the HA-tagged WT Hop compared to its TPR double mutant from KO1 cells by MS analysis as demonstrated in Supplementary Fig. 3b. ∞, only identified with WT Hop (n = 2 biologically independent samples). c Bar graphs as in panel b highlighting proteasomal proteins (left) and UPS-related enzymes (right). ∞, only identified with WT Hop (n = 2 biologically independent samples). d Validation of indicated proteasomal (in blue) and molecular chaperone (in orange) interactors of Hop in WT HEK293T cells by Hop-co-IP experiments. Normal IgG served as a negative control. For the Psmd6 immunoblot, the arrow indicates the band of the correct molecular weight. Validation of Hop interactors was performed with at least n = 2 biologically independent samples except for Psmd1 and Psmd2 (n = 1). For bar graphs, the data are represented as mean values. Source data are provided as a Source Data file and Supplementary data file.
Fig. 4
Fig. 4. The Hsp70-Hop-Hsp90 ternary complex is required for proteasomal activity.
a In vitro steady-state proteasomal activity with cellular extracts at the indicated time points after initiation of the reaction with the reporter substrate suc-LLVY-AMC. Activity of WT cells was set to 100% for each time point (n = 5 biologically independent samples). b Rate of proteasomal activity determined with suc-LLVY-AMC. The AMC fluorescence at 5 min was set as base value, and all other time points normalized to that (n = at least 5 biologically independent samples). c Flow cytometric determination of in vivo UPS activity using the Ub-M-GFP and Ub-R-GFP reporter plasmids (n = 3 biologically independent samples). d In vitro steady-state proteasomal activity of extracts from KO cells overexpressing WT or TPR mutant Hop. The activity of mock transfected KO cells was set to 100%. HEK (n = 3 biologically independent samples) and HCT (n = 4 biologically independent samples), HEK293T and HCT116, respectively. e In vitro steady-state proteasomal activity of extracts of overnight (O/N, left panel; n = 5 biologically independent samples) and mid-log phase (right panel; n = 4 biologically independent samples) cultures of STI1 (WT) and Δsti1 yeast cells (strain BY4741). Activity of WT cells was set to 100% for each time point. f Heat maps of normalized fold changes of the levels of Hsp90 clients and co-chaperones, and proteasomal components in Jurkat and HeLa cells treated with the Hsp90 inhibitors geldanamycin (20 h) and 17-DMAG (24 h), respectively. These MS data are from previous publications,. Overexpressed and downregulated proteins are in red and green, respectively. g Immunoblots of proteasomal subunits from GA-treated WT cells; Hsp70, Raf1, and α-tubulin serve as controls. h Heat maps of the normalized fold changes of the levels of proteasomal proteins identified by whole-cell MS analyses. The scale bar represents the log2 fold changes (WT vs KO) of the LFQ values. For the bar and line graphs, the data are represented as mean values ± SEM. For box plots, data are represented as the median values and edges of the box plots represent the range of the data. The statistical significance between the groups was analyzed by two-tail unpaired Student’s t-tests. Source data are provided as a Source Data file.
Fig. 5
Fig. 5. Hsp70-Hop-Hsp90 ternary complex is required for proteasome assembly.
a, b 2D class-averaged images of purified proteasome particles obtained by negative staining TEM. The top 10 and 5 classes are presented here for the side views (panel a) and top views (b), respectively, of both the WT and KO samples. Representative side views of double-capped 30S and single-capped 26S particles, and representative top views of uncapped (CP face up, central hole visible) and capped (RP face up, central hole invisible) particles are indicated. Scale bar, 10 nm. c, d Quantitation of the fold changes of 30S over 26S (related to panel a) and capped over uncapped (related to panel b) proteasome particles between in WT and Hop KO samples. n, total numbers of structural projections of proteasome particles statistically analyzed with the software Relion. e Schematic representation of the involvement of the Hsp70-Hop-Hsp90 complex in proteasome particle assembly/maintenance rather than for individual proteasomal proteins. f, g Abundance of different proteasomal particles of human (n = 5 independent samples over three independent experiments) and yeast cells (n = 5 independent samples over 2 independent experiments) as indicated displayed by 4% native-PAGE and subsequent immunoblotting (with antibodies against the indicated proteasome component). Positions of 26S/30S proteasome particles and free 20S CP are indicated using the bands of purified proteasome particles as standards. Different exposures, for a given cell line, are from the same immunoblot. Nitrocellulose filters stained with Ponceau S indicate equal loading of proteins. h Models of how the Hsp70-Hop-Hsp90 ternary complex could enhance the abundance and stability of assembled 26S/30S proteasome particles.
Fig. 6
Fig. 6. Hsp70 and Hsp90 are functional in vivo even without Hop.
a In vivo refolding of heat-denatured luciferase. Luciferase activity before HS is set to 100%. Left panel, n = 4; right panel, n = 3 biologically independent samples. b In vivo luciferase refolding in HCT116 KO cells treated with inhibitors before and during the recovery phase (n = 3 biologically independent samples). c In vivo luciferase refolding in HCT116 KO cells exogenously overexpressing WT or TPR mutants of Hop. Non-HS controls for each sample are set 1-fold (n = 4 biologically independent samples). d In vivo refolding of heat-denatured luciferase in WT and Δsti1 yeast cells (BY4741 strain background; two different transformants each). ***p < 0.001 and **p < 0.01 statistically significant differences between WT and Δsti1 (n = 4 biologically independent samples). e Residual in vivo luciferase activity immediately after mild HS (n = 2 biologically independent samples). Luciferase activity before HS is set to 100%. f Solubility of aggregation-prone polyglutamine model protein. Immunoblots of Q23-EGFP (bands marked with *) and Q74-EGFP (**) from soluble and insoluble protein fractions. GAPDH and H2A.Z serve as loading controls for soluble and insoluble protein fractions, respectively. g Immunoblot of Q74-EGFP from soluble and insoluble protein fractions of KO cells treated with GA. The Ponceau S staining of the nitrocellulose filter serves as loading control for the insoluble protein fractions. For the line graphs, the data are represented as mean values ± SEM. For box plots, data are represented as the median values and edges of the box plots represent the range of the data. The statistical significance between the groups was analyzed by two-tail unpaired Student’s t-tests. Source data are provided as a Source Data file.
Fig. 7
Fig. 7. Hop KO only affects few specific Hsp90 clients.
a Heat maps of the normalized fold changes of the levels of Hsp90 clients (left), and molecular chaperones and co-chaperones (right) identified by whole-cell MS analyses. b Immunoblots of Hsp90 clients, Hsp90 partners and co-chaperones (n = 3 independent experiments). c Immunoblots of Flag-tagged GR (F-GR) and estrogen receptor α (F-ER) overexpressed in HEK293T cells (n = 2 independent experiments). d Immunoblots of the progesterone receptor (PR) overexpressed in HEK293T cells (n = 2 independent experiments). e Transcriptional activities of overexpressed GR (induced by dexamethasone (DEX)), ERα (induced by β-estradiol (E2)), and the PR (induced by progesterone (PROG)), as assayed with specific luciferase reporter genes (n = 2 biologically independent samples); data are represented as fold change relative to those of WT cells (set to 1). f Immunoblot of the endogenous levels of GR (top, n = 2 independent experiments), and its DEX-induced transcriptional activity determined with a transfected luciferase reporter (bottom, n = 2 biologically independent samples). For box plots, data are represented as the median values and edges of the box plots represent the range of the data. Source data are provided as a Source Data file.
Fig. 8
Fig. 8. Human Hsp70 and Hsp90 directly interact to form a prokaryote-like complex in the absence of Hop.
a Model of the impact of removing Hop on the Hsp70-Hsp90 molecular chaperone systems, the proteasome, and proteostasis. b Abundance of the top 20 Hsp90 interactors (highest iBAQ values). The graph shows the iBAQ values of the Hsp90 IP-MS analyses as log2. Hsp90α (HSP90AA1) and Hsp90β (HSP90AB1) were the bait proteins, and absence of Hop (STIP1) serves as quality control marker for KO cells (n = 3 biologically independent samples). Inset: Linear fold changes of the values for Hsp70 (HSPA1) and Hsc70 (HSPA8). *Ub proteins: UBB, UBC, UBA52, RPS27A. c In vivo interaction of Hsp90 and Hsp70 as determined by an IP experiment (n = 3 independent experiments). IgG, negative control IP with normal IgG. d IP experiment of in vitro interaction of purified recombinant Hsp90 and Hsp70 (n = 2 independent experiments). The substrate-binding mutant V438F of Hsp70 was used in this experiment. e Sequence alignments of yeast and human Hsp90 proteins with the bacterial Hsp90 HtpG. Evolutionarily conserved amino acids involved in the direct interaction of HtpG with Hsp70 (DnaK) in bacteria are highlighted by a red box. f Surface accessibility of the highlighted amino acids in the predicted dimeric human Hsp90 structures. The heat map represents a gradient of surface accessibility; most highly accessible amino acids are in green. g IP of in vitro interaction of purified recombinant WT or point mutant Hsp90α with Hsp70 (V438F) (n = 2 independent experiments). h IP of exogenously expressed FLAG-tagged WT or point mutant Hsp90α with endogenous Hsp70 (n = 2 independent experiments). For the bar graphs, the data are represented as mean values. Source data are provided as a Source Data file and a supplementary data file.
Fig. 9
Fig. 9. Prokaryote-like Hsp70-Hsp90 complex is functional both in human cells and in vitro.
a Volcano plot of the normalized fold changes of the Hsp90 interactors identified by Hsp90 IP-MS. Proteins with VIPpred >1.0 are variables of interest and cutoffs of >0.4 or <−0.4 are considered significant. Hsp90 related co-chaperones are highlighted in green and the two cytosolic Hsp90 isoforms in red (n = 3 biologically independent samples). b In vitro refolding of heat-denatured luciferase by the indicated combinations of recombinant human Hsp90α (90), Hsp70 (70), DnaJB1 (J) and Apg2 (2) with different concentrations of Hop (n = 3 biologically independent samples). c In vitro luciferase refolding assay as in b comparing WT and mutant Hsp90α (K418A,K419A) in the absence of Hop (n = 3 biologically independent samples). The refolding yield in the absence of Hsp90 was set to 100%. This value was used as reference to calculate the indicated p-values that are not associated with a horizontal bracket. Statistical significance was determined by a two-tailed paired Student’s t-test. d Model comparing the functions of Hsp70-Hsp90 complexes with and without Hop. For the bar and line graphs, the data are represented as mean values ± SEM. Source data are provided as a Source Data file.

Similar articles

Cited by

References

    1. Balch WE, Morimoto RI, Dillin A, Kelly JW. Adapting proteostasis for disease intervention. Science. 2008;319:916–919. doi: 10.1126/science.1141448. - DOI - PubMed
    1. Hipp MS, Park SH, Hartl FU. Proteostasis impairment in protein-misfolding and -aggregation diseases. Trends Cell Biol. 2014;24:506–514. doi: 10.1016/j.tcb.2014.05.003. - DOI - PubMed
    1. Labbadia J, Morimoto RI. The biology of proteostasis in aging and disease. Annu. Rev. Biochem. 2015;84:435–464. doi: 10.1146/annurev-biochem-060614-033955. - DOI - PMC - PubMed
    1. Wong E, Cuervo AM. Integration of clearance mechanisms: the proteasome and autophagy. Cold Spring Harb. Perspect. Biol. 2010;2:a006734. doi: 10.1101/cshperspect.a006734. - DOI - PMC - PubMed
    1. Chen B, Retzlaff M, Roos T, Frydman J. Cellular strategies of protein quality control. Cold Spring Harb. Perspect. Biol. 2011;3:a004374. doi: 10.1101/cshperspect.a004374. - DOI - PMC - PubMed

Publication types