. 2020 Nov 25;11(1):5974.
doi: 10.1038/s41467-020-19767-w.

Parabrachial nucleus circuit governs neuropathic pain-like behavior

Affiliations

Parabrachial nucleus circuit governs neuropathic pain-like behavior

Li Sun et al. Nat Commun. .

Abstract

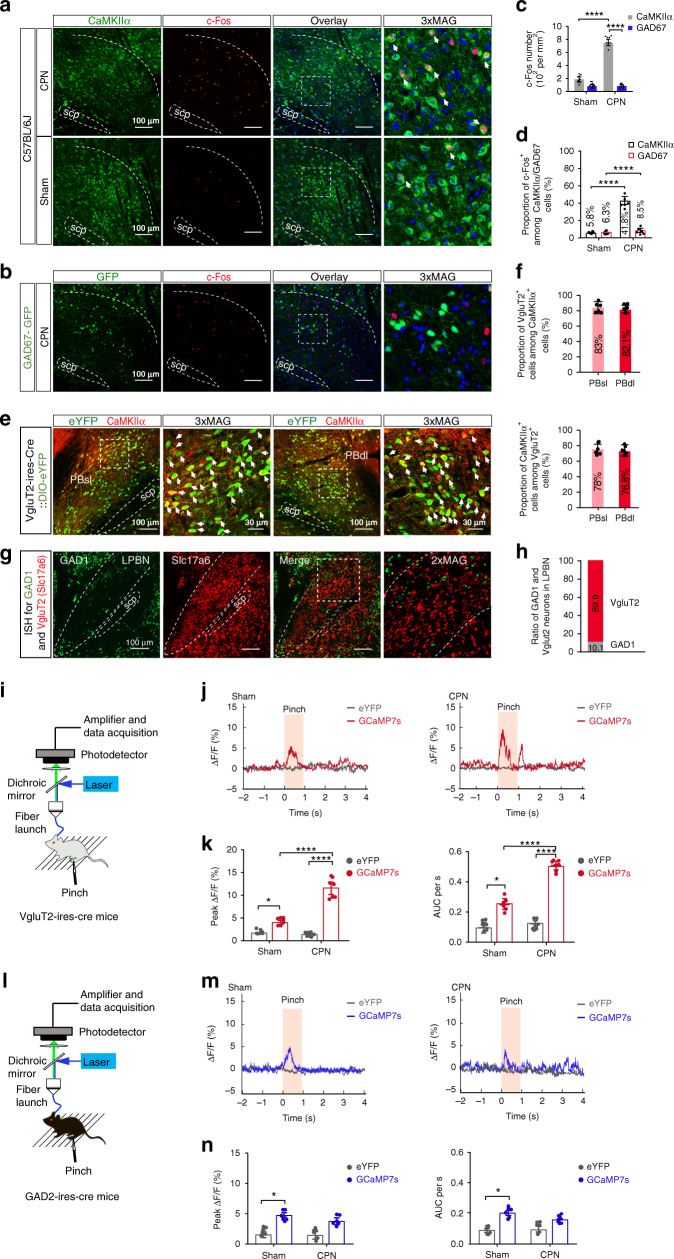
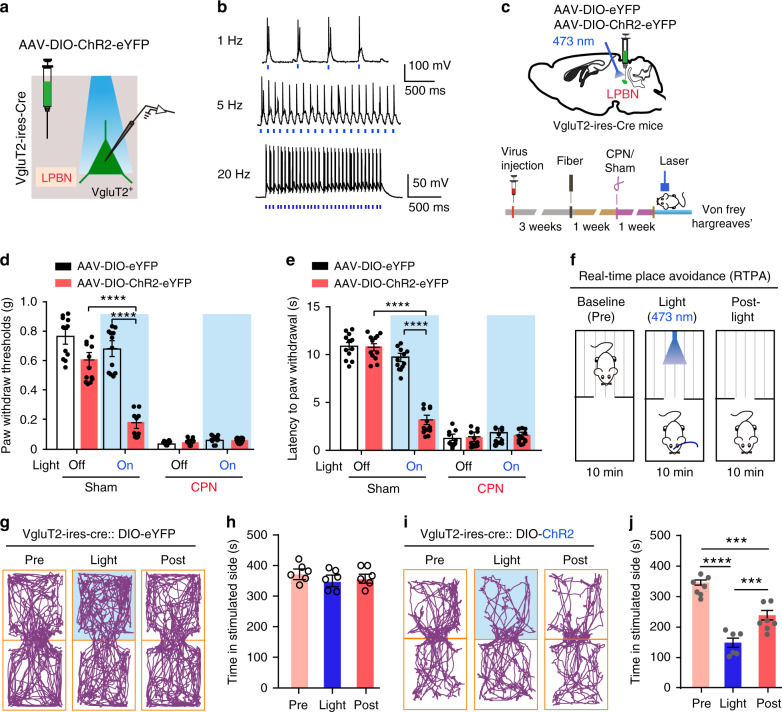
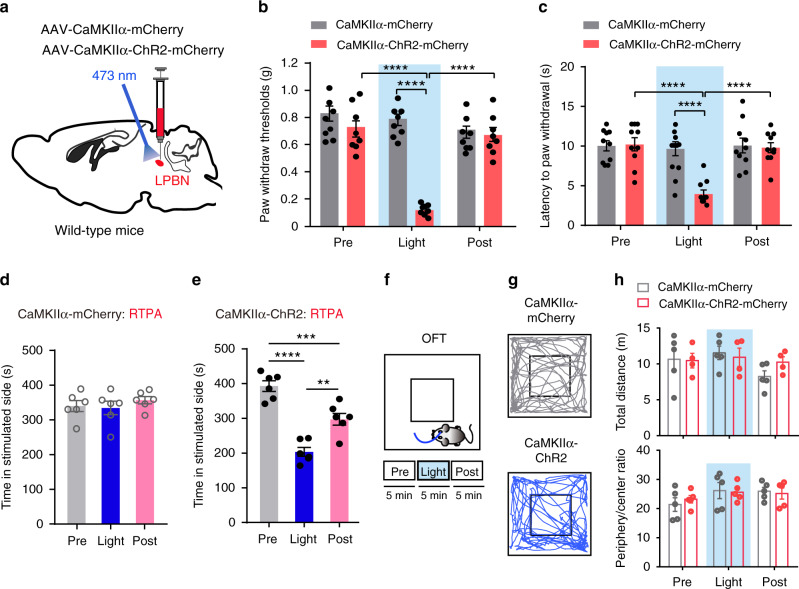
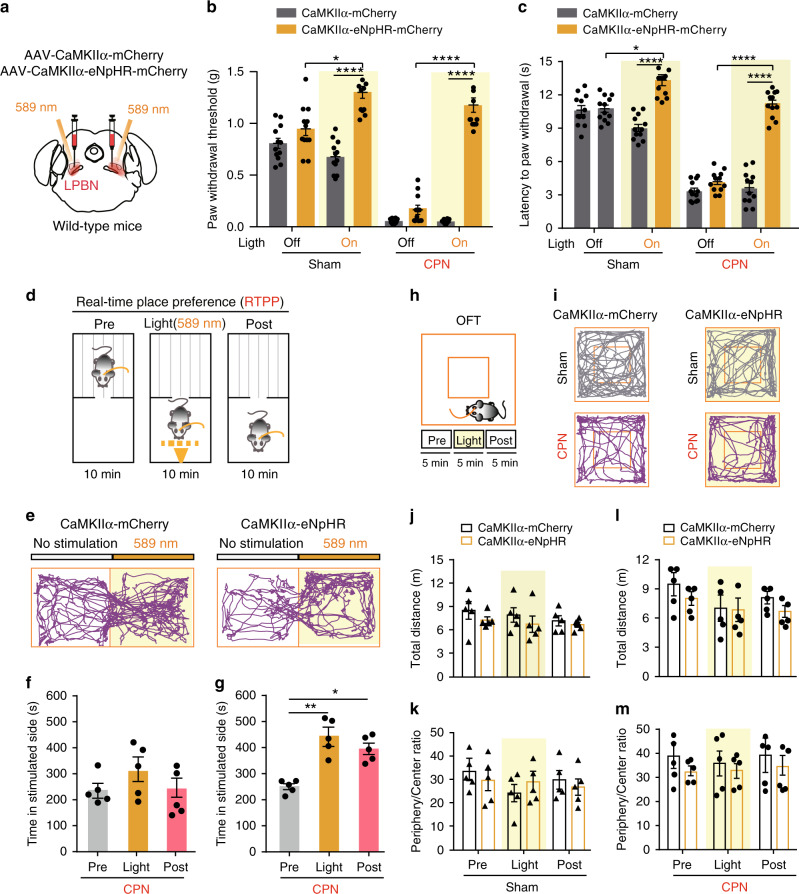
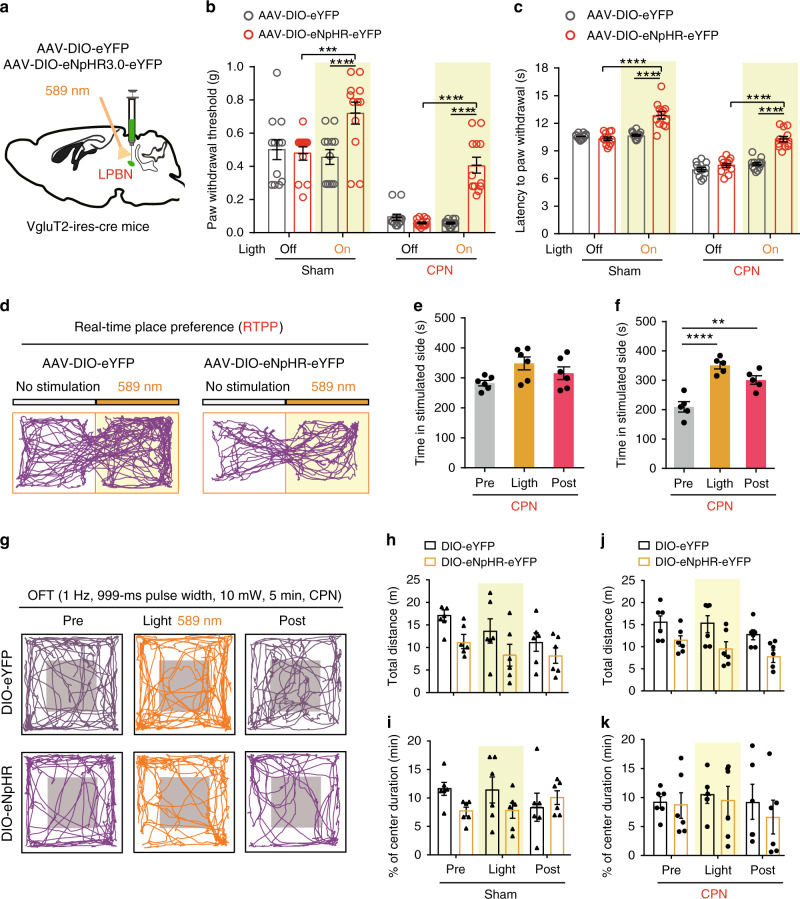
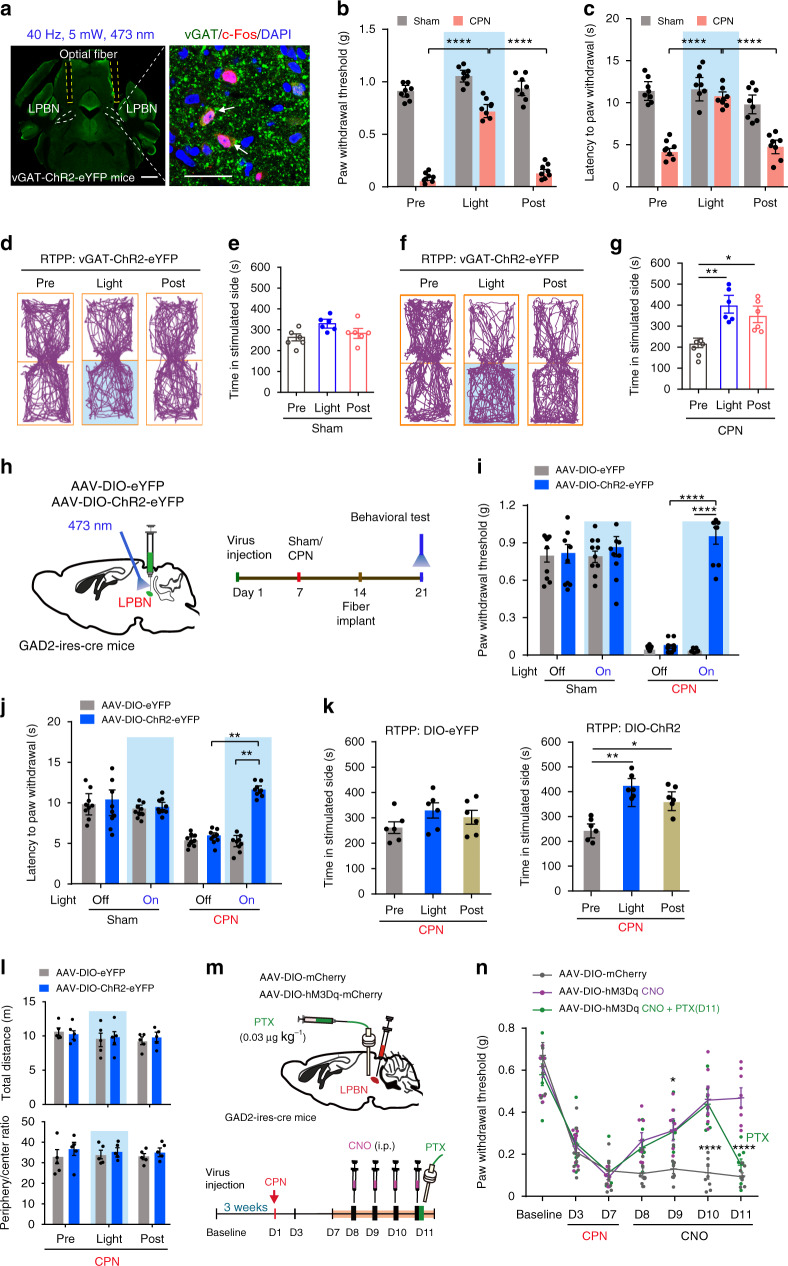
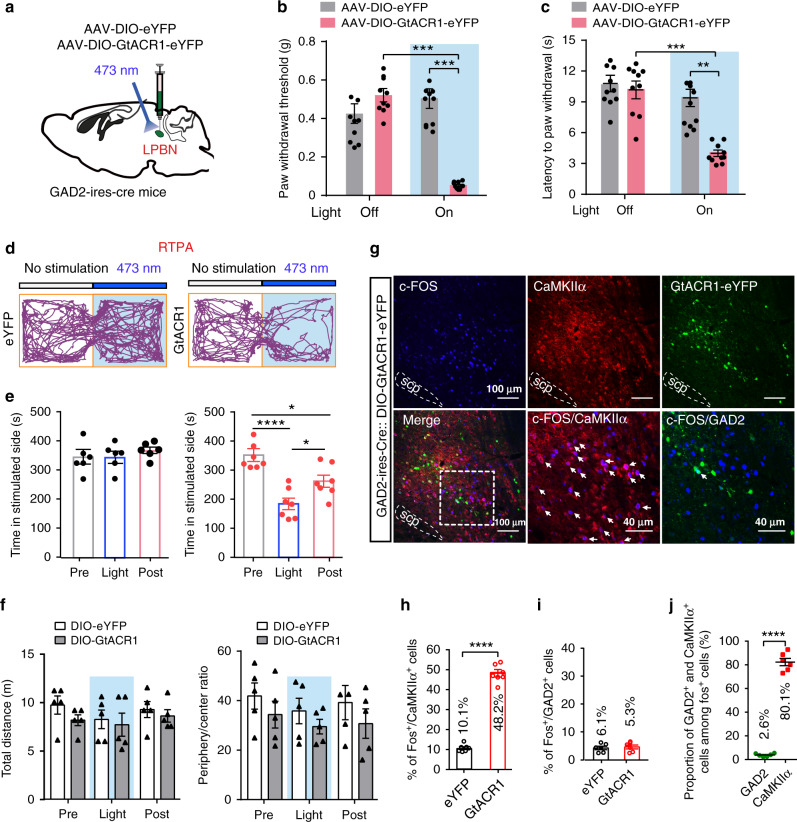
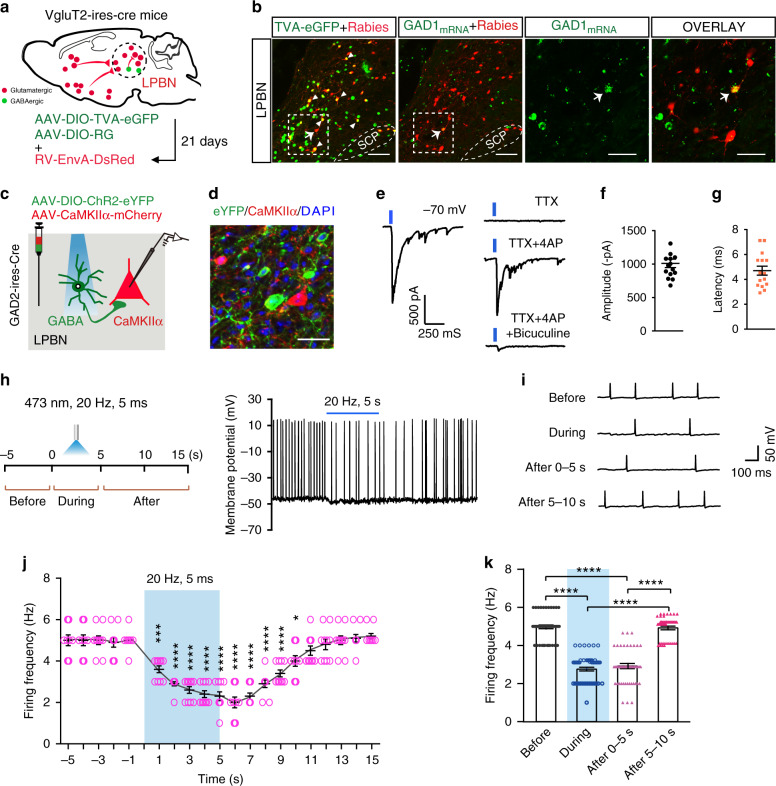
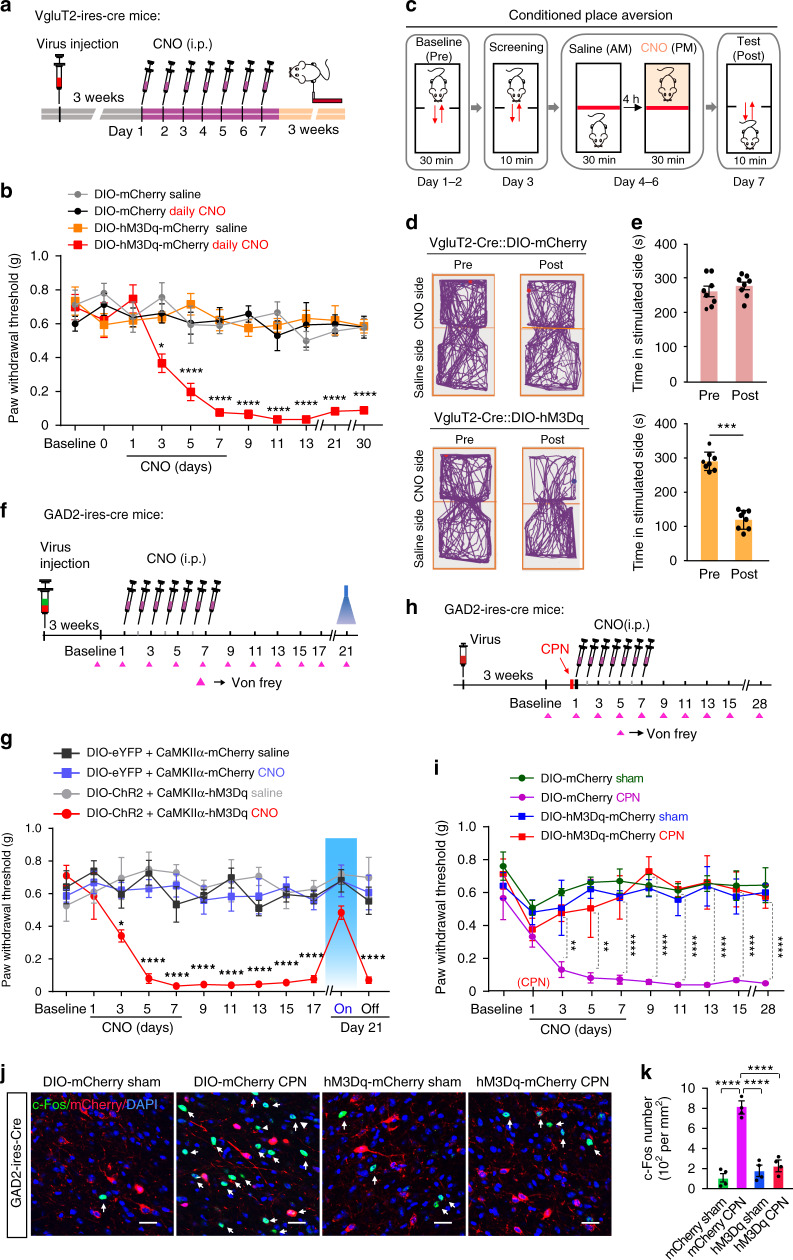
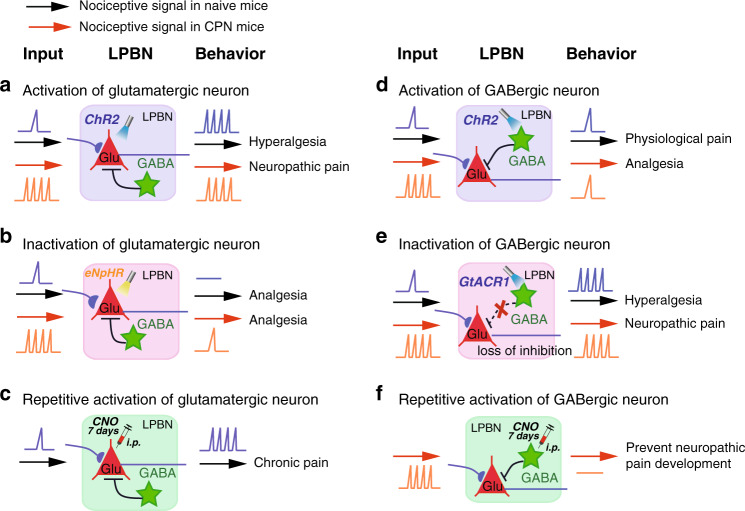
The lateral parabrachial nucleus (LPBN) is known to relay noxious information to the amygdala for processing affective responses. However, it is unclear whether the LPBN actively processes neuropathic pain characterized by persistent hyperalgesia with aversive emotional responses. Here we report that neuropathic pain-like hypersensitivity induced by common peroneal nerve (CPN) ligation increases nociceptive stimulation-induced responses in glutamatergic LPBN neurons. Optogenetic activation of GABAergic LPBN neurons does not affect basal nociception, but alleviates neuropathic pain-like behavior. Optogenetic activation of glutamatergic or inhibition of GABAergic LPBN neurons induces neuropathic pain-like behavior in naïve mice. Inhibition of glutamatergic LPBN neurons alleviates both basal nociception and neuropathic pain-like hypersensitivity. Repetitive pharmacogenetic activation of glutamatergic or GABAergic LPBN neurons respectively mimics or prevents the development of CPN ligation-induced neuropathic pain-like hypersensitivity. These findings indicate that a delicate balance between excitatory and inhibitory LPBN neuronal activity governs the development and maintenance of neuropathic pain.


Conflict of interest statement

The authors declare no competing interests.

Figures

Fig. 1
Fig. 1. CPN ligation activates glutamatergic LPBN neurons.
a Representative images of co-labeling (arrowheads) of CaMKIIα-positive neurons and c-Fos immunoreactivity in the LPBN (white dashed lines). Rightmost panels, 3 times magnification of the boxed areas in the left panels. Scale bars, 100 μm. b Example images showing c-Fos positive (red) and GAD67-GFP-expressing cells in the LPBN one week after CPN ligation. Rightmost panel, 3 times magnification of the boxed area in the left panel. Blue, DAPI staining. Scale bars, 100 μm. c Density of c-Fos-positive cells in CaMKIIα-expressing and GAD67-GFP-expressing cells in the LPBN. d Proportions of CaMKIIα or GAD67-GFP-positive cells co-expressed with c-Fos in the LPBN. e Representative images of neurons expressing VgluT2-eYFP co-localize (arrows) with the CaMKIIα in PBsl (left two panels) and PBdl (right two panels). 3xMAG (the second and fourth panels), 3 times magnification of the boxed area in the first and the third panels, respectively. Scale bars, 100 μm and 30 μm (3xMAG). f Percentage of CaMKIIα-positive neurons that co-express VgluT2 (upper) and percentage of VgluT2-positive neurons that co-express CaMKIIα (lower). n = 898 (PBsl) and 856 (PBdl) neurons from 5 sections from 5 mice. g Representative in situ hybridization for the GAD1 (green) and VgluT2 (red, Slc17a6) in LPBN. Scale bars, 100 μm. Rightmost panels, 2× magnification of the boxed area in the left panel. h Ratio of Vglut2 or GAD1-positive neurons in the LPBN as in g. n = 6 sections from 6 mice. i, l Schematic of the recording system for the Ca2+ signal in LPBN neurons with fiber photometry in VgluT2-ires-Cre mice (i) and GAD2-ires-Cre mice (l). j, m Representative fluorescence signals (ΔF/F) of GCaMP7s (red) and eYFP (dark gray) recorded from glutamatergic (j) or GABAergic (m) LPBN neurons transfected with DIO-GCaMP7s or DIO-eYFP aligned to the pinch stimulation. k, n Averaged peak ΔF/F (left) and area under the curve (AUC) per second (right) of GCaMP7s and eYFP fluorescence signals from glutamatergic (k) or GABAergic (n) LPBN neurons. All data are presented as mean ± s.e.m. and error bars represent s.e.m. *P < 0.05 and ****P < 0.0001. See also Supplementary Table 1 for further statistical information. Source data are provided as a Source Data file.
Fig. 2
Fig. 2. Optogenetic activation of VgluT2 neurons in LPBN induces hyperalgesia and place avoidance behavior.
a Schematic of light stimulation of and patch-clamp recording from glutamatergic LPBN neurons transfected with AAV-Cre-on-ChR2-eYFP in brain slices from VgluT2-ires-Cre mice. b Example patch-clamp recordings showing light stimulation-induced time-locked action potential firing in ChR2-expressing VgluT2 neurons in the LPBN. Blue bars indicate application of light stimuli (473 nm, 5 ms, ~5 mW) at 1 Hz (upper), 5 Hz (middle), and 20 Hz (lower). c Schematic of stereotaxic delivery of AAV carrying Cre-dependent ChR2 into the LPBN of VgluT2-ires-Cre mice (upper) and experimental design and timeline of the behavioral experiments (lower). d Illumination (473 nm, 20 Hz, 5-ms pulse width, ~5 mW) of the LPBN significantly decreases the paw-withdraw thresholds (PWT) in response to von Frey mechanical stimulation in Sham-operated mice transfected with ChR2-eYFP, but not in mice transfected with eYFP in VgluT2 LPBN neurons. e Illumination (473 nm, 20 Hz, 5-ms pulse width, ~5 mW) of the LPBN significantly decreases the latency of the thermal paw-withdraw response in the Hargreaves test in Sham-operated mice transfected with ChR2-eYFP, but not in mice transfected with eYFP in VgluT2 LPBN neurons. f Schematic of the real-time place avoidance (RTPA) test. g–j Representative tracks (g, i) and quantification of time spent in the preferred chamber (h, j) in the RTPA test before (Pre), during (Light), and immediately after (Post) laser illumination (473 nm, 20 Hz, 5-ms pulse width, ~5 mW) of the LPBN transfected with eYFP (g, h) or ChR2 (i, j) in Vgltu2-ires-Cre mice. All data are presented as mean ± s.e.m. and error bars represent s.e.m. ***P < 0.001 and ****P < 0.0001. See also Supplementary Table 1 for further statistical information. Source data are provided as a Source Data file.
Fig. 3
Fig. 3. Optogenetic activation of LPBNCaMKIIα neurons induces hyperalgesia and place avoidance behavior.
a Schematic of the stereotaxic delivery of AAV carrying CaMKIIα-ChR2 into the LPBN of wild-type mice. b Light activation (473 nm, 20 Hz, 5-ms pulse width, ~5 mW) of LPBNCaMKIIα neurons significantly decreases the PWT induced by von Frey stimulation in mice injected with AAV-CaMKIIα-ChR2-mCherry, compared with mice injected with AAV-CaMKIIα-mCherry. No significant difference was found between before (Pre) and after (Post) light stimulation. c Light activation (473 nm, 20 Hz, 5-ms pulse width, ~5 mW) of LPBNCaMKIIα neurons significantly decreases thermal paw-withdrawal latency measured by the Hargreaves test in mice injected with AAV-CaMKIIα-ChR2-mCherry, compared with mice injected with AAV-CaMKIIα-mCherry. No significant difference was found between before (Pre) and after (Post) light stimulation. d, e Quantification of time spent in the preferred chamber in the RTPA test before (Pre), during (Light), and after (Post) 10-min illumination of the LPBN in mice transfected with AAV-CaMKIIα-mCherry (d) and AAV-CaMKIIα-ChR2-mCherry (e). f Schematic of the open field test (OFT) with photostimulation via a 473-nm laser (Pre, Light, and Post; 5 min for each stage). g Example traces of the OFT from mice with AAV-CaMKIIα-mCherry (upper) and AAV-CaMKIIα-ChR2-mChreey (lower) injected into the LPBN. h Quantification of the total distance moved (upper) and ratio of time spent in the periphery and center (lower) in the OFT before (Pre), during (Light), and after (Post) 10-min illumination of the LPBN in wild-type mice transfected with AAV-CaMKIIα-mCherry and AAV-CaMKIIα-ChR2-mCherry. All data are presented as mean ± s.e.m. and error bars represent s.e.m. ***P < 0.001 and ****P < 0.0001. See also Supplementary Table 1 for further statistical information. Source data are provided as a Source Data file.
Fig. 4
Fig. 4. Photoinhibition of LPBNCaMKIIα neurons alleviates both basal nociception and neuropathic pain-like hypersensitivity.
a Schematic of the light illumination and virus injection strategy for the expression of CaMKIIα-eNpHR or CaMKIIα-mCherry in the LPBN of wild-type mice. b Yellow illumination (589 nm, 1 Hz, 999-ms pulse width, 10 mW) of the LPBN significantly elevates the PWT in response to mechanical stimulation in both Sham-operated and CPN-ligated mice transfected with AAV-CaMKIIα-eNpHR, but not in mice transfected with CaMKIIα-mCherry in the LPBN. c Yellow illumination (589 nm, 1 Hz, 999-ms pulse width, 10 mW) of the LPBN significantly increases the latency of the thermal paw-withdrawal response in the Hargreaves test in both Sham-operated and CPN-ligated mice transfected with AAV-CaMKIIα-eNpHR, but not in mice transfected with CaMKIIα-mCherry in the LPBN. d Schematic of the real-time place preference (RTPP) test. e Representative tracks of RTPP illustrating yellow (589 nm) light-evoked behavioral preference in CPN-ligated mice injected with AAV-CaMKIIα-mCherry (left) or CaMKIIα-eNpHR (right) virus in the LPBN. f, g Quantification of RTPP in CPN-ligated mice before (Pre), during (Light), and after (Post) 10-min yellow illumination of the LPBN in mice injected with AAV-CaMKIIα-mCherry (f) or CaMKIIα-eNpHR (g). h Schematic of the open field test (OFT) before (Pre), during (Light), and after (Post) 5 min photoinhibition (589 nm, 1 Hz, 999-ms pulse width, 10 mW) of LPBNCaMKIIα neurons. i Representative tracks of mice transfected with CaMKIIα-mCherry (left) or CaMKIIα-eNpHR (right) in the LPBN with yellow laser illumination (589 nm) in Sham-operated (upper) or CPN-ligated (lower) wild-type mice. jm Quantification of total distance moved (j, l) and ratio of time spent in the periphery and center (k, m) in the OFT before (Pre), during (Light), and after (Post) 5 min yellow light illumination of the LPBN in mice transfected with CaMKIIα-mCherry or CaMKIIα-eNpHR in Sham-operated (j, k) and CPN-ligated (l, m) mice. All data are presented as mean ± s.e.m. and error bars represent s.e.m. *P < 0.05, **P < 0.01, and ****P < 0.0001. See also Supplementary Table 1 for further statistical information. Source data are provided as a Source Data file.
Fig. 5
Fig. 5. Photoinhibition of LPBNVgluT2 neurons alleviates both basal nociception and neuropathic pain-like hypersensitivity.
a Schematic of illumination and virus injection of AAV-DIO-eYFP and AAV-DIO-eNpHR-eYFP in the LPBN of VgluT2-ires-Cre mice. b Yellow illumination (589 nm, 1 Hz, 999-ms pulse width, 10 mW) of LPBNVglut2 neurons significantly elevates the PWT in response to mechanical stimulation in both Sham-operated and CPN-ligated VgluT2-ires-Cre mice transfected with AAV-DIO-eNpHR virus, but not in mice transfected with DIO-eYFP virus. c Yellow illumination (589 nm, 1 Hz, 999-ms pulse width, 10 mW) of the LPBN significantly increases the latency of the thermal paw-withdrawal response in the Hargreaves test in both Sham-operated and CPN-ligated VgluT2-ires-Cre mice transfected with AAV-DIO-eNpHR virus, but not in mice transfected with DIO-eYFP virus. d Representative tracks of RTPP illustrating yellow (589 nm) light-evoked behavioral preference in CPN-ligated VgluT2-ires-Cre mice injected with AAV-DIO-eYFP (left) or DIO-eNpHR (right) virus in the LPBN. e, f Quantification of RTPP in CPN-ligated mice before (Pre), during (Light), and after (Post) 10-min yellow illumination of the LPBN in VgluT2-ires-Cre mice injected with AAV-DIO-eYFP (e) or AAV-DIO-eNpHR (f) virus. g Representative tracks in the open field test (OFT) before (Pre), during (Light), and after (Post) 5-min yellow laser illumination (589 nm, 1 Hz, 999-ms pulse width, 10 mW) of LPBNVglut2 neurons transfected with DIO-eYFP (upper) or DIO-eNpHR (lower) virus in CPN-ligated VgluT2-ires-Cre mice. hk Quantification of total distance moved (h, j) and ratio of time spent in the periphery and center (i, k) in the OFT in VgluT2-ires-Cre mice transfected with DIO-eYFP or DIO-eNpHR virus in Sham-operated ((h, i) and CPN-ligated (j, k) mice. All data are presented as mean ± s.e.m. and error bars represent s.e.m. *P < 0.05, **P < 0.01, and ****P < 0.0001. See also Supplementary Table 1 for further statistical information. Source data are provided as a Source Data file.
Fig. 6
Fig. 6. Optogenetic stimulation of LPBN GABAergic neurons suppresses neuropathic pain-like hypersensitivity, but not basal nociception.
a Image showing optic fibers position in the LPBN (left; scale bar, 1 mm) and c-Fos (red) co-labeled with vGAT-positive neurons (green) in the LPBN after optogenetic stimulation (right; arrows, double-labeled neurons; scale bar, 30 μm). b, c Photoactivation of GABAergic LPBN neurons elevate the PWT (b) and thermal paw-withdrawal latency (c) in CPN-ligated, but not in Sham-operated vGAT-ChR2-eYFP mice. d, f Tracking maps of RTPP from a Sham (d) and a CPN-ligated mouse (f) before, during, and after optogenetic stimulation of GABAergic LPBN neurons. e, g Quantification of time spent in stimulated side as shown in d and f. h Schematic of virus delivery (left) and timeline of the behavioral experiments (right). i, j Optogenetic activation of the GABAergic LPBN neurons increased the PWT (i) and thermal paw-withdrawal latency (j) in CPN-ligated mice, but not in Sham-operated mice or in mice transfected with DIO-eYFP. k Quantification of time spent in the non-preferred RTPP chamber before (Pre), during (Light), and after (Post) laser stimulation of CPN-ligated GAD2-ires-Cre mice transfected with AAV-DIO-eYFP (left) or AAV-DIO-ChR2-eYFP (right). l Quantification of total distance moved (upper) and ratio of time spent in the periphery and center (lower) in the OFT before (Pre), during (Light), and after (Post) light stimulation of GABAergic LPBN neurons in GAD2-ires-Cre mice. m Experimental design for pharmacogenetic activation of GABAergic LPBN neurons. n Time-course of the CPN ligation-induced decrease in PWT and the effect of pharmacogenetic activation of GABAergic LPBN neurons which was reversed by administration of PTX (0.03 μg kg−1) via a cannula into the LPBN at day 11. All data are presented as mean ± s.e.m. and error bars represent s.e.m. *P < 0.05, **P < 0.01, and ****P < 0.0001. See also Supplementary Table 1 for further statistical information. Source data are provided as a Source Data file.
Fig. 7
Fig. 7. Optogenetic inhibition of GABAergic LPBN neurons induced neuropathic pain-like symptoms.
a Schematic of the stereotaxic delivery of AAV-DIO-GtACR1-eYFP and AAV-DIO-eYFP into the LPBN of GAD2-ires-Cre mice and photoinhibition of GABAergic LPBN neurons. b Photoinhibition (473 nm, 40 Hz, 5 mW) of GABAergic LPBN neurons decreases the PWT in GAD2-ires-Cre mice transfected with AAV-DIO-GtACR1-eYFP. c Photoinhibition of GABAergic LPBN neurons decreases thermal withdraw latency in GAD2-ires-Cre mice transfected with AAV-DIO-GtACR1-eYFP. d Representative tracks in RTPA during 10-min illumination of the LPBN in GAD2-ires-Cre mice transfected with AAV-DIO-eYFP (left) or AAV-DIO-GtACR1-eYFP (right). e Quantification of time spent in the preferred chamber in the RTPA test before (Pre), during (Light), and after (Post) 10-min illumination of the LPBN in GAD2-ires-Cre mice transfected with AAV-DIO-eYFP (left) or AAV-DIO-GtACR1-eYFP (right). f Quantification of total distance moved (left) and ratio of time spent in the periphery and center (right) in the OFT before (Pre), during (Light), and after (Post) 10-min illumination of GABAergic LPBN neurons in GAD2-ires-Cre mice transfected with AAV-DIO-eYFP or AAV-DIO-GtACR1-eYFP. g Representative images of c-Fos expression (blue) 1 h after optogenetic inhibition (473 nm, 5 mW, 10 min) of GABAergic LPBN neurons in GAD2-ires-Cre mice transfected with AAV-DIO-GtACR1-eYFP. Lower middle and lower right panels show magnified views of the boxed area in the lower left panel. Note that c-Fos-positive cells co-localize with CaMKIIα (red), but not with GtACR1-eYFP (GAD2, green). Arrows indicate CaMKIIα+ neurons co-labeled with c-Fos. Scale bars, 100 μm and 40 μm (lower middle and lower right panels). h, i Quantification of cells expressing c-Fos induced by illumination of GABAergic LPBN neurons in GAD2-ires-Cre mice transfected with AAV-DIO-GtACR1-eYFP or AAV-DIO-eYFP as in g. j Proportion of c-Fos-positive cells that co-express GAD2-eYFP or CaMKIIα+ cells 1 h after optogenetic inhibition of GABAergic LPBN neurons as shown in g. All data are presented as mean ± s.e.m. and error bars represent s.e.m. *P < 0.05, **P < 0.01, ***P < 0.001, and ****P < 0.0001. See also Supplementary Table 1 for further statistical information. Source data are provided as a Source Data file.
Fig. 8
Fig. 8. GABAergic LPBN neurons monosynaptically innervate local glutamatergic neurons.
a Schematic of monosynaptic retrograde rabies virus tracing from glutamatergic LPBN neurons. b Representative images showing monosynaptic rabies spread from glutamatergic LPBN neurons in VgluT2-ires-Cre mice. Arrowheads, starter neurons infected by both TVA-eGFP (green) and rabies virus (red). The arrow indicates a GABAergic neuron (labeled with GAD1 mRNA, green) that was trans-synaptically infected by rabies virus. The third and fourth panels from the left show magnified views of the boxed areas in the second panel. Scale bars, 100 μm and 30 μm (magnified views). c Schematic of patch clamp recording from glutamatergic LPBN neurons transfected with AAV-CaMKIIα-mCherry in response to light stimulation of GABAergic LPBN neurons transfected with AAV-DIO-ChR2-eYFP. d Example image showing the expression of ChR2 in GABAergic neurons (green) and mCherry in CaMKIIα neurons (red) for targeted whole-cell patch-clamp recordings as in c. Scale bar, 30 μm. e Example of light-evoked IPSCs recorded from mCherry-positive glutamatergic neurons at a holding potential of –70 mV (left panel). The IPSCs were blocked by 1 μM TTX, and they were rescued by 100 μM 4-AP and blocked again by 10 μM bicuculline (right panel). n = 12 cells in 6 slices from 4 mice. f, g Averaged amplitude and latency of recorded IPSCs as in o. n = 15 traces recorded in 6 slices from 4 mice. h Workflow (left) and representative current clamp recording trace (right) of spontaneous spikes in an mCherry-positive LPBNCaMKIIα neuron at a holding potential of –45 mV. i Extended traces from (h) with a slow time scale showing light-induced changes in spike frequency of an LPBNCaMKIIα neuron sampled before, during, and after light stimulation of GABAergic LPBN neurons. j Time course of summarized changes in spike frequency of LPBN CaMKIIα neurons induced by light stimulation of GABAergic LPBN neurons. k Averaged firing frequency of LPBN CaMKIIα neurons during each period as indicated. All data are presented as mean ± s.e.m. and error bars represent s.e.m. *P < 0.05, **P < 0.01, and ****P < 0.0001. See also Supplementary Table 1 for further statistical information. Source data are provided as a Source Data file.
Fig. 9
Fig. 9. Persistent activation of glutamatergic and GABAergic LPBN neurons, respectively, develops and prevents neuropathic pain-like hypersensitivity.
a Experimental design and timeline of the behavioral experiment. b Time-course of PWT changes induced by daily injection of CNO (i.p., 1.5 mg kg−1) for one week in VgluT2-ires-Cre mice. c Schematic of the experiment design for conditioned place aversion (CPA). d Examples of tracking maps in the CPA before (Pre) and after (Post) injection of CNO (i.p., 1.5 mg kg−1) into the LPBN of VgluT2-ires-Cre mice transfected with DIO-mCherry (upper) or DIO-hM3Dq-mCherry (lower). e Quantification of time spent in the preferred chamber as in d. f Experimental design and timeline of the behavioral experiment in GAD2-ires-Cre mice simultaneously transfected with two types of virus in the LPBN, one carrying DIO-eYFP (control) or DIO-ChR2-eYFP and the other carrying CaMKIIα-mCherry (control) or CaMKIIα-hM3Dq-mCherry. g Time-course of PWT changes induced by daily injection of CNO (i.p., 1.5 mg kg−1) for one week in GAD2-ires-Cre mice. A persistent decrease in PWT was induced only in mice injected with CNO and transfected with CaMKIIα-hM3Dq-mCherry, but not in the other groups. Note that illumination (473 nm, 40 Hz, 5 mW) of GABAergic LPBN neurons on day 21 reversibly elevated the PWT in mice transfected with DIO-ChR2-eYFP. h Experimental design and timeline of the behavioral experiment. i Daily injection of CNO for one week initiated on the same day as CPN ligation prevented the development of neuropathic pain-like hypersensitivity in mice transfected with DIO-hM3Dq-mCherry (red), but not in mice transfected with DIO-mCherry. j Representative images showing c-Fos expression (green, arrows) and GABAergic neurons transfected with mCherry or hM3Dq-mCherry (red) in the LPBN from Sham-operated and CPN-ligated mice. Scale bar, 30 μm. Blue, DAPI stain). k Quantification of c-Fos-positive cells in the LPBN from different groups as in j. All data are presented as mean ± s.e.m. and error bars represent s.e.m. *P < 0.05, **P < 0.01, and ****P < 0.0001. See also Supplementary Table 1 for further statistical information. Source data are provided as a Source Data file.
Fig. 10
Fig. 10. Schematic summary of the main findings illustrating how activity in the LPBN circuit governs physiological and pathological pain-like hypersensitivity.
a Light-activation of glutamatergic neurons induces hyperalgesia in naive mice to an extent similar to that in CPN-ligated mice. b Light-inactivation of glutamatergic neurons induces analgesia in both naive and CPN-ligated mice. c Daily pharmacogenetic activation of glutamatergic neurons for one week induces chronic nociception, mimicking neuropathic pain. d Light-activation of GABAergic neurons inhibits neuropathic pain-like hypersensitivity, but not basal nociception. e Light-inactivation of GABAergic neurons induces hyperalgesia in naive mice to an extent similar to that in CPN-ligated mice. f Daily pharmacogenetic activation of GABAergic neurons for one week prevents the development of neuropathic pain-like hypersensitivity in CPN-ligated mice.

References

    1. Costigan M, Scholz J, Woolf CJ. Neuropathic pain: a maladaptive response of the nervous system to damage. Annu Rev. Neurosci. 2009;32:1–32. doi: 10.1146/annurev.neuro.051508.135531. - DOI - PMC - PubMed
    1. Colloca L, et al. Neuropathic pain. Nat. Rev. Dis. Prim. 2017;3:17002. doi: 10.1038/nrdp.2017.2. - DOI - PMC - PubMed
    1. Basbaum AI, Bautista DM, Scherrer G, Julius D. Cellular and molecular mechanisms of pain. Cell. 2009;139:267–284. doi: 10.1016/j.cell.2009.09.028. - DOI - PMC - PubMed
    1. Bushnell MC, Ceko M, Low LA. Cognitive and emotional control of pain and its disruption in chronic pain. Nat. Rev. Neurosci. 2013;14:502–511. doi: 10.1038/nrn3516. - DOI - PMC - PubMed
    1. Kuner R, Flor H. Structural plasticity and reorganisation in chronic pain. Nat. Rev. Neurosci. 2016;18:20–30. doi: 10.1038/nrn.2016.162. - DOI - PubMed

Publication types

MeSH terms