. 2020 Nov 25;11(1):5992.
doi: 10.1038/s41467-020-19781-y.

Cellular and gene signatures of tumor-infiltrating dendritic cells and natural-killer cells predict prognosis of neuroblastoma

Affiliations

Cellular and gene signatures of tumor-infiltrating dendritic cells and natural-killer cells predict prognosis of neuroblastoma

Ombretta Melaiu et al. Nat Commun. .

Abstract

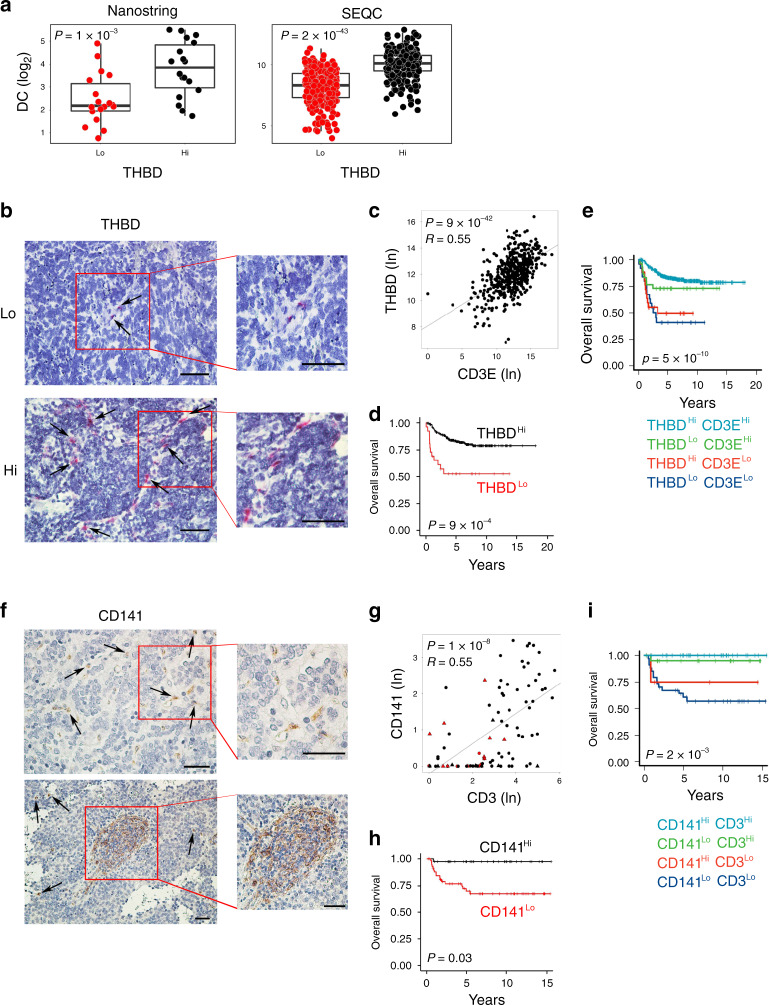
Tumor-infiltrating lymphocytes play an essential role in improving clinical outcome of neuroblastoma (NB) patients, but their relationship with other tumor-infiltrating immune cells in the T cell-inflamed tumors remains poorly investigated. Here we show that dendritic cells (DCs) and natural killer (NK) cells are positively correlated with T-cell infiltration in human NB, both at transcriptional and protein levels, and associate with a favorable prognosis. Multiplex imaging displays DC/NK/T cell conjugates in the tumor microenvironment of low-risk NB. Remarkably, this connection is further strengthened by the identification of gene signatures related to DCs and NK cells able to predict survival of NB patients and strongly correlate with the expression of PD-1 and PD-L1. In summary, our findings unveil a key prognostic role of DCs and NK cells and indicate their related gene signatures as promising tools for the identification of clinical biomarkers to better define risk stratification and survival of NB patients.


Conflict of interest statement

The authors declare no competing interests.

Figures

Fig. 1
Fig. 1. CD3E expression is associated with antitumor immune responses in human neuroblastoma.
a Heatmap of the normalized expression of immune genes ordered from left to right by increasing levels of CD3E expression of 498 NB patients from the SEQC-NB available in the GEO database. b Gene ontology term enrichment analysis performed by DAVID Bioinformatics Resources (https://david.ncifcrf.gov/) reveals 13 statistically significant (Benjamini–Hochberg adjusted P value <0.05) biological processes controlled by upregulated genes among patients with high CD3E expression. ce Correlation of CD3E expression with the indicated genes in NB patients. Gene transcripts reported to be associated with increased immune cell infiltration, immune cell trafficking, and immune functional status,– were studied in the SEQC-NB dataset. Genes that met the following criteria: (i) a correlation coefficient (R) greater than or equal to at least 0.4 with statistical significance (P < 0.05), (ii) a significantly different expression between patients with high and low CD3E expression, and (iii) showing consensus in the Nanostring cohort, were displayed. Robust F-test (two-sided) on the robust regression fit of a linear model was used for data analysis. c Cytokines and chemokines involved in immune cell trafficking. d Activation and exhaustion molecules. e DC and NK-cell function markers. Correlations were assessed measuring the coefficient of determination of a robust linear regression model fit on the data (see “Statistical analysis”). No adjustment was required unless otherwise stated. Statistically significant P values are indicated.
Fig. 2
Fig. 2. Intratumoral DCs and NK cells correlate with CD3E gene expression in human neuroblastoma.
Box plots of metagene expression values for the indicated immune cell types according to the high (Hi) and low (Lo) levels of CD3E mRNA (median split) in primary NB patients from Nanostring-NB (n = 36) and the SEQC-NB (n = 498) cohorts. The immune cell type scores were calculated as the average expression values of the NanoString constituent genes. The boxes show the 25th to 75th percentile; the horizontal lines inside the box represent the median; the upper whisker extends to the largest data point, no more than 1.5 times the IQR from the box; the lower whisker extends to the smallest data point at most 1.5 times the IQR from the box; the dots are individual samples. Data were analyzed by Kruskal–Wallis rank-sum test (two-sided). No adjustment was required. Statistically significant P values are indicated.
Fig. 3
Fig. 3. Intratumoral DC levels correlate with increased survival in human neuroblastoma.
a Box plots of the DC gene signature according to the high and low levels of THBD gene expression (median split) in primary NB lesions from Nanostring-NB (n = 36) and SEQC-NB (n = 498) cohorts. DC signature score was calculated as the average expression values of the NanoString constituent genes. The boxes show the 25th to 75th percentile; the horizontal lines inside the box represent the median; the upper whisker extends to the largest data point, no more than 1.5 times the IQR from the box; the lower whisker extends to the smallest data point at most 1.5 times the IQR from the box; the dots are individual samples. Data were analyzed by Kruskal–Wallis rank-sum test (two-sided). b Representative images of NB tissue sections analyzed for THBD expression using RNAscope (red dots). Nuclei were counterstained with hematoxylin (blue). THBD positive cells are indicated by black arrows. Original magnification ×40 (left) and ×60 (right). Scale bar, 30 μm. c Correlation between THBD and CD3E gene expression in NB patients, analyzed by robust F-test (two-sided) in SEQC-NB (n = 498). d, e Kaplan–Meier curves show the duration of overall survival of NB patients according to the THBD gene expression either alone (d), or in combination with CD3E gene (e) in SEQC-NB (n = 498). Log-rank test with Miller and Siegmund P-value correction was used. f Representative examples of CD141 staining in primary NB lesions. Upper and lower panels, CD141-expressing cells sparsely distributed within tumor nests or localized within TLS, respectively. Brown, CD141-expressing cells. Nuclei were counterstained with hematoxylin (blue). CD141 positive cells are indicated by black arrows. Original magnifications, ×40 (up left), ×60 (up right), ×20 (down left), and ×40 (down right). Scale bars, 30 μm. g Scatter plot showing the correlation between CD141+ and CD3+ cell densities in NB patients, analyzed by robust F-test (two-sided). Black and red dots, patients who are alive and dead, respectively; triangle and dots, MYCN amplified and non-amplified patients, respectively. h, i Kaplan–Meier curves of overall survival of NB patients (n = 104) according to the density of CD141+ cells alone (h) or in combination with CD3+ cell densities (i). Log-rank test with Miller and Siegmund P-value correction was used. Correlations in c and g were assessed measuring the coefficient of determination of a robust linear regression model fit on the data (see “Statistical analysis"). The representative images in b and f were selected from n = 104 biologically independent NB specimens. Hi high, Lo low. No adjustment was required unless otherwise stated. Statistically significant P values are indicated.
Fig. 4
Fig. 4. Intratumoral NK-cell levels correlate with increased survival in human neuroblastoma.
a Box plots of the NK gene signature according to the high and low levels of NCR1 gene expression (median split) in primary NB lesions from Nanostring-NB (n = 36) and SEQC-NB (n = 498) cohorts. CD56dim NK-cell signature score was calculated as the average expression values of the NanoString constituent genes. The boxes show the 25th to 75th percentile; the horizontal lines inside the box represent the median; the upper whisker extends to the largest data point, no more than 1.5 times the IQR from the box; the lower whisker extends to the smallest data point at most 1.5 times the IQR from the box; the dots are individual samples. Data were analyzed by Kruskal–Wallis rank-sum test (two-sided). b Representative images of NB tissue sections probed for NCR1 expression using RNAscope (Red dots). Nuclei were counterstained with hematoxylin (blue). NCR1-positive cells are indicated by black arrows. Magnification with ×40 (left) and ×60 (right). Scale bar, 30 μm. c Correlation between NCR1 and CD3E gene expression in NB patients, analyzed by robust F-test (two-sided) in SEQC-NB (n = 498). d, e Kaplan–Meier curves of overall survival of NB patients according to the NCR1 gene expression either alone (d) or in combination with CD3E gene (e) in SEQC-NB (n = 498). Log-rank test with Miller and Siegmund P value correction was used. f Representative example of NKp46 cell staining in primary NB lesion. Red, NKp46-expressing cells. Nuclei are counterstained with hematoxylin (blue). NKp46-positive cells are indicated by black arrows. Magnification with ×20 (left) and ×40 (right). Scale bar, 30 μm. g Scatter plot showing the correlation between NKp46+ and CD3+ cell densities in NB patients, analyzed by robust F-test (two-sided). Black and red dots, patients who are alive and dead, respectively; triangle and dots, MYCN amplified and non-amplified NB patients, respectively. h, i Kaplan–Meier curves of overall survival of NB patients according to the NKp46 protein expression either alone (h) or in combination with CD3+ cell densities (i). Log-rank test with Miller and Siegmund p-value correction was used. Correlations in c and g were assessed measuring the coefficient of determination of a robust linear regression model fit on the data (see “Statistical analysis”). The representative images in b and f were selected from n = 104 biologically independent NB specimens. Hi high. Lo low. No adjustment was required unless otherwise stated. Statistically significant P values are indicated.
Fig. 5
Fig. 5. Cross-correlation between intratumoral DCs and NK cells in human neuroblastoma.
a Multiple immunofluorescence staining of NB tumor lesions for CD8 (white), CD141 (green), and NKp46 (red), shown at magnification ×60 (zoom), scale bar 30 μm. Four representative scenarios of these cells within the tumor are shown: (1) CD8+, CD141+ and NKp46+ cells in close proximity to each other; (2) CD141+ cells interacting with NKp46+ cells; (3) CD141+ cells interacting with CD8+ T cells; (4) CD141+ cells interacting with both CD8+ and NKp46+ cells. Images with nuclei (Hoechst) are shown on the right of each panel. Red blood cells are indicated by yellow arrows. Quantitative analysis of the indicated immune cells from n = 7 biologically independent highly infiltrated NBs is shown on the right. Plotted as mean ± S.D. and analyzed by Kruskal–Wallis test to generate two-tailed P values. b, c Box plots of the NK gene signature according to the high and low levels of THBD gene expression (median split) (b), and of the DC gene signature according to the high and low levels of NCR1 gene expression (median split) (c) in primary NB lesions from Nanostring-NB (n = 36) and SEQC-NB (n = 498) cohorts. DC and CD56dim NK-cell signature scores were calculated as the average expression values of the NanoString constituent genes. Kruskal–Wallis rank-sum test (two-sided) was used. The boxes show the 25th to 75th percentile; the horizontal lines inside the box represent the median; the upper whisker extends to the largest data point, no more than 1.5 times the IQR from the box; the lower whisker extends to the smallest data point at most 1.5 times the IQR from the box; the dots are individual samples. d, e Correlation between NCR1 and THBD gene expression on SEQC-NB dataset (n = 498) (d) and NKp46+ and CD141+ cell densities (n = 104 independent biological specimens) (e) in NB patients. In e, black and red dots, patients who are alive and dead, respectively; triangle and dots, MYCN amplified and non-amplified patients, respectively. Robust F-test (two-sided) was used for data analysis. f, g Kaplan–Meier curves of overall survival of NB patients according to the combined expression of THBD and NCR1 gene (f) and CD141 and NKp46 protein (g) levels on 498 and 104 NB independent biological specimens, respectively. In g, due to its low frequency, the group NKp46Low-CD141High was omitted. Log-rank test with Miller and Siegmund P-value correction was used. Correlations in d and e were assessed measuring the coefficient of determination of a robust linear regression model fit on the data (see “Statistical analysis”). Hi high, Lo low. No adjustment was required unless otherwise stated. Statistically significant P values are indicated. n.s = not significant.
Fig. 6
Fig. 6. DC and NK gene signatures positively correlate with increased neuroblastoma patient survival.
a Volcano plots displaying the expression levels of immune genes according to THBDhigh and NCR1high (left panels). Genes significantly upregulated are shown in red (fold change >2, Q or P values <0.05). Genes significantly downregulated are shown in blue (fold change < - 2, Q value <0.05). A summary of the selected genes is shown in the right panels. b Heatmap of the genes expressed on DCs, NK cells, and other (−) cell types (left panel). Prognostic value of the indicated genes using SEQC-NB (n = 498) cohort in multivariate Cox proportional hazards survival analyses (right panels). Data are expressed as a hazard ratio with 95% confidence intervals (CI); a value <1 means increased overall survival, and >1 means decreased overall survival. c Protein–protein interaction network for protective genes associated with either THBD or NCR1 expressed by DCs and/or NK cells detected with STRING database (http://string-db.org/). The network nodes and the lines represent each protein and protein–protein associations, respectively. The color of the line indicates the type of interaction, i.e., black lines highlight the co-expression between most of the genes analyzed; the pink, blue, and green lines delineate the protein interactions validated experimentally, in silico or identified by literature, respectively. d Representative images selected from n = 104 biologically independent NB specimens. Tissue sections were probed for BIRC5, CDK1, and PBK expression using RNAscope (red dots). Nuclei were counterstained with hematoxylin (blue). Original magnification, ×40. Scale bar, 30 μm. e Heatmaps showing the normalized expression values of the protective and risky genes associated with either THBD or NCR1 and expressed by DCs and/or NK cells in NB patients. f Kaplan–Meier curves for overall survival of NB patients in SEQC-NB (n = 498) cohort. Log-rank test with Miller and Siegmund P-value correction was used. g Correlation of CD274, PDCD1 expression with the indicated genes in SEQC-NB patients; red circle indicates the protective genes (FC > 2 and HR < 1), blue circle indicates the risky genes (FC < −2 and HR > 1). Correlations were assessed measuring the coefficient of determination of a robust linear regression model fit on the data (see “Statistical analysis”). Hi high, Lo low. Statistically significant P values are indicated.

Similar articles

Cited by

References

    1. Fridman WH, Pages F, Sautes-Fridman C, Galon J. The immune contexture in human tumours: impact on clinical outcome. Nat. Rev. Cancer. 2012;12:298–306. doi: 10.1038/nrc3245. - DOI - PubMed
    1. Chen DS, Mellman I. Elements of cancer immunity and the cancer-immune set point. Nature. 2017;541:321–330. doi: 10.1038/nature21349. - DOI - PubMed
    1. Galon J, Bruni D. Approaches to treat immune hot, altered and cold tumours with combination immunotherapies. Nat. Rev. Drug Discov. 2019;18:197–218. doi: 10.1038/s41573-018-0007-y. - DOI - PubMed
    1. Galon J, et al. Type, density, and location of immune cells within human colorectal tumors predict clinical outcome. Science. 2006;313:1960–1964. doi: 10.1126/science.1129139. - DOI - PubMed
    1. Pages F, et al. Effector memory T cells, early metastasis, and survival in colorectal cancer. N. Engl. J. Med. 2005;353:2654–2666. doi: 10.1056/NEJMoa051424. - DOI - PubMed

Publication types

MeSH terms