

Arousal influences olfactory abilities in adults with different degree of food neophobia
- PMID: 33239637
- PMCID: PMC7689524
- DOI: 10.1038/s41598-020-77428-w
Arousal influences olfactory abilities in adults with different degree of food neophobia
Abstract
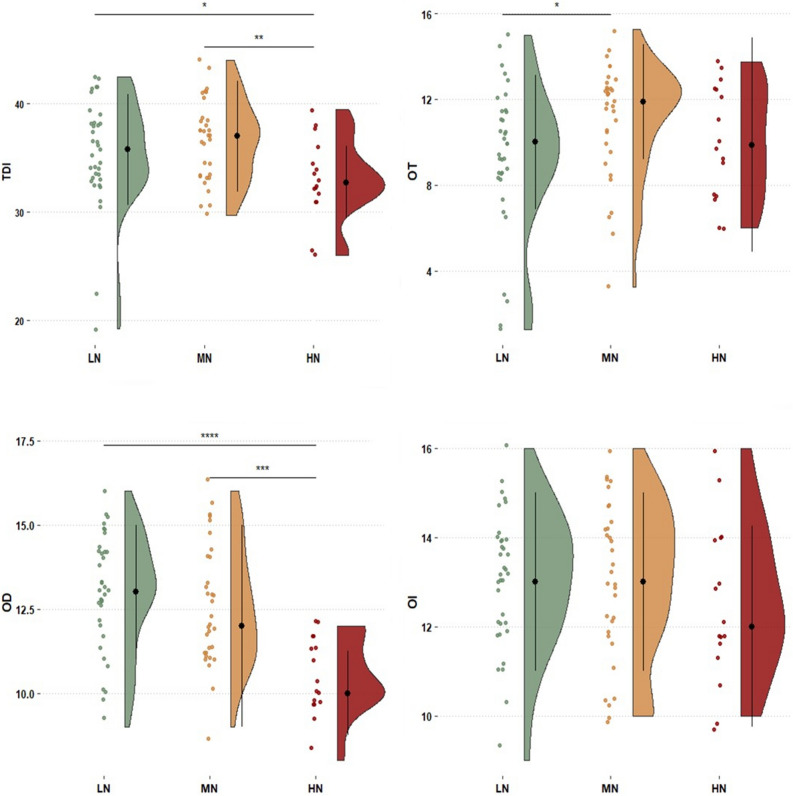
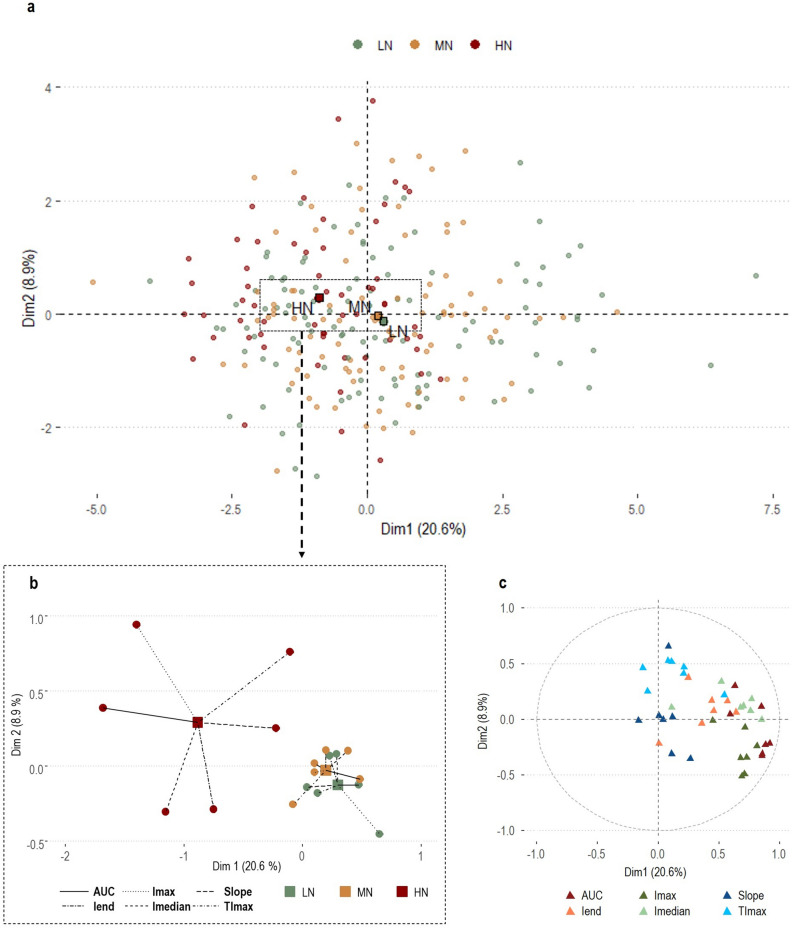
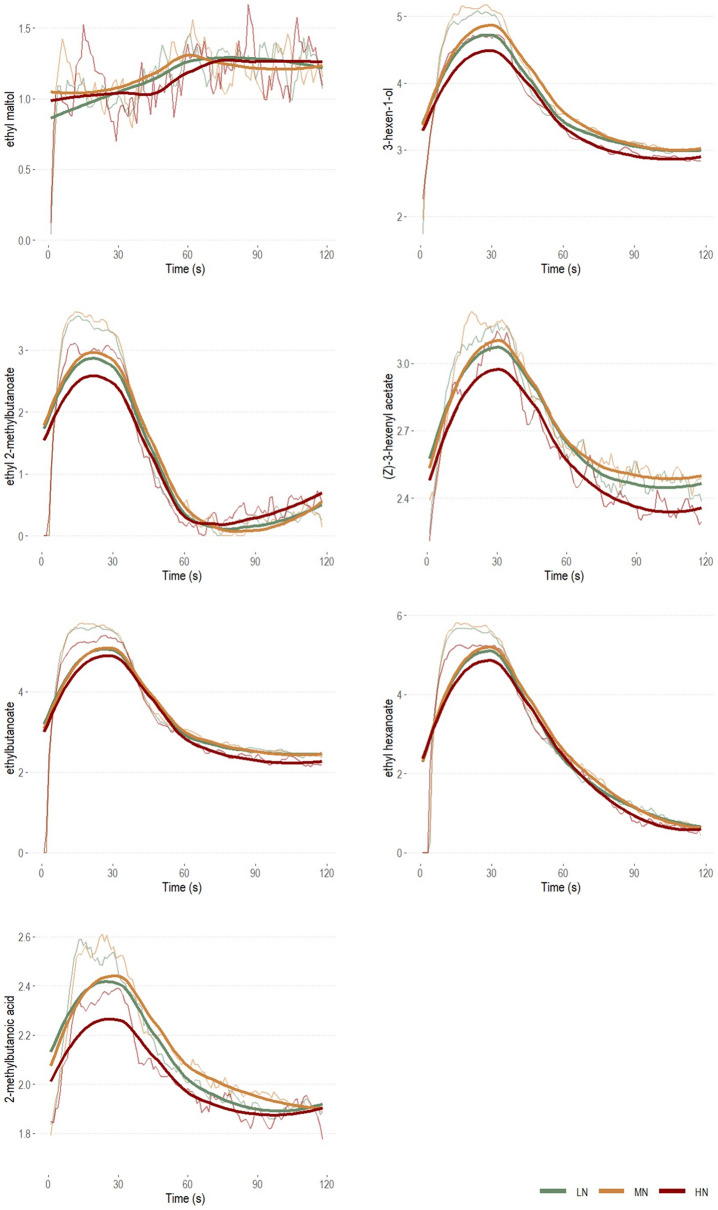
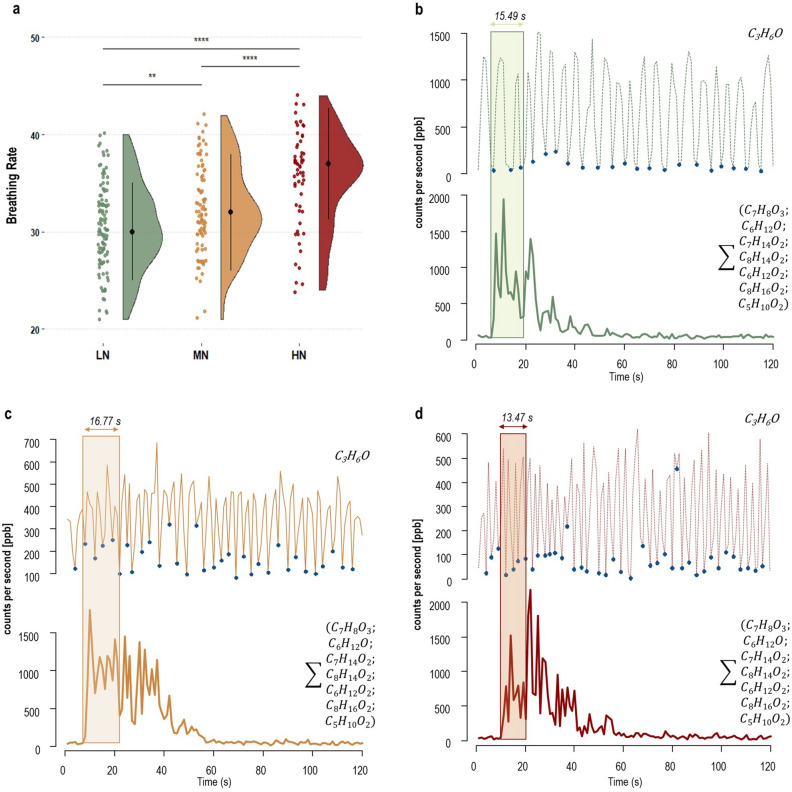
Food neophobia, i.e., the aversion to novel foods, and olfaction are both factors strongly affecting food choices. Mounting evidence suggests a higher arousal towards food as a key factor underlying the reluctance to eat what is unfamiliar to us. As the role of olfaction behind this phenomenon is poorly understood, we explored the associations between food neophobia and trait anxiety, olfactory functions (odor threshold, discrimination and identification) and retronasal aroma release from a reference food in a healthy cohort of 83 adult volunteers. We grouped participants in Low-Neophobics or neophilics (n = 35), Medium-Neophobics (n = 32) and High-Neophobics (n = 16) according to the widely recognized Food Neophobia Scale. Participants with higher neophobic tendencies were found to have marginally higher trait anxiety levels than neophilics (p = 0.10). A lower global olfactory functioning and odor discrimination abilities characterized High-Neophobics, while Medium-Neophobics showed a higher odor sensitiveness than Low-Neophobics. Lastly, High-Neophobics showed a lower extent of retronasal aroma release, likely due to a shorter duration of oral processing and higher anxiety-related physiological responses (such as breathing rate). In summary, this study supports the assumption that the conflicting relationship that neophobics have with food may be led by higher levels of arousal toward foods, rather than different chemosensory functions.
Conflict of interest statement
The authors declare no competing interests.
Figures
Similar articles
-
Child food neophobia and sympathetic arousal in response to odor exposure.Neuroscience. 2025 May 7;573:264-271. doi: 10.1016/j.neuroscience.2025.03.048. Epub 2025 Mar 24. Neuroscience. 2025. PMID: 40139642
-
Food neophobia, odor evaluation and exploratory sniffing behavior.Appetite. 1998 Oct;31(2):171-83. doi: 10.1006/appe.1998.0161. Appetite. 1998. PMID: 9792731
-
Food Neophobia among Adults: Differences in Dietary Patterns, Food Choice Motives, and Food Labels Reading in Poles.Nutrients. 2021 May 10;13(5):1590. doi: 10.3390/nu13051590. Nutrients. 2021. PMID: 34068662 Free PMC article.
-
Food neophobia and its relation with olfaction.Front Psychol. 2014 Feb 17;5:127. doi: 10.3389/fpsyg.2014.00127. eCollection 2014. Front Psychol. 2014. PMID: 24596565 Free PMC article. Review.
-
Food neophobia in children.Pediatr Endocrinol Diabetes Metab. 2019;25(3):150-154. doi: 10.5114/pedm.2019.87711. Pediatr Endocrinol Diabetes Metab. 2019. PMID: 31769273 Review. English.
Cited by
-
Olfactory performance and odor liking are negatively associated with food neophobia in children aged between 3 and 9 years.Nutr J. 2024 Sep 11;23(1):105. doi: 10.1186/s12937-024-01011-6. Nutr J. 2024. PMID: 39261883 Free PMC article.
-
Arousal and the modulation of sensory experience: evidence from food-related emotions.Philos Trans R Soc Lond B Biol Sci. 2024 Aug 26;379(1908):20230255. doi: 10.1098/rstb.2023.0255. Epub 2024 Jul 15. Philos Trans R Soc Lond B Biol Sci. 2024. PMID: 39005029 Review.
-
Food neophobia and intervention of university students in China.Food Sci Nutr. 2021 Sep 14;9(11):6224-6231. doi: 10.1002/fsn3.2575. eCollection 2021 Nov. Food Sci Nutr. 2021. PMID: 34760252 Free PMC article.
-
Food Neophobia, Odor and Taste Sensitivity, and Overall Flavor Perception in Food.Foods. 2021 Dec 16;10(12):3122. doi: 10.3390/foods10123122. Foods. 2021. PMID: 34945673 Free PMC article.
References
-
- Rozin P. The Selection of Foods by Rats, Humans, and Other Animals. Adv. Study Behav. 1976 doi: 10.1016/S0065-3454(08)60081-9. - DOI
-
- Fischler C. L'homme omnivore. Paris: Editions Odile Jacob; 1990.
Publication types
MeSH terms
Substances
LinkOut - more resources
Full Text Sources
Research Materials
