. 2020 Nov 25;3(1):707.
doi: 10.1038/s42003-020-01438-7.

Differences in visually induced MEG oscillations reflect differences in deep cortical layer activity

Affiliations

Differences in visually induced MEG oscillations reflect differences in deep cortical layer activity

Dimitris A Pinotsis et al. Commun Biol. .

Abstract

Neural activity is organized at multiple scales, ranging from the cellular to the whole brain level. Connecting neural dynamics at different scales is important for understanding brain pathology. Neurological diseases and disorders arise from interactions between factors that are expressed in multiple scales. Here, we suggest a new way to link microscopic and macroscopic dynamics through combinations of computational models. This exploits results from statistical decision theory and Bayesian inference. To validate our approach, we used two independent MEG datasets. In both, we found that variability in visually induced oscillations recorded from different people in simple visual perception tasks resulted from differences in the level of inhibition specific to deep cortical layers. This suggests differences in feedback to sensory areas and each subject's hypotheses about sensations due to differences in their prior experience. Our approach provides a new link between non-invasive brain imaging data, laminar dynamics and top-down control.


Conflict of interest statement

The authors declare no competing interests.

Figures

Fig. 1
Fig. 1. Model and predictions.
a Two pairs of excitatory (black) and inhibitory (red) populations occupy superficial and deep cortical layers. Firing rates within each population provide inputs to other populations and convolution of presynaptic activity produces postsynaptic depolarization. Arrows denote excitatory and inhibitory connections. All recurrent connections are inhibitory to preclude run-away excitation in the network. The same microcircuit was implemented both as a neural mass and a compartmental model. The equations describe the evolution of hidden states corresponding to activity in each of the four populations in the neural mass model. b Both models predict LFPs and power spectra. The top plot shows predicted power spectra from both models generated by superficial pyramidal neurons. Predictions from the neural mass model are shown in magenta, while predictions from the compartmental model are shown in green together with 95% confidence intervals. The bottom plot shows the same results for predicted spectra from deep pyramidal neurons. Insets in the top right corner of both plots show predicted LFPs. Note the peaked responses at 10 Hz that are reminiscent of spiking burst input that are also captured by the neural mass model responses.
Fig. 2
Fig. 2. Outline.
a Schematic of our analysis pipeline. This summarizes the steps of our approach: 1. Simulate data from the compartmental model. 2. Fit the mass model to these data. 3. Use the parameter estimates obtained as priors for fitting M/EEG data. 4. Obtain hidden parameters that describe laminar dynamics. b Construction of the neural mass model: We first establish a similarity between the model of ref. and its symmetric variant. Here horizontal arrows of different widths in the left panel denote asymmetric connectivities and delays between mini-columns depicted as rectangles containing Superficial and Deep Pyramidal cells (SP and DP) and Inhibitory Interneurons (IN). In the right panel, a symmetrization of the compartmental model reduces the number of connectivity parameters to be the same as those in a homologous neural mass model. c Construct validity of the mass model. To demonstrate this, we fitted the mass model to synthetic (laminar) data obtained from its compartmental homologue. This is justified by statistical decision theory. Red and green lines in the middle panel correspond to real data and model predictions. Solid and dashed lines to real and imaginary parts of crossspectra between deep and superficial pyramidal neurons.
Fig. 3
Fig. 3. Model fits to data.
a Empirical responses (power spectra) and model fits are shown in dashed and solid lines along with 95% confidence intervals across subjects for the data from ref. (smallest stimulus size; grand average across all subjects). These quantify variability across subjects and overlap for model predictions and data predictions. Differences in power spectra between conditions for the same subject are small and spectra corresponding to different stimulus sizes overlap. b Example model fits to individual subjects in data from ref. . Fits are obtained for all three stimulus sizes simultaneously by modeling different sizes as condition-specific effects. The three stimulus sizes correspond to red, blue and green lines. Dashed and solid lines correspond to data and model.
Fig. 4
Fig. 4. Connection changes in data from ref. .
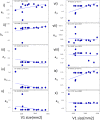
a Correlations between connectivity parameters and V1 size. Parameters were obtained by fitting data from ref. . Changes in the drive to deep pyramidal neurons from both superficial interneurons, a31 (iii) and deep pyramidals, a33 (x) correlated with V1 size. Also changes in the drive to deep interneurons, a34 (v) and drive to inhibitory interneurons in superficial cells, a14 (ii). b Correlations between connectivity parameters and gamma peak frequency. Parameters were obtained by fitting data from ref. . Changes to the drive to superficial pyramidal neurons correlated with peak frequency, a41 (viii). Least-squares fitted line shown in magenta.
Fig. 5
Fig. 5. Connection changes in data from ref. .
Correlations between connectivity parameters and V1 size using data from ref. . Changes in the connections between the deep pair of excitatory and inhibitory populations, a23 and a32, significantly correlated with different V1 sizes (vi and ix). Least-squares fitted line shown in blue.
Fig. 6
Fig. 6. V1 size predictors.
a We scored alternative GLMs where predictors of variability in V1 included any combination of the connections (arrows) in Fig. 1a. We found that for the data from ref. V1 size could be best predicted by the recurrent connectivity of deep inhibitory interneurons, a22 (brown arrow). Evidence in favour of a GLM including a22 was very strong p > 0.95. b Same as in a for data from ref. . V1 size variability reported in ref. could be best predicted by the inhibitory drive to deep pyramidal cells, a31 (brown arrow). Evidence for the corresponding GLM was weak p > 0.5.

Similar articles

Cited by

References

    1. Pearlson GD, Clementz BA, Sweeney JA, Keshavan MS, Tamminga CA. Does biology transcend the symptom-based boundaries of psychosis? Psychiatr. Clin. 2016;39:165–174. - PMC - PubMed
    1. Fellous J-M, Sapiro G, Rossi A, Mayberg HS, Ferrante M. Explainable artificial intelligence for neuroscience: behavioral neurostimulation. Front. Neurosci. 2019;13:1346. doi: 10.3389/fnins.2019.01346. - DOI - PMC - PubMed
    1. Montague PR, Dolan RJ, Friston KJ, Dayan P. Computational psychiatry. Trends Cogn. Sci. 2012;16:72–80. doi: 10.1016/j.tics.2011.11.018. - DOI - PMC - PubMed
    1. Lovas G, Szilágyi N, Majtényi K, Palkovits M, Komoly S. Axonal changes in chronic demyelinated cervical spinal cord plaques. Brain. 2000;123:308–317. doi: 10.1093/brain/123.2.308. - DOI - PubMed
    1. Jones SR, Pritchett DL, Stufflebeam SM, Hämäläinen M, Moore CI. Neural correlates of tactile detection: a combined magnetoencephalography and biophysically based computational modeling study. J. Neurosci. 2007;27:10751–10764. doi: 10.1523/JNEUROSCI.0482-07.2007. - DOI - PMC - PubMed

Publication types